


PROFILE: NATHAN P. MYHRVOLD
The Physicist as a Young Businessman |
terÕs in geophysics and space sciences. |
|||||
A year or so later he added a second |
||||||
|
|
|
|
|||
|
|
|
|
masterÕs degree to his collection, this |
||
|
athan P. Myhrvold leans back in |
Òbungee jumping,Ó in which the intrepid |
time in mathematical economics from |
|||
|
his chair, arms folded behind his |
jumpers are snatched from deathÕs door |
Princeton University. |
|||
|
head, legs stretched out. A mop |
by elastic cords. But for United Way, he |
When it came time to choose a topic |
|||
of auburn curls tumbles around wire- |
happily leapt oÝ a bridge in Vancouver. |
for his doctoral thesis, Myhrvold cast |
||||
frame glasses, running into a thick |
Those who have joined the research |
about for one that demanded even more |
||||
beard. His shirt, hastily tucked into |
group have found Myhrvold a surpris- |
intellectual acrobatics. ÒI thought gen- |
||||
gray chinos, threatens to come undone |
ingly accessible boss. ÒWhat other com- |
eral relativity was pretty cool, and quan- |
||||
around the midriÝ. The ambience is ca- |
pany oÝers this kind of perk, where your |
tum-Þeld theory, curved space time and |
||||
sual; he could be holding after-class of- |
boss will spend an entire day slaving |
quantum gravity would be cooler yet,Ó |
||||
Þce hours at a university or rapping with |
over a hot barbecue, cooking your din- |
he recalls. So he wrapped them up to- |
||||
a partner in a start-up. |
|
ner?Ó demands Richard F. Rashid, whom |
gether and began looking for a way to |
|||
Instead this is MyhrvoldÕs |
|
|
|
explain gravity in the context of |
||
weekly t•te-ˆ-t•te strategy ses- |
|
|
|
quantum mechanics. ÒItÕs a near- |
||
sion with Microsoft chairman |
|
|
|
ly impossible problem,Ó he says |
||
William H. Gates. And Myhrvold, |
|
|
|
cheerfullyÑbut also a profound |
||
the companyÕs 33-year-old vice |
|
|
|
one. ÒI used to be able to get all |
||
president for advanced tech- |
|
|
|
worked up about it and say, |
||
nology and business develop- |
|
|
|
ÔWhat other possible thing should |
||
ment, has brought a serious |
|
|
|
someone study?Õ Ó |
||
agenda: new markets, possible |
|
|
|
Tackling cosmology is about |
||
acquisitions and the plans for |
|
|
|
as Òblue skyÓ as science gets. |
||
the companyÕs evolving research |
|
|
|
Even scarcer than the physical |
||
laboratory. The young, erstwhile |
|
|
|
evidence for theories are full- |
||
physicist stands just outside |
|
|
|
time jobs for the scientists who |
||
the spotlight but close to the |
|
|
|
pursue them. The very nature of |
||
helm. ÒOther than myself, Na- |
|
|
|
the challenges fuels a streak of |
||
than has more impact on our |
|
|
|
intellectual machismo. ÒIt takes |
||
long-term strategy than anyone |
|
|
|
this funny sort of ego, you know, |
||
else,Ó Gates says. |
|
|
|
playing chicken with Mother |
||
That responsibility seems to |
|
|
|
Nature,Ó Myhrvold says. |
||
rest comfortably on the shoul- |
|
|
|
ÒBy the time you get to grad- |
||
ders of someone who once spent |
|
|
|
uate school youÕve gone through |
||
his time trying to unravel the |
GENDREAU |
|
|
n people saying, ÔLook, you re- |
||
origins of the universe. Myhr- |
|
|
ally should consider something |
|||
vold joined Microsoft in Red- |
|
|
more practical,Õ Ó Myhrvold notes. |
|||
mond, Wash., less than seven |
|
|
ÒBut if they follow it up with |
|||
years ago, with one start-up |
RAYMOND |
|
|
something like, ÔOnly the most |
||
company and a brief stint with |
|
|
brilliant people get by,Õ are you |
|||
physicist Stephen W. Hawking |
|
|
going to say, ÔYeah, IÕm going to |
|||
|
|
|
||||
already on his rŽsumŽ. He now |
MICROSOFT VICE PRESIDENT Nathan P. Myhrvold leaps |
wimp out on this oneÕ?Ó |
||||
carries direct responsibility for |
into technical debatesÑand oÝ bridgesÑwith aplomb. |
MyhrvoldÕs thesis, ÒVistas in |
||||
creating both MicrosoftÕs re- |
|
|
|
Curved Space Quantum Field |
||
search laboratory and a parallel |
|
|
|
Theory,Ó which he completed at |
||
Òadvanced developmentÓ group, intend- |
Myhrvold coaxed away from Carnegie |
Princeton, oÝers a still unproved but |
||||
ed to help propel ideas into product. |
Mellon University. |
intriguing proposal for tidying up some |
||||
Myhrvold has spent his career chas- |
Unlike most others at Microsoft, Myhr- |
of the loose ends in the ÒinßationÓ ac- |
||||
ing Òvery hard but not insoluble prob- |
voldÕs interest in computers blossomed |
count of the origins of the universe. In- |
||||
lems,Ó driven by the bravura of a physi- |
late. He spent his grade school years in |
ßation theorists suggest that the uni- |
||||
cist and tempered by an irrepressible |
Santa Monica, Calif., soaking up science, |
verse began as a highly curved core of |
||||
sense of humor. Last autumn when the |
particularly ideas in mathematics and |
matter. At some point, that core explod- |
||||
local United Way chapter asked Mi- |
biology. By age 14, the only course sep- |
ed, exponentially expanding the size of |
||||
crosoft executives to volunteer for ac- |
arating him from a high school diplo- |
the universe and spewing forth stars |
||||
tivities that could be Òauctioned oÝÓ in |
ma was driverÕs education. He Þlled the |
and planets. What started the expansion |
||||
a fund-raising event, many oÝered to |
next two years by taking classes at San- |
and why it stopped remain subjects of |
||||
go see a movie or a ball game with the |
ta Monica City College and wound up |
debate. ÒMy mechanism turned it oÝ,Ó |
||||
successful bidder. Not Myhrvold. ÒIÕm |
graduating in 1979 from the University |
he proposes. |
||||
going to jump oÝ a bridge,Ó he brightly |
of California at Los Angeles with a bach- |
Yet even as he was Þnishing his the- |
||||
told a visitor. He had never |
tried |
elorÕs degree in mathematics and a mas- |
sis, MyhrvoldÕs attention began stray- |
|||
34 |
SCIENTIFIC AMERICAN February 1993 |
Copyright 1993 Scientific American, Inc. |
||||

ing to computers. A few scientists, including Stephen Wolfram, then at the Institute for Advanced Studies in Princeton, had begun writing computer programs that could manipulate equations with thousands of terms. Myhrvold and a few fellow students, in contrast, began tinkering with a program they envisioned could be a kind of word processor for mathematiciansÑsoftware that would deftly juggle the simpler equations that scientists use routinely.
Around the same time, Myhrvold won a postdoctoral position with Hawking at the University of Cambridge. He spent about a year in England working on such problems as Þnding a wave function for the entire universe. When summer arrived, Myhrvold took a leave from Cambridge to continue to work on software.
There was, however, a hitch. No operating system would support the kind of symbol manipulation Myhrvold and two fellow Princeton physicists wanted to do on an IBM-compatible personal computer. So the team, joined by MyhrvoldÕs younger brother and another friend, decided to Òspend just a little bit of time whipping up something that would be an operating environment, a little ÔwindowsÕ system,Ó Myhrvold says.
By the end of the summer, their work had tweaked the interest of a few venture capitalists. Myhrvold gave up his position with Hawking; one of his colleagues, another freshly minted physicist, never showed up for his postdoctoral position at the Fermi National Accelerator Laboratory. Working from the attic of a house in Berkeley, Calif., the group formed Dynamical Systems Research, with Myhrvold as president.
Unbeknownst to the ßedgling Dynamical Systems, a pack of other software writers were also busily writing similar code. Among them, Microsoft was in the early days of what would become ÒWindows.Ó IBM was building a similar operating system called ÒTopViewÓ for its line of advanced personal computers.
When IBM released TopView in 1985, enthusiasm for Dynamical SystemÕs work plummeted like a dead bird from a roof. ÒWe drove down to the IBM product center and got a demo,Ó Myhrvold says, sighing. In many ways, TopView oÝered the same capabilities that MyhrvoldÕs team had hoped to achieve.
So Dynamical Systems chose a risky path: the company Òcloned,Ó or mimicked, the functions of TopView, using only a quarter of the memory space. A handful of companies, including Merrill Lynch and a Þsh-canning plant in Denmark, signed up as customers. But Dynamical Systems continually teetered on the edge of insolvency. Most of its then dozen employees worked largely
Copyright 1993 Scientific American, Inc.
for stock options. ÒItÕs hard not to wonder if youÕve led them all astray, when the company is down to its last hundred bucks,Ó Myhrvold says.
Hope appeared in the form of Microsoft, which still was trying to coax IBM to buy into its nascent Windows user interface. To sweeten the oÝer, Microsoft pledged to make Windows compatible with TopView, primarily by adding in elements of Dynamical SystemsÕ soft-
Known for his 100-page memos on future technologies, Myhrvold sparks imaginations.
ware. In the process, Microsoft decided to buy the start-upÑcode, customers and physicists intact.
As it turned out, Microsoft never used the software written by Myhrvold and his team. TopView also faded from sight. Myhrvold nonetheless swiftly became engaged in the joint IBM-Micro- soft development of the interface for the operating system, OS/2. He also led the graphics team on a parallel project, which became Windows 2.0. By the mid1980s, the relationship between IBM and Microsoft was already growing fragile. The clashes and disappointments over OS/2 would push the two companies irrevocably apart by 1990. Microsoft continued to promote Windows, and IBM carried OS/2 alone.
Both Microsoft and IBM have reaped their shares of criticism for OS/2. In Computer Wars, a book scheduled for publication in February, industry analysts Charles H. Ferguson and Charles R. Morris argue that Gates and Microsoft made technical decisions that crippled OS/2Ñand knew it at the time.
Myhrvold vigorously denies the charge. ÒSome people think there was some deliberate bait and switch. ItÕs just absolutely not true,Ó he insists. ÒI tried very hard. Then came a point when I realized it just couldnÕt work. So I tried very hard to kill it. The joke at Microsoft is that I oÝer cradle-to-grave service on systems. Am I proud of that? I couldnÕt do anything diÝerentÑother than not work with IBM, and that wasnÕt feasible for us at the time.Ó
Edward Iacobucci, IBMÕs design leader for OS/2 and now chairman of Citrix Systems in Coral Springs, Fla., conÞrms that Myhrvold put his back into OS/2 and the proposed follow-on. DiÝerences in business strategies, not technology, pulled IBM and Microsoft apart, he says.
These days at Microsoft, Myhrvold spends much of his time thinking about
the future. His omnivorous curiosity is serving him in good stead as he sets the charter for the research and advanced technology groups, which he expects will top 120 people within two years. He tries to spark the imagination of the cadre of researchers by inviting artiÞcial-life experts and science Þction writers as guest lecturers. ÒHe has a compendium of knowledge,Ó says Edward Jung, a software architect at Microsoft. ÒAnd he writes these memosÑÓ
Indeed, memos have become a Myhrvold trademark. Using an ergonomically advantageous Dvorak keyboard, Myhrvold pounds out summaries of industrial trends or visions of the future, many of which number more than 100 pages. ÒHis memos are the equivalent of a Ph.D. thesis, done over a couple of days,Ó Rashid says, shaking his head.
The memos bring some of the best traits of a universityÑexploring ideas, conveying them to others and spurring discussionÑinto the corporate fold. The same features come through in MyhrvoldÕs discussions, whether with freshman employees or with Gates. At one of their weekly sessions, for instance, Myhrvold and Gates engaged in a spirited debate over the merits of so-called generalized sprites, a new twist on an old technique for controlling video frames.
ÒIntel had a sprite-based strategy,Ó Gates said, his voice rising skeptically. ÒAnd we were rather eloquent in telling them that it was a waste of siliconÑÓ
ÒYup,Ó Myhrvold interjected.
ÒBut now weÕre taking a new position?Ó Gates asked.
ÒWe are,Ó Myhrvold declared. Gates giggled.
ÒThe basic idea behind g-sprites is this,Ó Myhrvold said, snapping forward in his chair and grabbing the memo pad on the nearby coÝee table.
During the next few minutes, Myhrvold whizzed through an abbreviated tutorial on computer animation techniques, haphazardly sketching a few rectangles on the paper to bolster a point. Gates picked up on the ideas.
ÒSo, if weÕre fast enough now to have that guy,Ó pointing to one of the rectangles, ÒbeÑI donÕt know, IÕm not pointing at the right thingÑÓ
ÒYeah,Ó Myhrvold said, encouragingly. ÒÑto have this guy be essentially programmable, then thatÕs much better than
spritesÑÓ
ÒÑyesÑÓ
ÒÑin the old sense of the word,Ó Gates concluded.
ÒRight,Ó Myhrvold conÞrmed. Case closed. Within weeks, Microsoft would gather its energies and begin exploring a new strategy for supporting computer animation. ÑElizabeth Corcoran
SCIENTIFIC AMERICAN February 1993 |
35 |

Environmental Change
and Violent Conßict
Growing scarcities of renewable resources can contribute to social instability and civil strife
by Thomas F. Homer-Dixon, JeÝrey H. Boutwell and George W. Rathjens
Within the next 50 years, the human population is likely to exceed nine billion, and global
economic output may quintuple. Largely as a result of these two trends, scarcities of renewable resources may increase sharply. The total area of highly productive agricultural land will drop, as will the extent of forests and the number of species they sustain. Future generations will also experience the ongoing depletion and degradation of aquifers, rivers and other bodies of water, the decline of Þsheries, further stratospheric ozone loss and, perhaps, signiÞcant climatic change.
As such environmental problems become more severe, they may precipitate
THOMAS F. HOMER-DIXON, JEFFREY H. BOUTWELL and GEORGE W. RATHJENS are co-directors of the project on Environmental Change and Acute Conßict, which is jointly sponsored by the University of Toronto and the American Academy of Arts and Sciences. HomerDixon received his Ph.D. in political science from the Massachusetts Institute of Technology in 1989 and is now coordinator of the Peace and Conßict Studies Program at the University of Toronto.
Boutwell, who also received his Ph.D. from M.I.T., is associate executive oÛcer and program director of International Security Studies at the American Academy of Arts and Sciences. Rathjens earned his doctorate in chemistry at the University of California, Berkeley, and is currently professor of political science at M.I.T.
civil or international strife. Some concerned scientists have warned of this prospect for several decades, but the debate has been constrained by lack of carefully compiled evidence. To address this shortfall of data, we assembled a team of 30 researchers to examine a set of speciÞc cases. In studies commissioned by the University of Toronto and the American Academy of Arts and Sciences, these experts reported their initial Þndings.
The evidence that they gathered points to a disturbing conclusion: scarcities of renewable resources are already contributing to violent conßicts in many parts of the developing world. These conßicts may foreshadow a surge of similar violence in coming decades, particularly in poor countries where shortages of water, forests and, especially, fertile land, coupled with rapidly expanding populations, already cause great hardship.
Before we discuss the Þndings, it is important to note that the environment is but one variable in a series of political, economic and social factors that can bring about turmoil. Indeed, some skeptics claim that scarcities of renewable resources are merely a minor variable that sometimes links existing political and economic factors to
subsequent social conßict.
The evidence we have assembled supports a diÝerent view [see illustration on page 40]. Such scarcity can be an important force behind changes in the poli-
38 SCIENTIFIC AMERICAN February 1993
tics and economics governing resource use. It can cause powerful actors to strengthen, in their favor, an inequitable distribution of resources. In addition, ecosystem vulnerability often contributes signiÞcantly to shortages of renewable resources. This vulnerability is, in part, a physical given: the depth of upland soils in the tropics, for example, is not a function of human social institutions or behavior. And Þnally, in many parts of the world, environmental degradation seems to have passed a threshold of irreversibility. In these situations, even if enlightened social change removes the original political, economic and cultural causes of the degradation, it may continue to contribute to social disruption. In other words, once irreversible, environmental degradation becomes an independent variable.
Skeptics often use a diÝerent argument. They state that conßict arising from resource scarcity is not particularly interesting, because it has been common throughout human history. We maintain, though, that renewableresource scarcities of the next 50 years will probably occur with a speed, complexity and magnitude unprecedented in history. Entire countries can now be deforested in a few decades, most of a regionÕs topsoil can disappear in a generation, and acute ozone depletion may take place in as few as 20 years.
Unlike nonrenewable resourcesÑincluding fossil fuels and iron oreÑrenewable resources are linked in highly complex, interdependent systems with many
Copyright 1993 Scientific American, Inc.

ARMY DETACHMENT patrols village in Assam, India, where in 1983 local tribespeople attacked migrant Muslims from Bangladesh. Members of the tribe had long accused the mi-
grants of stealing some of the regionÕs richest farmland. Before troops arrived to restore order, almost 1,700 Bengalis had been massacred in one incident alone.
nonlinear and feedback relations. The overextraction of one resource can lead to multiple, unanticipated environmental problems and sudden scarcities when the system passes critical thresholds.
Our research suggests that the social and political turbulence set in motion by changing environmental conditions will not follow the commonly perceived pattern of scarcity conßicts. There are many examples in the past of one group
or nation trying to seize the resources of another. For instance, during World War II, Japan sought to secure oil, minerals and other resources in China and Southeast Asia.
Currently, however, many threatened renewable resources are held in commonÑincluding the atmosphere and the oceansÑwhich makes them unlikely to be the object of straightforward clashes. In addition, we have come to under-
stand that scarcities of renewable resources often produce insidious and cumulative social eÝects, such as population displacement and economic disruption. These events can, in turn, lead to clashes between ethnic groups as well as to civil strife and insurgency. Although such conßicts may not be as conspicuous or dramatic as wars over scarce resources, they may have serious repercussions for the security inter-
Copyright 1993 Scientific American, Inc. |
SCIENTIFIC AMERICAN February 1993 39 |

ests of the developed and the developing worlds.
Human actions bring about scarcities of renewable resources in three principal ways. First, peo-
ple can reduce the quantity or degrade the quality of these resources faster than they are renewed. This phenomenon is often referred to as the consumption of the resourceÕs ÒcapitalÓ: the capital generates ÒincomeÓ that can be tapped for human consumption. A sustainable economy can therefore be deÞned as one that leaves the capital intact and undamaged so that future generations can enjoy undiminished income. Thus, if topsoil creation in a region of farmland is 0.25 millimeter per year, then average soil loss should not exceed that amount.
The second source of scarcity is population growth. Over time, for instance, a given ßow of water might have to be divided among a greater number of people. The Þnal cause is change in the distribution of a resource within a society.
Such a shift can concentrate supply in the hands of a few, subjecting the rest to extreme scarcity.
These three origins of scarcity can operate singly or in combination. In some cases, population growth by itself will set in motion social stress. Bangladesh, for example, does not suÝer from debilitating soil degradation or from the erosion of agricultural land: the annual ßooding of the Ganges and Brahmaputra rivers deposits a layer of silt that helps to maintain the fertility of the countryÕs vast ßoodplains.
But the United Nations predicts that BangladeshÕs current population of 120 million will reach 235 million by the year 2025. At about 0.08 hectare per capita, cropland is already desperately scarce. Population density is 785 people per square kilometer (in comparison, population density in the adjacent Indian state of Assam is 284 people per square kilometer). Because all the countryÕs good agricultural land has been exploited, population growth will cut in half the amount of cropland available
Three Views of the Role That Scarcity ofý Renewable Resources Plays in Violent Conflict
POLITICAL |
SOCIAL |
AND |
|
ECONOMIC |
CONFLICT |
FACTORS |
|
|
SCARCITY OF |
|
RENEWABLE RESOURCES |
POLITICAL |
SOCIAL |
AND |
|
ECONOMIC |
CONFLICT |
FACTORS |
|
|
SCARCITY OF |
|
RENEWABLE RESOURCES |
|
ECOSYSTEM |
|
VULNERABILITY |
POLITICAL |
SOCIAL |
AND |
|
ECONOMIC |
CONFLICT |
FACTORS |
|
|
IRREVERSIBLE |
|
SCARCITY OF |
|
RENEWABLE RESOURCES |
40 SCIENTIFIC AMERICAN February 1993
per capita by 2025. Flooding and inadequate national and community institutions for water control exacerbate the lack of land and the brutal poverty and turmoil it engenders.
Over the past 40 years, millions of people have migrated from Bangladesh to neighboring areas of India, where the standard of living is often better. Detailed data on the movements are few: the Bangladeshi government is reluctant to admit there is signiÞcant migration because the issue has become a major source of friction with India. Nevertheless, one of our researchers, Sanjoy Hazarika, an investigative journalist and reporter at the New York Times in New Delhi, pieced together demographic information and expertsÕ estimates. He concludes that Bangladeshi migrants and their descendants have expanded the population of neighboring areas of India by 15 million. (Only one to two million of those people can be attributed to migrations during the 1971 war between India and Pakistan that resulted in the creation of Bangladesh.)
This enormous ßux has produced pervasive social changes in the receiving Indian states. Conßict has been triggered by altered land distribution as well as by shifts in the balance of political and economic power between religious and ethnic groups. For instance, members of the Lalung tribe in Assam have long resented Bengali Muslim migrants: they accuse them of stealing the areaÕs richest farmland. In early 1983, during a bitterly contested election for federal oÛces in the state, violence Þnally erupted. In the village of Nellie, Lalung tribespeople massacred nearly 1,700 Bengalis in one Þve-hour rampage.
In the state of Tripura the original Buddhist and Christian inhabitants now make up less than 30 percent of the population. The remaining percentage consists of Hindu migrants from either East Pakistan or Bangladesh. This shift in the ethnic balance precipitated a violent insurgency between 1980 and 1988 that was called oÝ only after the government agreed to return land to dispossessed Tripuris and to stop the inßux of Bangladeshis. As the migration has continued, however, this agreement is in jeopardy.
Population movements in this part of South Asia are, of course, hardly new. During the colonial period, the British imported Hindus from Calcutta to administer Assam, and Bengali was made the oÛcial language. As a result, the Assamese are particularly sensitive to the loss of political and cultural control in the state. And Indian politicians have often encouraged immigration in
Copyright 1993 Scientific American, Inc.

order to garner votes. Yet today changes in population density in Bangladesh are clearly contributing to the exodus. Although the contextual factors of religion and politics are important, they do not obscure the fact that a dearth of land in Bangladesh has been a force behind conßict.
In other parts of the world the three sources of scarcity interact to produce discord. Population growth and reductions in the quality and quantity of renewable resources can lead to large-scale development projects that can alter access to resources. Such a shift may lead to decreased supplies for poorer groups whose claims are violently opposed by powerful elites. A dispute that began in 1989 between Mauritanians and Senegalese in the Senegal River valley, which demarcates the common border between these countries, provides an example of such causality. Senegal has fairly abundant agricultural land, but much of it suÝers from severe wind erosion, loss of nutrients, salinization because of overirrigation and soil compaction caused by the intensiÞcation of agriculture. The country has an overall population density of 380 people per square kilometer and a population growth rate of 2.7 percent; in 25 years the population may double. In contrast, except for the Senegal River valley along its southern border and a few oases, Mauritania is for the most part arid desert and semiarid grassland. Its population density is very low, about 20 people per square kilometer, and the growth rate is 2.8 percent a year. The U.N. Food and Agriculture Organization has included both Mauritania and Senegal in its list of countries whose croplands cannot support current or projected populations without a large increase in agricultural inputs,
such as fertilizer and irrigation. Normally, the broad ßoodplains fring-
ing the Senegal River support productive farming, herding and Þshing based on the riverÕs annual ßoods. During the 1970s, however, the prospect of chronic food shortages and a serious drought encouraged the regionÕs governments to seek international Þnancing for the Manantali Dam on the BaÞng River tributary in Mali and for the Diama saltintrusion barrage near the mouth of the Senegal River between Senegal and Mauritania. The dams were designed to regulate the riverÕs ßow for hydropower, to expand irrigated agriculture and to raise water levels in the dry season, permitting year-round barge transport from the Atlantic Ocean to land-locked Mali, which lies to the east of Senegal and Mauritania.
|
|
AVAILABLE CROPLAND |
|
1989 |
2025 |
|
|||||||
|
|
|
|
|
|
|
|
|
|
|
|
|
|
|
|
|
|
|
|
|
|
|
|
|
|
|
|
AFRICA |
|
|
|
|
|
|
|
|
|
|
|
|
|
NORTH AND |
|
|
|
|
|
|
|
|
|
|
|
|
|
|
|
|
|
|
|
|
|
|
|
|
|
|
|
|
|
|
|
|
|
|
|
|
|
|
|
|
|
CENTRAL AMERICA |
|
|
|
|
|
|
|
|
|
|
|
|
|
|
|
|
|
|
|
|
|
|
|
|
|
|
|
SOUTH AMERICA |
|
|
|
|
|
|
|
|
|
|
|
|
|
|
|
|
|
|
|
|
|
|
|
|
|
|
|
|
|
|
|
|
|
|
|
|
|
|
|
|
|
ASIA |
|
|
|
|
|
|
|
|
|
|
|
|
|
|
|
|
|
|
|
|
|
|
|
|
|
|
|
|
|
|
|
|
|
|
|
|
|
|
|
|
|
EUROPE |
|
|
|
|
|
|
|
|
|
|
|
|
|
|
|
|
|
|
|
|
|
|
|
|
|
|
|
FORMER |
|
|
|
|
|
|
|
|
|
|
|
|
|
|
|
|
|
|
|
|
|
|
|
|
|
|
|
|
|
|
|
|
|
|
|
|
|
|
|
|
|
SOVIET UNION |
|
|
|
|
|
|
|
|
|
|
|
|
|
|
|
|
|
|
|
|
|
|
|
|
|
|
|
OCEANIA |
|
|
|
|
|
|
|
|
|
|
|
|
|
|
|
|
|
|
|
|
|
|
SOURCE: World Resources Institute |
|
|||
|
|
|
|
|
|
|
|
|
|
|
|||
0.0 |
|
|
0.5 |
|
1.0 |
1.5 |
2.0 |
||||||
CROPLAND PER PERSON (HECTARES)
AVAILABLE CROPLAND is expected to decline in many parts of the world by 2025 (top ) as a result of population growth and the degradation of fertile land. In the Philippines, lack of good land has pushed poor farmers onto steep hillsides (bottom). Unterraced farming on such terrain causes severe erosion, which can be seen in the earth-colored gashes on the slopes.
But the plan had unfortunate and unforeseen consequences. As anthropologist Michael M. Horowitz of the State University of New York at Binghamton has shown, anticipation of the new dams raised land values along the river in areas where high-intensity agriculture was to become feasible. The elite in Mauritania, which consists primarily of white Moors, then rewrote legislation governing land ownership, eÝectively abrogating the rights of black Africans to continue farming, herding and Þshing along the Mauritanian riverbank.
There has been a long history of racism by white Moors in Mauritania toward their non-Arab, black compatri-
ots. In the spring of 1989 the killing of Senegalese farmers by Mauritanians in the river basin triggered explosions of ethnic violence in the two countries. In Senegal almost all of the 17,000 shops owned by Moors were destroyed, and their owners were deported to Mauritania. In both countries several hundred people were killed, and the two nations nearly came to war. The Mauritanian regime used this occasion to activate the new land legislation, declaring the black Mauritanians who lived alongside the river to be ÒSenegalese,Ó thereby stripping them of their citizenship; their property was seized. Some 70,000 of the black Mauritanians were forcibly ex-
Copyright 1993 Scientific American, Inc. |
SCIENTIFIC AMERICAN February 1993 41 |
Some Sources and Consequences of Renewable Resource Scarcity |
||||
DECREASE IN |
|
|
|
|
QUALITY AND |
|
|
|
|
QUANTITY OF |
|
|
|
|
RENEWABLE |
|
|
|
|
RESOURCES |
|
|
|
|
|
|
MIGRATION OR |
|
ETHNIC CONFLICTS |
|
|
EXPULSION |
|
|
|
|
|
|
|
POPULATION |
INCREASED |
|
WEAKENED |
|
SCARCITY OF |
|
COUPS D'ETAT |
||
GROWTH |
RENEWABLE |
|
STATES |
|
|
|
|||
|
RESOURCES |
|
|
|
|
|
DECREASED |
|
DEPRIVATION |
|
|
ECONOMIC |
|
|
|
|
|
CONFLICTS |
|
|
|
PRODUCTIVITY |
|
|
|
|
|
|
|
UNEQUAL |
|
|
|
|
RESOURCE |
|
|
|
|
ACCESS |
|
|
|
|
pelled to Senegal, from where some launched raids to retrieve expropriated cattle. Diplomatic relations between the two countries have now been restored, but neither has agreed to allow the expelled population to return or to compensate them for their losses.
We see a somewhat diÝerent causal process in many parts of the world: unequal access
to resources combines with population growth to produce environmental damage. This phenomenon can contribute to economic deprivation that spurs insurgency and rebellion. In the Philippines, Spanish and American colonial policies left behind a grossly inequitable distribution of land. Since the 1960s, the introduction of green revolution technologies has permitted a dramatic increase in lowland production of grain for domestic consumption and of cash crops that has helped pay the countryÕs massive external debt.
This modernization has raised demand for agricultural labor. Unfortunately, though, the gain has been overwhelmed by a population growth rate of 2.5 to 3.0 percent. Combined with the maldistribution of good cropland and an economic crisis in the Þrst half of the 1980s, this growth produced a surge in agricultural unemployment.
With insuÛcient rural or urban industrialization to absorb excess labor, there has been unrelenting downward pressure on wages. Economically desperate, millions of poor agricultural laborers and landless peasants have migrated to shantytowns in already overburdened cities, such as Manila; millions of others have moved to the least productiveÑ and often most ecologically vulnerableÑterritories, such as steep hillsides.
In these uplands, settlers use Þre to clear forested or previously logged land. They bring with them little ability to protect the fragile ecosystem. Their small-scale logging, charcoal production and slash-and-burn farming often cause erosion, landslides and changes in hydrologic patterns. This behavior has initiated a cycle of falling food production, the clearing of new plots and further land degradation. Even marginally fertile land is becoming hard to Þnd in many places, and economic conditions are critical for peasants.
The country has suÝered from serious internal strife for many decades. But two researchers, Celso R. Roque, the former undersecretary of the environment of the Philippines, and his colleague Maria I. Garcia, conclude that resource scarcity appears to be an increasingly powerful force behind the current communist-led insurgency. The
42 SCIENTIFIC AMERICAN February 1993
upland struggleÑincluding guerrilla attacks and assaults on military stationsÑ is motivated by the economic deprivation of the landless agricultural laborers and poor farmers displaced into the hills, areas that are largely beyond the control of the central government. During the 1970s and 1980s, the New PeopleÕs Army and the National Democratic Front found upland peasants receptive to revolutionary ideology, especially where coercive landlords and local governments left them little choice but to rebel or starve. The revolutionaries have built on indigenous beliefs and social structures to help the peasants focus their discontent.
Causal processes similar to those in the Philippines can be seen in many other regions around the planet, including the Himalayas, the Sahel, Indonesia, Brazil and Costa Rica. Population growth and unequal access to good land force huge numbers of people into cities or onto marginal lands. In the latter case, they cause environmental damage and become chronically poor. Eventually these people may be the source of persistent upheaval, or they may migrate yet again, stimulating ethnic conßicts or urban unrest elsewhere.
The short but devastating ÒSoccer WarÓ in 1969 between El Salvador and Honduras involved just such a combin-
Copyright 1993 Scientific American, Inc.

AN EXAMPLE FROM THE PHILIPPINES
|
SOIL |
|
|
|
|
|
|
EROSION OF |
|
|
|
|
|
|
AS MUCH AS 300 |
|
|
|
|
|
|
TO 400 TONS PER |
|
|
|
|
|
|
HECTARE PER YEAR |
|
|
|
|
|
|
ON CLEARED |
|
|
|
|
|
|
STEEP SLOPES |
|
|
MIGRATION TO |
POTENTIAL FOR |
|
|
|
|
|
|
URBAN UNREST, |
|
|
|
|
|
|
URBAN AREAS |
FINANCIAL |
|
|
|
|
|
|
WEAKENING OF |
|
|
|
|
|
|
STATE |
|
NATURAL |
|
|
|
|
|
|
|
LOWER PER CAPITA |
|
|
||
MIGRATION TO |
POPULATION |
|
AVAILABILITY OF |
|
|
|
GROWTH OF ABOUT |
|
|
|
|||
|
PRODUCTIVE AGRI- |
|
|
|||
UPLANDS |
|
|
|
|
|
|
2 PERCENT PER |
|
|||||
|
CULTURAL LAND IN |
|
|
|||
|
YEAR IN |
|
|
|
||
|
UPLANDS |
|
UPLAND AREAS |
|
|
|
|
|
|
|
|
|
INCREASED |
|
|
|
|
|
FURTHER UPLAND |
PEASANT |
|
|
|
|
|
RECEPTIVITY TO |
|
|
|
|
|
|
IMPOVERISHMENT |
|
|
LIMITED |
|
|
RURAL |
||
|
|
|
|
|||
|
|
|
|
INSURGENCY |
||
|
ABSORPTION OF |
|
|
|
||
|
LABOR IN RICH |
|
|
|
|
|
|
LOWLANDS, |
|
|
|
|
|
|
POPULATION |
|
|
|
|
|
|
GROWTH IN |
|
|
|
|
|
|
LOWLANDS |
|
|
|
|
|
ation of factors. As William H. Durham of Stanford University has shown, changes in agriculture and land distribution beginning in the mid-19th century concentrated poor farmers in El SalvadorÕs uplands. Although these peasants developed some understanding of land conservation, their growing numbers on very steep hillsides caused deforestation and erosion. A natural population growth rate of 3.5 percent further reduced land availability, and as a result many people moved to neighboring Honduras. Their eventual expulsion from Honduras precipitated a war in which several thousand people were killed in a few days. Durham notes that the competition for land in El Salvador leading to this conßict was not addressed in the warÕs aftermath and that it powerfully contributed to the countryÕs subsequent, decade-long civil war.
In South Africa the white regimeÕs past apartheid policies concentrated millions of blacks in the countryÕs least productive and most ecologically sensitive territories. High natural birth rates exacerbated population densities. In 1980 rural areas of the Ciskei homeland supported 82 persons per square kilometer, whereas the surrounding Cape Province had a rural density of two. Homeland residents had, and have, little capital and few skills to manage re-
sources. They remain the victims of corrupt and abusive local governments.
Sustainable development in such a situation is impossible. Wide areas have been completely stripped of trees for fuelwood, grazed down to bare dirt and eroded of topsoil. A 1980 report concluded that nearly 50 percent of CiskeiÕs land was moderately or severely eroded; close to 40 percent of its pasture was overgrazed. This loss of resources, combined with the lack of alternative employment and the social trauma caused by apartheid, has created a subsistence crisis in the homelands. Thousands of people have migrated to South African cities. The result is the rapid growth of squatter settlements and illegal townships that are rife with discord and that threaten the countryÕs move toward democratic stability.
Dwindling natural resources can weaken the administrative capacity and authority of govern-
ment, which may create opportunities for violent challenges to the state by political and military opponents. By contributing to rural poverty and rural-ur- ban migration, scarcity of renewable resources expands the number of people needing assistance from the government. In response to growing city populations, states often introduce subsidies
that distort prices and cause misallocations of capital, hindering economic productivity.
Simultaneously, the loss of renewable resources can reduce the production of wealth, thereby constraining tax revenues. For some countries, this widening gap between demands on the state and its capabilities may aggravate popular grievances, erode the stateÕs legitimacy and escalate competition between elite factions as they struggle to protect their prerogatives.
Logging for export markets, as in Southeast Asia and West Africa, produces short-term economic gain for parts of the elite and may alleviate external debt. But it also jeopardizes long-term productivity. Forest removal decreases the landÕs ability to retain water during rainy periods. Flash ßoods then damage roads, bridges, irrigation systems and other valuable infrastructure. Erosion of hillsides silts up rivers, reducing their navigability and their capacity to generate hydroelectric power. Deforestation can also hinder crop production by altering regional hydrologic cycles and by plugging reservoirs and irrigation channels with silt [see ÒAccounting for Environmental Assets,Ó by Robert Repetto; SCIENTIFIC AMERICAN, June 1992].
In looking at China, V‡clav Smil of the University of Manitoba has estimated
Copyright 1993 Scientific American, Inc. |
SCIENTIFIC AMERICAN February 1993 |
43 |

ALGERIA
CYPRUS
EGYPT
ETHIOPIA
HAITI
IRAN
ISRAEL
JORDAN
KENYA
LEBANON
LIBYA
MOROCCO
NIGERIA
PERU
SAUDI ARABIA
SOMALIA
SOUTH AFRICA
TANZANIA
TUNISIA
AVAILABLE WATER |
|
1990 |
|
|
2025 |
|||||||||||||||||||||||
|
|
|
|
|
|
|
|
|
|
|
|
|
|
|
|
|
|
|
|
|
|
|
|
|
|
|
|
|
|
|
|
|
|
|
|
|
|
|
|
|
|
|
|
|
|
|
|
|
|
|
|
|
|
|
|
|
|
|
|
|
|
|
|
|
|
|
|
|
|
|
|
|
|
|
|
|
|
|
|
|
|
|
|
|
|
|
|
|
|
|
|
|
|
|
|
|
|
|
|
|
|
|
|
|
|
|
|
|
|
|
|
|
|
|
|
|
|
|
|
|
|
|
|
|
|
|
|
|
|
|
|
|
|
|
|
|
|
|
|
|
|
|
|
|
|
|
|
|
|
|
|
|
|
|
|
|
|
|
|
|
|
|
|
|
|
|
|
|
|
|
|
|
|
|
|
|
|
|
|
|
|
|
|
|
|
|
|
|
|
|
|
|
|
|
|
|
|
|
|
|
|
|
|
|
|
|
|
|
|
|
|
|
|
|
|
|
|
|
|
|
|
|
|
|
|
|
|
|
|
|
|
|
|
|
|
|
|
|
|
|
|
|
|
|
|
|
|
|
|
|
|
|
|
|
|
|
|
|
|
|
|
|
|
|
|
|
|
|
|
|
|
|
|
|
|
|
|
|
|
|
|
|
|
|
|
|
|
|
|
|
|
|
|
|
|
|
|
|
|
|
|
|
|
|
|
|
|
|
|
|
|
|
|
|
|
|
|
|
|
|
|
|
|
|
|
|
|
|
|
|
|
|
|
|
|
|
|
|
|
|
|
|
|
|
|
|
|
|
|
|
|
|
|
|
|
|
|
|
|
|
|
|
|
|
|
|
|
|
|
|
|
|
|
|
|
|
|
|
|
|
|
|
|
|
|
|
|
|
|
|
|
|
|
|
|
|
|
|
|
|
|
|
|
|
|
|
|
|
|
|
|
|
|
|
|
|
|
|
|
|
|
|
|
|
|
|
|
|
|
|
|
|
|
|
|
|
|
|
|
|
|
|
|
|
|
|
|
|
|
|
|
|
|
|
|
|
|
|
|
|
|
|
|
|
|
|
|
|
|
|
|
|
|
|
|
|
|
|
|
|
|
|
|
|
|
|
|
|
|
|
|
|
|
|
|
|
|
|
|
|
|
|
|
|
|
|
|
|
|
|
|
|
|
|
|
|
|
|
|
|
|
|
|
|
|
|
|
|
|
|
|
|
|
|
|
|
|
|
|
|
|
|
|
|
|
|
|
|
|
|
|
|
|
|
|
|
|
|
|
|
|
|
|
|
|
|
|
|
|
|
|
|
|
|
|
|
|
|
|
|
|
|
|
|
|
|
|
|
|
|
|
|
|
|
|
|
|
|
|
|
|
|
|
|
|
|
|
|
|
|
|
|
|
|
|
|
|
|
|
|
|
|
|
|
|
|
|
|
|
|
|
|
|
|
|
|
|
|
|
|
|
|
|
|
|
|
|
|
|
|
|
|
|
|
|
|
|
|
|
|
|
|
|
|
|
|
|
|
|
|
|
|
|
|
|
|
|
|
|
|
|
|
|
|
|
|
|
|
|
|
|
|
|
|
|
|
|
|
|
|
|
|
|
|
|
|
|
|
|
|
|
|
|
|
|
|
|
|
|
|
|
|
|
|
|
|
|
|
|
|
|
|
|
|
|
|
|
|
|
|
|
|
|
|
|
|
|
|
|
|
|
|
|
|
|
|
|
|
|
|
|
|
|
|
|
|
|
|
|
|
|
|
|
|
|
|
|
|
|
|
|
|
|
|
|
|
|
|
|
|
|
|
|
|
|
|
|
|
|
|
|
|
|
|
|
|
|
|
|
|
|
|
|
|
|
|
|
|
|
|
|
|
|
|
|
|
|
|
|
|
|
|
|
|
|
|
|
|
|
|
|
|
|
|
|
|
|
|
|
|
|
|
|
|
|
|
|
|
|
|
|
|
|
|
|
|
|
|
|
|
|
|
|
|
|
|
|
|
|
|
|
|
|
|
|
|
|
|
|
|
|
|
|
|
|
|
|
|
|
|
|
|
|
|
|
|
|
|
|
|
|
|
|
|
|
|
|
|
|
|
|
|
|
|
|
|
|
|
|
|
|
|
|
|
|
|
|
|
|
|
|
|
|
|
|
|
|
|
|
|
|
|
|
|
|
|
|
|
|
|
|
|
|
|
|
|
|
|
|
|
|
|
|
|
|
|
|
|
|
|
|
|
|
|
|
|
|
|
|
|
|
|
|
|
|
|
|
|
|
|
|
|
|
|
|
|
|
|
|
|
|
|
|
|
|
|
|
|
|
|
|
|
|
|
|
|
|
|
|
|
|
|
|
|
|
|
|
|
|
|
|
|
|
|
|
|
|
|
|
|
|
|
|
|
|
|
|
|
|
|
|
|
|
|
|
|
|
|
|
|
|
|
|
|
|
|
|
|
|
|
|
|
|
|
|
|
|
|
|
|
|
|
|
|
|
|
|
|
|
|
|
|
|
|
|
|
|
|
|
|
|
|
|
|
|
|
|
|
|
|
|
|
|
|
|
|
|
|
|
|
|
|
|
|
|
|
|
|
|
|
|
|
|
|
|
|
|
|
|
|
|
|
|
|
|
|
|
|
|
|
|
|
|
|
|
|
|
|
|
|
|
|
|
|
|
|
|
|
|
|
|
|
|
|
|
|
|
|
|
|
|
|
|
|
|
|
|
|
|
|
|
|
|
|
|
|
|
|
|
|
|
|
|
|
|
|
|
|
|
|
|
|
|
|
|
|
|
|
|
|
|
|
|
|
|
|
|
|
|
|
|
|
|
|
|
|
|
|
|
|
|
|
|
|
|
|
|
|
|
|
|
|
|
|
|
|
|
|
|
|
|
|
|
|
|
|
|
|
|
|
|
|
|
|
|
|
|
|
|
|
|
|
|
|
|
|
|
|
|
|
|
|
|
|
|
|
|
|
|
|
|
|
|
|
|
|
|
|
|
|
|
|
|
|
|
|
|
|
|
|
|
|
|
|
|
|
|
|
|
|
|
|
|
|
|
|
|
|
|
|
|
|
|
|
|
|
|
|
|
|
|
|
|
|
|
|
|
|
|
|
|
|
|
|
|
|
|
|
|
|
|
|
|
|
|
|
|
|
|
|
|
|
|
|
|
|
|
|
|
|
|
|
|
|
|
|
|
|
|
|
|
|
|
|
|
|
|
|
|
|
|
|
|
|
|
|
|
|
|
|
|
|
|
|
|
|
|
|
|
|
|
|
|
|
|
|
|
|
|
|
|
|
|
|
|
|
|
|
|
|
|
|
|
|
|
|
|
|
|
|
|
|
|
|
|
|
|
|
|
|
|
|
|
|
|
|
|
|
|
|
|
|
|
|
|
|
|
|
|
|
|
|
|
|
|
|
|
|
|
|
|
|
|
|
|
|
|
|
|
|
|
|
|
|
|
|
|
|
|
|
|
|
|
|
|
|
|
|
|
|
|
|
|
|
|
|
|
|
|
|
|
|
|
|
|
|
|
|
|
|
|
|
|
|
|
|
|
|
|
|
|
|
|
|
|
|
|
|
|
|
|
|
|
|
|
|
|
|
|
|
|
|
|
|
|
|
|
|
|
|
|
|
|
|
|
|
|
|
|
|
|
|
|
|
|
|
|
|
|
|
|
|
|
SOURCE: Peter Gleick, Pacific Institute, Oakland, Calif.
0 |
500 |
1,000 |
1,500 |
2,000 |
2,500 |
3,000 |
WATER PER PERSON PER YEAR (CUBIC METERS)
WATER SHORTAGES may be severe in the future. In 2025 several nations (top) will have less than 1,000 cubic meters of water per personÑthe minimum amount considered necessary for an industrialized nation. In Ethiopia, water is already so scarce that some women walk miles to Þnd it and lug it home (bottom).
the combined eÝect of environmental problems on productivity. The main economic burdens he identiÞes are reduced crop yields caused by water, soil and air pollution; higher human morbidity resulting from air pollution; farmland loss because of construction and erosion; nutrient loss and ßooding caused by erosion and deforestation; and timber loss arising from poor harvesting practices. Smil calculates the current annual cost to be at least 15 percent of ChinaÕs gross domestic product; he is convinced the toll will rise steeply in the coming decades. Smil also estimates that tens of millions of Chinese will try to leave the countryÕs impoverished interior and northern regionsÑ where water and fuelwood are desperately scarce and the land often badly damagedÑfor the booming coastal cities. He anticipates bitter disputes among these regions over water sharing and migration. Taken together, these economic and political stresses may greatly weaken the Chinese state.
Water shortages in the Middle East will become worse in the future and may also contribute to political discord. Although Þgures vary, Miriam R. Lowi of Princeton University estimates that the average amount of renewable fresh water available annually to Israel is about 1,950 million cubic meters (mcm). Sixty percent comes from groundwater, the rest from river ßow, ßoodwater and wastewater recycling. Current Israeli demandÑincluding that of settlements in the occupied territories and the Golan HeightsÑis about 2,200 mcm. The annual deÞcit of about 200 mcm is met by overpumping aquifers.
As a result, the water table in some parts of Israel and the West Bank has been dropping signiÞcantly. This depletion can cause the salinization of wells and the inÞltration of seawater from the Mediterranean. At the same time, IsraelÕs population is expected to increase from the present 4.6 million to 6.5 million people in the year 2020, an estimate that does not include immigration from the former Soviet Union. Based on this projected expansion, the countryÕs water demand could exceed 2,600 mcm by 2020.
Two of the three main aquifers on which Israel depends lie for the most part under the West Bank, although their waters drain into Israel. Thus, nearly 40 percent of the groundwater Israel uses originates in occupied territory. To protect this important source, the Israeli government has strictly limited water use on the West Bank. Of the 650 mcm of all forms of water annually available there, Arabs are allowed to use only 125 mcm. Israel restricts the num-
44 |
SCIENTIFIC AMERICAN February 1993 |
Copyright 1993 Scientific American, Inc. |

OF POPULATION |
IN CITIES |
PERCENTAGE |
LIVING |
URBANIZATION IN LESS DEVELOPED REGIONS
100
75
LATIN AMERICA
50
AFRICA
ASIA
25
0 |
|
|
|
SOURCE: World Resources Institute |
||||
1965 |
1975 |
1985 |
1995 |
2005 |
2015 |
2025 |
||
1955 |
||||||||
YEAR
GROWTH OF CITIES, in part a result of increasing rural pover- |
home to poor peasants arriving by ship from the provinces |
ty and of migration, will be dramatic in the developing world |
(right ). The Filipinos named the settlement after the perpetu- |
(left ). In Manila the ÒSmoky MountainsÓ squatter settlement is |
ally smoldering garbage dump on which it is constructed. |
ber of wells Arabs can drill in the territory, the amount of water Arabs are allowed to pump and the times at which they can draw irrigation water.
The diÝerential in water access on the West Bank is marked: on a per capita basis, Jewish settlers consume about four times as much water as Arabs. Arabs are not permitted to drill new wells for agricultural purposes, although Mekorot (the Israeli water company) has drilled more than 30 for settlers. Arab agriculture in the region has suÝered because some Arab wells have become saline as a result of deeper Israeli wells drilled nearby. The Israeli water policy, combined with the conÞscation of agricultural land for settlers as well as other Israeli restrictions on Palestinian agriculture, has encouraged many West Bank Arabs to abandon farming. Those who have done so have become either unemployed or day laborers within Israel.
The entire Middle East faces increasingly grave and tangled problems of water scarcity, and many experts believe these will aÝect the regionÕs stability. Concerns over water access contributed to tensions preceding the 1967 Arab-Israeli War; the war gave Israel control over most of the Jordan BasinÕs water resources. The current Middle East peace talks include multilateral meetings on water rights, motivated by concerns about impending scarcities.
Although Òwater warsÓ are possible in the future, they seem unlikely given the preponderance of Israeli military power. More probably, in the context of historical ethnic and political disputes, water shortages will aggravate tensions and unrest within societies in the Jor-
Copyright 1993 Scientific American, Inc.
dan River basin. In recent U.S. congressional testimony, Thomas NaÝ of the University of Pennsylvania noted that Òrather than warfare among riparians in the immediate future...what is more likely to ensue from water-related crises in this decade is internal civil disorder, changes in regimes, political radicalization and instability.Ó
Scarcities of renewable resources clearly can contribute to conßict, and the frequency of such unrest
will probably grow in the future. Yet some analysts maintain that scarcities are not important in and of themselves. What is important, they contend, is whether people are harmed by them. Human suÝering might be avoided if political and economic systems provide the incentives and wherewithal that enable people to alleviate the harmful effects of environmental problems.
Our research has not produced Þrm evidence for or against this argument. We need to know more about the variables that aÝect the supply of human ingenuity in response to environmental change. Technical ingenuity is needed for the development of, for example, new agricultural and forestry technologies that compensate for environmental deterioration. Social ingenuity is needed for the creation of institutions that buÝer people from the eÝects of degradation and provide the right incentives for technological innovation.
The role of social ingenuity as a precursor to technical ingenuity is often overlooked. An intricate and stable system of markets, legal regimes, Þ- nancial agencies and educational and research institutions is a prerequisite for the development and distribution
of many technologiesÑincluding new grains adapted to dry climates and eroded soils, alternative cooking technologies that compensate for the loss of Þrewood and water-conservation technologies. Not only are poor countries ill endowed with these social resources, but their ability to create and maintain them will be weakened by the very environmental woes such nations hope to address.
The evidence we have presented here suggests there are signiÞcant causal links between scarcities of renewable resources and violence. To prevent such turmoil, nations should put greater emphasis on reducing such scarcities. This means that rich and poor countries alike must cooperate to restrain population growth, to implement a more equitable distribution of wealth within and among their societies, and to provide for sustainable development.
FURTHER READING
SCARCITY AND SURVIVAL IN CENTRAL
AMERICA: ECOLOGICAL ORIGINS OF THE
SOCCER WAR. William H. Durham. Stanford University Press, 1979.
ON THE POLITICAL CONSEQUENCES OF
SCARCITY AND ECONOMIC DECLINE. Ted Gurr in The International Studies Quarterly, Vol. 29, No. 1, pages 51Ð75; March 1985.
ENVIRONMENT AND THE POOR: DEVELOP-
MENT STRATEGIES FOR A COMMON AGEN-
DA. Edited by JeÝrey H. Leonard. Transaction Publishers, 1989.
ON THE THRESHOLD: ENVIRONMENTAL
CHANGES AS CAUSES OF ACUTE CON-
FLICT. Thomas F. Homer-Dixon in International Security, Vol. 16, No. 2, pages 76Ð116; Fall 1991.
SCIENTIFIC AMERICAN February 1993 45

Resistance in High-
Temperature Superconductors
Researchers are beginning to see how
the motion of magnetic vortices in these materials can interfere with the ßow of current
by David J. Bishop, Peter L. Gammel and David A. Huse
Levitating trains and high-capacity devices for storing electrical energy were among the many bold vi-
sions some physicists entertained after the discovery of high-temperature superconductors in 1986. But several difÞculties quickly emerged to temper the promise extended by the ability of these ceramic materials to conduct electricity at high temperatures without resistance. One of the most vexing hindrances has been the destruction of the superconducting state when the material is placed in a magnetic ÞeldÑa condition crucial for, or at least inescapable in, many envisaged applications. Resistance to current ßow can happen when the external magnetic Þeld penetrates the superconductor in the form
DAVID J. BISHOP, PETER L. GAMMEL and DAVID A. HUSE are members of the technical staÝ at AT&T Bell Laboratories in Murray Hill, N.J. Their overlapping tastes in physics were developed under the tutelage of John D. Reppy and Michael E. Fisher at Cornell University, where all three received their doctorates. Bishop, who holds a B.S. from Syracuse University, is a department head at AT&T. His current research interests include the statics and dynamics of magnetic vortices in exotic superconductors, and his outside pursuits include sailing and collecting antiquarian books. Gammel, who earned two bachelor degrees from the Massachusetts Institute of Technology, has investigated single-charge transport in small tunnel junctions. He also works on his violin playing and vegetable gardening. Huse has been primarily interested in the theory of phase transitions in various materials, including spin glasses. He received his B.S. from the University of Massachusetts at Amherst. They write that Ònone of us races sports cars or ßies jet-Þghter planes on weekends. For us, a thrill is a good referee report.Ó
of discrete bundles called ßux lines. Because a line of ßux consists of whirlpools of electric current, it is often called a vortex. If these vortices move, they can impede the ßow of electrons. Knowing how these vortices move and arrange themselves under various temperature and magnetic-Þeld conditions will be critical in controlling the phenomenon and in maintaining the supercurrent ßow.
Fortunately, recent studies have greatly enhanced our knowledge of vortices. Investigators have found that the mag- netic-Þeld behavior of superconductors is much richer than formerly thought. Indeed, the vortices have been found to be capable of forming a number of exotic new phases of matter within the family of high-temperature superconductors. To describe these phasesÑvortex solids, liquids and glassesÑworkers have been forced to discard some previously held views in superconductivity and to form fresh hypotheses based on modern concepts in condensed-matter physics. To test the new ideas, investigators have devised experimental techniques of unprecedented sensitivity. The work may ultimately point the way to full understanding and, perhaps, to eÝective use of these new materials.
In retrospect, one should not be surprised that the knowledge of the superconducting state gathered before 1986 was inadequate to describe hightemperature superconductivity. The early ideas evolved from observations of conventional superconductors. Such materials, generally familiar metals and alloys, conduct electricity without resistance only when cooled to temperatures within a few degrees of absolute zero. In fact, curiosity about the behavior of matter at low temperatures had led the Dutch physicist Heike Kamerlingh Onnes to discover superconduc-
tivity in 1911. The Þnding came about because Onnes had accomplished the experimentally daunting task of liquefying helium, the last of the inert gases to be condensed. Liquid helium enabled Onnes to cool down materials to temperatures near one kelvin of absolute zero. (Absolute zero is equal to Ð458 degrees Fahrenheit or Ð273 degrees Celsius.)
According to a perhaps apocryphal story, the Þnding emerged when Onnes asked a student to measure the electrical resistance of mercury. The student reported that the resistance disappeared when the temperature of the sample fell to 4.2 kelvins. Onnes sent him back to the laboratory to Þnd what Onnes thought was an ÒerrorÓ producing an experimental artifact. After several tries, the error could not be found, and the workers realized they had made a historic discovery. Onnes went on to win the 1913 Nobel Prize in Physics for this and many other important discoveries in low-temperature physics.
Zero resistance to current ßow was not the only reason for amazement. The behavior of superconductors in a magnetic Þeld proved equally astounding. In 1933 two German physicists, Walther Meissner and Robert Ochsenfeld, found that a superconductor can
VORTICES, represented here as green- and-red volcanolike tubes, are discrete bundles of magnetic-Þeld lines that pierce a superconductor. The computer image represents the strength of the magnetic Þeld (plotted as the height of the tubes) across the surface of the sample. The Þeld is largest at the center of each vortex. The projection below the image depicts the vortices as white dots and shows that they form a regular, triangular pattern within the body of the superconductor.
48 |
SCIENTIFIC AMERICAN February 1993 |
Copyright 1993 Scientific American, Inc. |

expel magnetic Þelds when cooled below its superconducting transition temperature. The complete expulsion of a magnetic Þeld is now known as the Meissner eÝect. Along with the absence of resistance, the ability to exclude magnetic Þelds propels the enormous research interest in superconductivity.
At this juncture, observation had far outrun theory. The quantum mod-
els developed in the 1930s could account for the conductivity in normal metals, but they could not explain the superconducting state. The problem proved particularly intractable; workers did not achieve signiÞcant theoretical understanding of the microscopic origins of superconductivity until the 1950s. Then, two Russians, Vitaly L. Ginzburg and Lev D. Landau, devel-
oped a phenomenological theory. By looking at what happens during the transition from the normal state to the superconducting one, the scientists were able to formulate a series of equations that could describe the phenomenon. They could not, however, explain why it occurred.
In 1957 John Bardeen, Leon N. Cooper and J. Robert SchrieÝer developed
Copyright 1993 Scientific American, Inc. |
SCIENTIFIC AMERICAN February 1993 |
49 |

the theory that provided the microscopic explanation for superconductivity. According to the so-called BCS theory, the conduction electrons travel without meeting resistance because they move in pairs, known as Cooper pairs. Electrons form Cooper pairs because they interact with phonons, mechanical vibrations in the crystalline lattice of the metal that resemble sound waves. The movement of the atoms in the lattice tends to neutralize the repulsion that electrons normally have for one another. In fact, it actually produces a small attractive force between electrons. The eÝectiveness of this interaction depends sharply on temperature. Indeed, the point on a thermal scale at which superconductivity appears is called the transition temperature. At temperatures above this critical point, thermal ßuctuations destroy the Cooper pairs and, consequently, the superconductivity of the metal.
The pairing interaction determines two important microscopic distance scales in a superconductor. The Þrst of these is the spatial separation of the electrons in a Cooper pair. This distance is referred to as the coherence length. It is the smallest length in a superconductor over which electronic properties, such as the local resistiv-
ity, can change. In typical superconductors the coherence length ranges from hundreds to thousands of angstroms. (These scales of distance are related to atomic reality and so can can be diÛcult to grasp intuitivelyÑone angstrom equals 10Ð10 meter. The atoms in most materials are spaced one to three angstroms apart.)
The second microscopic characteristic length is related to the strength of the Meissner eÝectÑthat is, the ability of a superconductor to expel an applied magnetic Þeld. The eÝect occurs when a small magnetic Þeld is applied to a superconductor, creating currents that ßow near the surface of the material. These induced currents create a magnetic Þeld that precisely cancels the applied Þeld in the rest of the material. The magnitude of these induced currents falls oÝ exponentially with increasing distance from the surface of the superconductor. The length over which this decay occurs is called the magnetic penetration depth. This depth is the shortest distance over which the magnetic Þeld can change in a superconductor. In typical superconductors, this length can vary from hundreds up to tens of thousands of angstroms.
These microscopic lengths deÞne two broadly diÝerent categories of super-
|
CURRENT |
MAGNETIC VORTICES |
|
CURRENT |
TYPE II SUPERCONDUCTOR |
|
CURRENT FLOW through a superconductor (blue rectangular box ) can be disrupted by vortices (cylinders ). Each vortex consists of a ring of circulating current induced by an external magnetic Þeld (not shown). The applied current adds to the circulating current on one side of the vortex but subtracts from the other. The net result is a force that pushes the vortices at right angles to the current ßow; the movement dissipates energy and produces resistance.
conductors. In type I superconductors the coherence length is longer than the penetration depth. These materials tend to be low-temperature, low-Þeld superconductors. If the Þeld reaches a critical strength (which varies from substance to substance), it enters the material, destroying the superconducting state. Because their lack of resistance disappears at relatively low Þelds, type I superconductors have little potential for applications or interesting technologies.
Type II superconductors are much more useful. The penetration depth of such superconductors is longer than the coherence length. As a result, they remain superconducting even after the magnetic Þeld enters. Type II superconductors can withstand high ÞeldsÑ up to what is called the upper critical ÞeldÑand thus can carry the largest currents. All the technologically interesting superconductors, including the known high-temperature materials, are of this type.
In the 1950s the Russian physicist Alexei A. Abrikosov published the basic theory of how a conventional type II superconductor behaves in a
magnetic Þeld. Building on the work of Ginzburg and Landau, he showed that the magnetic response of a type II superconductor below the critical temperature depends on the strength of the applied Þeld and on the temperature. Such a relation can be represented by a magnetic phase diagram [see illustration on page 52], which shows that a conventional superconductor has three distinct magnetic states.
The Þrst one is simply the Meissner stateÑthat is, the state in which the material fully expels the applied Þeld. The superconductor exists in this state as long as the applied magnetic Þeld remains below a certain strength. This Þeld, called the lower critical Þeld, in general depends on temperature.
The second state emerges if the applied Þeld increases to a value higher than the lower critical Þeld. At this point, the magnetic Þeld can still penetrate the superconductor but not completely or uniformly. Instead discrete ßux lines, forming tubular intrusions of the applied Þeld, pierce the sample. The quantum mechanics of the superconductor requires that each ßux line have exactly the same magnitude. This unit of ßux is known as the ßux quantum. Because each ßux line must have the same strength, any change in the applied magnetic Þeld must change the density of the ßux lines. In other words, as the Þeld varies, the distance between the lines changes in response. The mini-
50 |
SCIENTIFIC AMERICAN February 1993 |
Copyright 1993 Scientific American, Inc. |

Visualizing the Superconducting Flux Lattice
As children, we all “decorated” the magnetic-field lines of a permanent magnet by using a piece of paper and iron filings. Some of us are still doing it. Specifically,
we can decorate the magnetic field that can permeate a superconductor. A small magnetic field enters the superconductor in discrete bundles called flux or vortex lines. The lines arrange themselves in a regular pattern. Several techniques, including neutron scattering and scanning tunneling microscopy, can reveal the pattern, but magnetic decoration is perhaps the simplest and most direct.
The decoration apparatus |
a |
|
(a), about 10 centimeters |
||
high and three centimeters |
VACUUM |
|
in diameter, consists of only |
LINE |
|
a few key components. The |
|
|
superconductor to be stud- |
|
|
ied rests inside a vacuum |
|
|
can filled with helium gas. |
|
|
We apply a magnetic field |
SAMPLE |
|
with the coils and cool the |
|
|
sample to below its transi- |
|
|
tion temperature. We then |
IRON |
|
heat up the tungsten fila- |
||
ment, which has a blob of |
“SMOKE” |
|
|
||
iron attached to it. The iron |
|
|
particles evaporate. The he- |
VACUUM |
|
lium gas in the can cools |
CAN |
|
the iron particles, producing |
|
|
a slowly drifting magnetic |
IRON |
|
“smoke.” The iron particles |
||
in the smoke are quite small, |
b |
|
about 100 angstroms in di- |
|
|
ameter. They drift around the |
|
|
baffle, which protects the |
|
|
sample from the heat, to the |
|
|
surface of the superconduc- |
|
|
tor. There they decorate the |
|
|
regions where the magnet- |
|
|
ic-flux lines pass through |
|
|
the surface. The iron parti- |
|
|
cles “stick” to the surface be- |
|
|
cause of the slight attractive |
|
|
forces that exist between |
|
|
all particles. This attraction, |
|
|
called the van der Waals |
|
|
force, acts as an “atomic |
c |
|
glue.” The sample can warm |
||
|
||
up to room temperature and |
|
|
still retain the iron particles. |
|
|
We can then use an electron |
|
|
microscope to form a direct |
|
|
picture of the iron particles, |
|
|
which replicates the original |
|
|
flux lattice pattern. |
|
|
The flux lines appear as |
|
|
dots, revealing the well-or- |
|
|
dered nature of the lattice (a |
|
|
photograph of the vortex |
|
|
lattice is on page 53). From |
|
|
such pictures, investigators |
|
|
can determine the amount of |
|
|
magnetic flux per flux line. |
|
|
This amount is a fundamen- |
|
|
tal constant for supercon- |
|
ductors known as the flux quantum, F0. For all known superconductors, F0 = hc/2e, where h is Planck’s constant, c is the speed of light and e is the charge on the electron. The “2” in the denominator is a direct consequence of the fact that the electrons in superconductors travel in pairs. In the early days of high-temperature superconductivity, some researchers thought the flux quantum might have a different value for these materials. Experiments such as these, which simply count the number of flux lines, quickly ruled out that possibility. By counting, one can show that
the ratio of the applied magnetic field to the density of flux lines is equal to the flux quantum.
Decoration experiments
have enabled us to see
many other novel struc-
tures. The pattern of the
flux lines will be different if
the applied magnetic field
strikes the sample at an an-
gle with respect to a ma-
jor crystallographic axis.
Instead of a regular lattice,
flux chains appear (b).
Several kinds of quanti-
tative analysis are possi-
ble with such images. Af-
ter the locations of the flux lines are digitized, a computer can draw in lines between all of the points in the flux lattice (c). In a perfect triangular lattice, each flux line has six nearest neighbors. The defects in the lattice appear as flux lines with different numbers of nearest neighbors. The defects have been shaded red.
Such decorations show that the superconducting flux lattice can take on a specific type of pattern called hexatic order. In such ordered structures the positions of the particles can be random, but the bond angles between nearest neighbors are similar. For the triangulation pattern shown, the bond angles are roughly the same from one end of the picture to the other. But because of the defects, the particles are spaced evenly only over short distances. The easiest way to see this bond-angle order is to place the edge of the page near your eye and to sight along the rows.
Copyright 1993 Scientific American, Inc. |
SCIENTIFIC AMERICAN February 1993 51 |

MAGNETIC FIELD
a
UPPER CRITICAL FIELD
NORMAL STATE
VORTEX LINE
 MAGNETIC-FIELD
LINES
MIXED STATE
LOWER CRITICAL FIELD
MEISSNER
STATE
TEMPERATURE
MAGNETIC FIELD
b |
UPPER |
|
CRITICAL |
|
FIELD |
|
NORMAL |
|
STATE |
VORTEX SOLID |
VORTEX LIQUID |
MEISSNER |
LOWER |
STATE |
CRITICAL |
|
FIELD |
|
TEMPERATURE |
MAGNETIC PHASE DIAGRAMS show what happens when a type II superconductor is immersed in a magnetic Þeld. Diagram a depicts the three phases present in a conventional superconductor. In the Meissner state (lower left ) the applied Þeld is expelled. In the mixed (or vortex solid) state the Þeld penetrates in discrete bundles, or vortex lines. In the normal
state the field destroys superconductivity and penetrates the material uniformly. Diagram b shows that high-temperature superconductors have similar phases, except for a vortex liquid regime. This state exists because thermal ßuctuations melt the vortex solid, which is either a lattice (for clean superconductors) or a glass (for dirty ones).
mum energy conÞguration for such an array of ßux lines (as seen from a birdÕseye view above the surface) is a triangular lattice.
The structure of an individual ßux line depends on the coherence length and penetration depth. Each line has a small core. The diameter of the core depends on the coherence length. Inside the core, the material is a normal metal. Circulating around the core are supercurrents. (This circulating current is the reason physicists call the core a vortex line.) These supercurrents produce a magnetic Þeld, and the distance over which this magnetic Þeld persists is the magnetic penetration depth. Researchers can make the vortices visible by using small magnetic particles [see box on preceding page]. In such images the very well ordered triangular lattice becomes apparent.
The third and Þnal magnetic state of a superconductor emerges if the applied Þeld reaches a second, higher critical point. Above this upper critical Þeld, the superconductivity is completely destroyed, restoring the material to its normal state. The destruction occurs because increases in the strength of the magnetic Þeld force the vortex lines closer together. When the vortex cores, which behave as normal metals, overlap too much, there is no longer enough
room between the vortices to maintain superconductivity.
The descriptions of the three magnetic states seemed to detail sufÞciently well the eÝects of an applied magnetic Þeld on superconductors. Then, in 1986, J. Georg Bednorz and K. Alex MŸller of the IBM ZŸrich Research Center came across a new class of type II superconductor. These materials, a family of copper oxide ceramics, were found in some cases to superconduct at a temperature that exceeded 120 kelvins. In contrast, the highest critical temperatures for conventional superconductors lie in the range of 20 to 25 kelvins. The high-tem- perature superconductors galvanized the scientiÞc world because the materials could easily be cooled with liquid nitrogen, which in bulk costs less than 10 cents per liter (compared to $5 a liter for liquid helium). Even small labo- ratory-grade refrigerators can cool below the transition temperature of the
new superconductors.
As exciting as the high critical temperatures were, a disturbing fact came to light when their properties were studied as a function of an applied magnetic Þeld. SpeciÞcally, the high-tempera- ture superconductors did not conform to AbrikosovÕs successful model. The
52 SCIENTIFIC AMERICAN February 1993
discrepancies were discovered when investigators studied the materials in magnetic Þelds that would be necessary in technological use. The strengths of the Þelds range up to about 10 teslas (a tesla is roughly 20,000 times the strength of the earthÕs magnetic Þeld). In these Þelds the resistance of some of these materials did not fall below that of ordinary copper wire until the temperature dropped to only 20 to 30 percent of the superconducting transition temperature. In certain cases, the resistance of some materials in a Þeld remained 100 times higher than that of copper. The advantages of a high-tem- perature superconductor seemed lost. Additional experiments uncovered the reason. The vortex lines were behaving in an unusual way: they were not always arranging themselves in a rigid, triangular lattice. Instead researchers found that the vortex lattice could ÒmeltÓ into a liquidlike state. This behavior was suppressing the materialÕs transition to superconductivity.
There are a variety of reasons why this novel state of matter, a vortex liquid, should hinder current ßow in the high-temperature superconductors. Perhaps the most convenient way to understand the eÝect is to imagine vortex lines in a superconductor as rubber bands. Vortex lines and rubber bands
Copyright 1993 Scientific American, Inc.

tend to stay short, because making a line longer or stretching a rubber band costs energy. Thermal ßuctuations, however, oppose that tendency. Such ßuctuations make the atoms in a solid and the vortex lines vibrate with a larger amplitude as the temperature rises. The vortex lines then Òstretch.Ó The energy in a vortex line tries to restore the line to its unstretched state.
This restoring force is a function of the coherence length and penetration depth. Long coherence lengths or short penetration depths produce a good deal of restoring force and limit the thermal vibrations of the vortex lines. Most ordinary type II superconductors have such characteristics. The restoring force dominates, keeping the lines straight and short. Thus, thermal ßuctuations of the vortex lines are small.
On the other hand, high-temper- ature superconductors have virtually the opposite characteris-
tics: the coherence lengths are short and the penetration depths long. The coherence length is sometimes as short as a few angstroms, which is about 10 to 100 times below that of conventional superconductors. The penetration depth of high-temperature superconductors ranges from 1,000 to more than 100,- 000 angstroms; the values exceed that of many conventional superconductors by a factor of 10 to 100.
Coupled with the high transition temperatures, the extreme values of the coherence lengths and penetration depths mean that large thermal ßuctuations of the vortex lines occur in the high-tem- perature superconductors. Indeed, at suÛciently high temperatures the lines vibrate enough to ÒmeltÓ the vortex lattice. The phenomenon is similar to the way that the thermal vibrations of water molecules can cause ice to melt into water. For some high-temperature materials, the vortex liquid state persists over a temperature range wider than that of the lattice state.
Why does a vortex liquid aÝect the resistance of the superconductor? The answer lies in thinking about what happens when a current is sent through a type II superconductor in an applied magnetic Þeld. Recall that each vortex line consists of ßowing currents circulating around a normal (nonsuperconducting) core. When an applied current ßows through the sample, it adds to the circulating current on one side of the vortex and subtracts from it on the other side. As a result, a force acts on the vortex line. The force tends to make the vortex move in a direction at right angles to both the vortex line and the applied current. This force is the Mag-
Copyright 1993 Scientific American, Inc.
nus force. It is similar to the lift generated by an airplane wing, a situation in which air ßows faster over the upper surface of the wing than it does over the lower surface. If vortex lines move in response to the Magnus force, they will dissipate the energy in the ßowing current. SpeciÞcally, the dissipation induces a voltage and thus resistance in a sample.
Measurement of this resistance shows how the vortex liquid behaves like ordinary water near the melting point. We have explored the resistance of a very clean piece of the high-tempera- ture superconductor YBa2Cu3O7 (yt- trium-barium2-copper3-oxygen7, which is often shortened to YBCO, pronounced ÒibcoÓ) as a function of temperature in a Þxed magnetic Þeld. At high temperatures (that is, in the vortex liquid phase), the resistance indicated by the data is high. Lowering the temperature froze the vortex liquid into the vortex lattice state. Hence, the lines were no
longer free to move, and the resistance disappeared.
Such resistance measurements also showed that the vortex liquid is slightly supercooled before it freezes. The phenomenon resembles what one Þnds in clean water, where the liquid phase can to some extent persist below the freezing point. Supercooling can be expressed more technically: the behavior of the substance on heating does not precisely retrace that found on cooling [see illustration on page 55]. These processes are said to be hysteretic.
Yet insight into how the vortex liquid state behaves and freezes into a lattice leaves open a ques-
tion essential for applications. The vortex liquid freezes into a regular lattice only if the material is clean. But what happens when the superconductor is ÒdirtyÓÑthat is, if chemical impurities and defects reside in the atomic lattice?
The question is not trivial. Supercon-
States of a Vortex Solid
Asuperconductor in a magnetic field “freezes” solid in two ways. If the material is clean, the vortex lines will fall into a regular triangular array, forming a vortex lattice. If the substance has many defects or impurities,
the lines will develop a disordered pattern, forming a vortex glass.
VORTEX LATTICE
VORTEX GLASS
SCIENTIFIC AMERICAN February 1993 |
53 |
The SQUID Picovoltmeter
The device probes the different vortex states. The diagram (top left) shows the essential features of the pico-
voltmeter. The conventional superconducting and fieldcompensation coils apply to the sample a field of up to seven teslas. The isothermal can keeps the temperature of the sample to within a few millikelvins. Low-resistance wires running through a glass tube connect the sample to the SQUID, which measures minute electrical changes. In the photograph (right) the magnetic coils and the vacuum and
isothermal cans have been removed for clarity. Measurements conducted with the device have confirmed the vortex glass model. One experiment, the results of which are displayed (bottom left), looked at the current (blue) and resistance (purple) in a region where the electrical properties of the sample are nonlinear. The data lie in a straight line, as predicted by theory. The reduced temperature is the difference between the temperature of the sample and that where the superconducting vortex glass phase first occurs.
|
|
|
|
SQUID |
|
|
|
|
|
|
SUPPORT ROD |
|
|
|
|
|
|
SQUID CONNECTOR |
|
|
|
|
|
|
FIELD-COMPENSATION COILS |
||
|
|
|
|
TEMPERATURE-STABLE |
|
|
|
|
|
|
PLATFORM |
|
|
|
|
|
|
VACUUM CAN |
|
|
|
|
|
|
LOW-RESISTANCE WIRES IN |
||
|
|
|
|
GLASS TUBE |
|
|
|
|
|
|
CONVENTIONAL |
|
|
|
|
|
|
SUPERCONDUCTING COILS |
|
|
|
|
|
|
ISOTHERMAL CAN |
|
|
|
|
|
|
(BOTTOM COVER REMOVED) |
||
OFONSETATCURRENTNONLINEAR |
(MILLIAMPERES)RESISTANCE |
|
|
SAMPLE |
|
NORMALTORESISTANCELINEARSTATE RESISTANCE |
0.25 |
|
|
10–5 |
|||
|
|
8 |
|
|
1 |
|
|
|
4 |
|
|
10–1 |
|
|
|
2 |
|
|
10–2 |
|
|
|
1 |
|
|
10–3 |
|
|
|
0.5 |
|
|
10–4 |
|
|
0.125 |
1 |
2 |
10–6 |
RATIO OF |
|
|
|
0.5 |
4 |
|
||
|
|
|
REDUCED TEMPERATURE (KELVINS) |
|
|
|
54 SCIENTIFIC AMERICAN February 1993 |
Copyright 1993 Scientific American, Inc. |
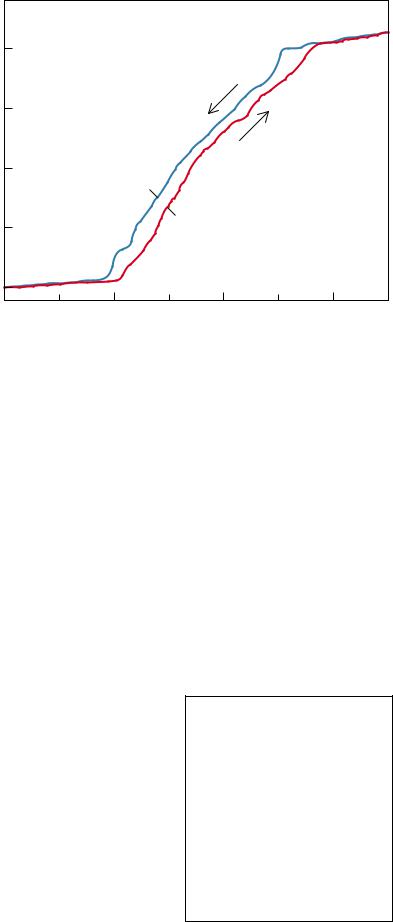
ductors envisioned for technological use must inevitably be dirty. In fact, researchers working with conventional superconductors carefully engineer such defects into the material. Generally, the dirtier a superconductor is, the more current it can carry. Such imperfections are desirable because they ÒpinÓ vortices and prevent them from moving in response to the Magnus force. Vortex lines prefer to sit at pinning sites in the crystal lattice because in doing so they lower their energy. The situation is analogous to that of a marble rolling around on top of a table that contains a few small holes. Common experience tells us that the marble prefers to sit in one of the holes in the table, where its gravitational potential energy is lowest.
Pinning has a characteristic eÝect on the vortex solid in a superconductor: it disrupts the regular lattice pattern that would otherwise form in an ideal, pure material. In other words, the pinning prevents the material from condensing into a perfect vortex solid in strong magnetic Þelds. The phase that forms instead is what researchers now describe as a vortex glass. The term is appropriate because the positions of the vortices form an irregular, disordered pattern, similar to that assumed by molecules in glass.
The vortex glass idea was not widely accepted when it was Þrst proposed in 1989. Other descriptions, such as those that treat the vortex lines as individual particles, could also account for the observed behavior of the high-temperature materials. The vortex glass model, however, made several testable predictions. It postulated that, given a suÛciently large concentration of pinning defects, the vortex liquid would freeze smoothly into a glass. This behavior contrasts with that shown for pure materials, in which the vortex liquid solidiÞes rather abruptly and in a hysteretic manner. The vortex glass model also described the behavior of the resistivity as a function of temperature, current and magnetic Þeld.
A clear veriÞcation of the vortex glass model came about only when researchers could carry out extremely sensitive transport measurements of a type not usually done in superconductors. SpeciÞcally, experimenters designed an apparatus that could measure the voltage across a high-temperature superconductor with subpicovolt (10Ð12 volt) resolutionÑan accuracy previously unavailable. The picovoltmeter used a superconducting quantum interference device, or SQUID. Such devices rely on quantum eÝects to measure minute current and voltage changes. With a SQUID, the picovoltmeter had a sensitivity about one million times greater
Copyright 1993 Scientific American, Inc.
RESISTANCE |
0.20 |
YBa2Cu3O7 |
|
|
|
|
|
|
|
STATE |
|
MAGNETIC FIELD = 4.5 TESLAS |
|
|
0.15 |
|
|
|
|
TO NORMAL |
|
|
|
|
0.10 |
|
|
|
|
RESISTANCEOFRATIO |
|
COOLING |
|
|
|
|
|
||
|
0.05 |
|
WARMING |
|
|
|
|
|
|
|
0 |
|
|
|
|
83.30 |
83.40 |
83.50 |
83.60 |
|
|
|
TEMPERATURE (KELVINS) |
|
COOLING AND HEATING of a very clean crystal of the superconductor YBCO in a magnetic Þeld produce resistance plots that do not exactly retrace one another. The measurement shows that the vortex lattice melts abruptly. In eÝect, the vortex liquid can be slightly ÒsupercooledÓ before it freezes, much as pure water can.
than that of an ordinary voltmeter. The resolution was suÛciently high to conÞrm or dispute the vortex glass theory.
The principles behind the picovoltmeter itself are rather simple. Samples are placed in an insulating container that can maintain the temperature inside to within a few millikelvins. Superconducting coils surround the container and apply a uniform magnetic Þeld to the sample. Current is sent through wires connected to the sample, and the SQUID then measures the resistance of the sample. The SQUID and superconducting magnets are conventional, low-tem- perature superconductorsÑan example of the old technology helping us to measure and grasp the new.
The apparatus resoundingly conÞrmed the predictions of the vortex glass model. The measured re-
sistances and currents matched those predicted by the model, smoothly going to zero as the temperature was reduced to the freezing point of the liquid [see box on opposite page]. This smooth behavior is very diÝerent from that found for very clean crystals: in them, the phase transition is sudden and hysteretic. The observation shows the importance of pinning-induced disorderÑthe role of Òdirt,Ó so to speakÑ in changing the dynamics of the melting transition. Instead of a solid, the vortex liquid in the disordered crystal freezes into a vortex glass.
The high-temperature superconduc-
tors have proved to be a wonderful testing ground for our knowledge of type II superconductivity. For instance, we can now conclude that the vortex glass also exists in conventional superconductors, although the state may be hard to see. Nevertheless, it remains to be seen whether the knowledge can be translated eÝectively into applications. Researchers are actively looking for the kind of defects that could pin vortices most eÝectively. Much has been accomplished to fashion superconducting wires and to improve their current-car- rying capability. Our present microscopic understanding of the various vortex states can only help us engineer better materials for the applications we all so eagerly await.
FURTHER READING
SUPERCONDUCTIVITY. Edited by R. D. Parks. Marcel Dekker, 1969.
INTRODUCTION TO SUPERCONDUCTIVITY. Michael Tinkham. Robert E. Krieger Publishing, 1980.
MAGNETIC FLUX-LINE LATTICES AND VOR-
TICES IN THE COPPER OXIDE SUPERCON-
DUCTORS. D. J. Bishop, P. L. Gammel, D. A. Huse and C. A. Murray in Science, Vol. 255, pages 165Ð172; January 10, 1992.
ARE SUPERCONDUCTORS REALLY SUPER-
CONDUCTING? D. A. Huse, Matthew P. A. Fisher and Daniel S. Fisher in Nature, Vol. 358, No. 6387, pages 553Ð559; August 13, 1992.
SCIENTIFIC AMERICAN February 1993 55