

Datapilot Revisited
August 21st, 2005
Version 2.0 of OOo Calc will feature significant improvements to the DataPlot functionality. For this reason, we will revisit this powerful feature over the next few days.
First, the basics…
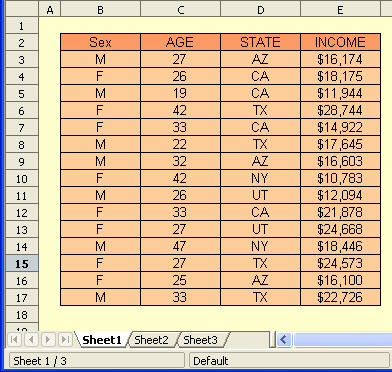
Consider the table of data below. There are numerous ways we may want to analyse this data. By using the DataPilot functionality in OOo Calc, we can perform the different analyses quite easily - with a bit of practice.
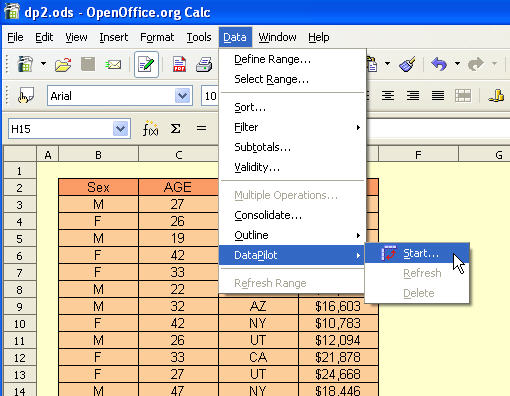
We first select the table we wish to analyze. Then Data-DataPilot-Start as is illustrated below.
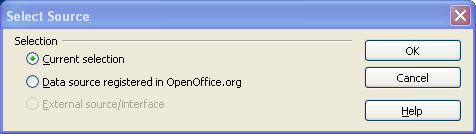
We first are presented with the popup dialog below. We have already selected the data we are interested in - so we just select OK.
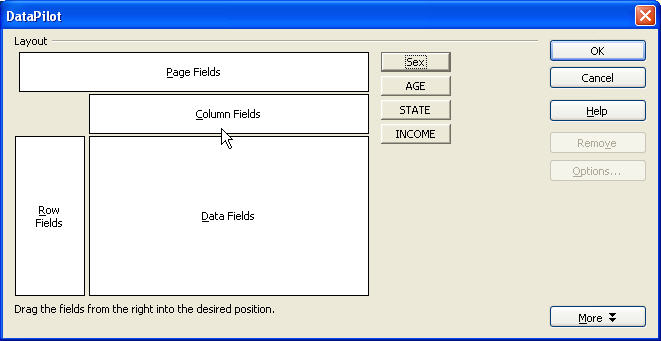
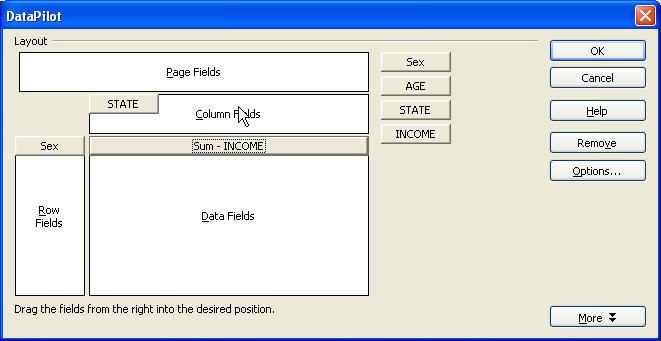
The next dialog box allow us to choose the layout of the DataPilot table. In our example, we are interested in knowing how each broker performed in each exchange.
Normally, at least one of the columns in our data source is numerical data that will be processed against the variables we are interested in.
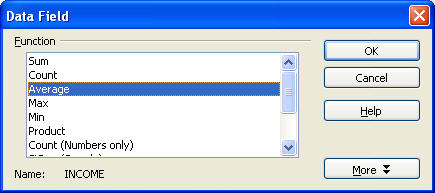
Finally, we get to decide how the data is processed against the input variables. By default, the data is SUMmed, but that may not necessarily always be the case. This dialog is activated by double-clicking on the data field button.
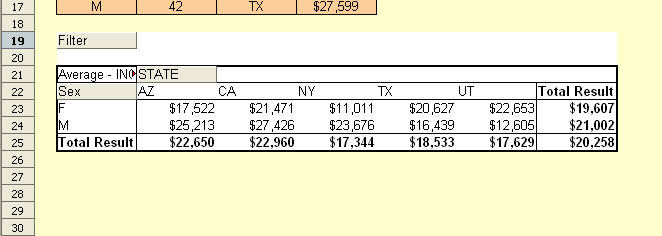
Finally, the output DataPIlot table (or Pivot Table in Excel speak). It isplaced by OOo Calc just below the original data in this example.
DataPilot Revisited II
August 22nd, 2005
In this tip, we build on our previous lesson by looking at one of the key new OOo 2.0 features related to the DataPilot.
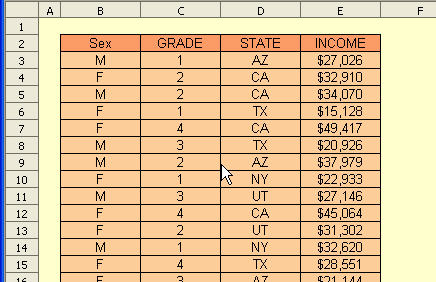
The example table below has four fields, Sex (M/F), pay grade, state of residence , and salary.
We open the DataPilot dialog as before. For OOo 2.0, a new Page Field is available. We drag the headers into the various DataPilot fields as shown below.
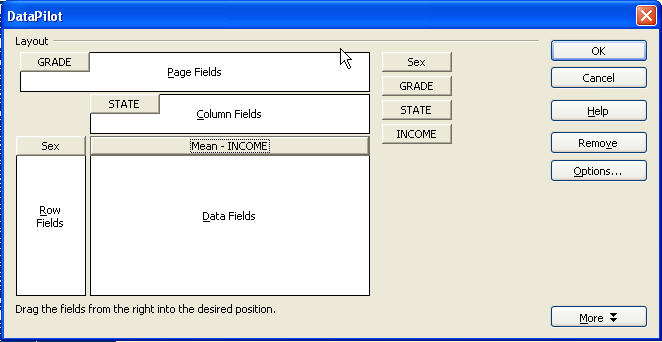
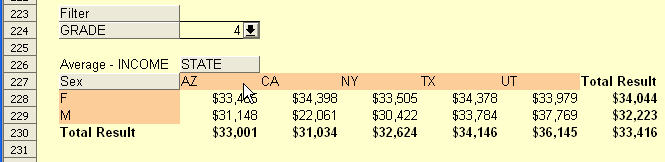
The new Page field gives us a filter to control the data that is displayed/processed in the DataPilot table.
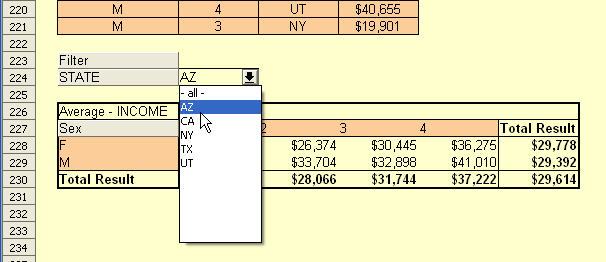
Below, we have returned to the DataPilot dialog and swapped the STATE and GRADE fields. We see the different options provided by the filter. A good illustration of the power and flexibility of the updated DataPilot feature in OOo Calc.
Posted in Using OpenOffice Calc | No Comments »
____________________________________________________
Splitting a string into characters
August 18th, 2005
Here’s a silly trick to split your string into separate characters across a range of cells.
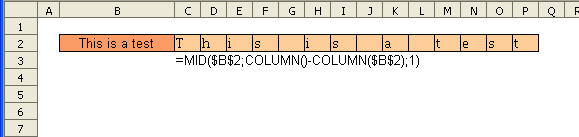
You just need to enter the formula in C2 and then copy across the row as shown.
Posted in Function Tips | No Comments »
Basic functions: text
August 17th, 2005
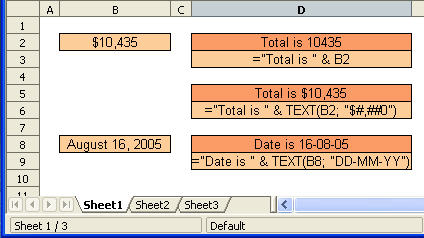
At first glance, the TEXT function may not sound very useful. Here are a few simple applications.
In the top example, without the TEXT function, the total is not formatted correctlt (as a currency). However, the TEXT function allows us to apply the correct format to the number component of the string.
In the second example, we see how the TEXT function allows us to reformat existing data - such as dates.
Posted in Function Tips | No Comme