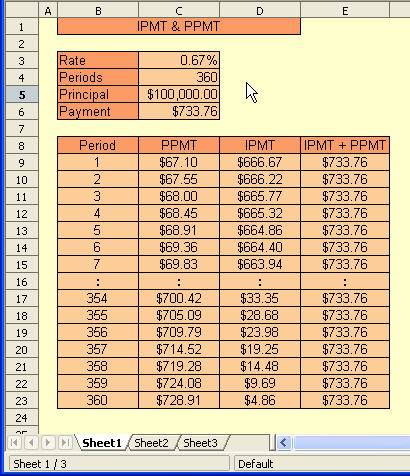
In case you need further convincing, the ipmt and ppmt components are summed in column e, and are constant throughout the life of the loan - as expected.
Posted in Finance | 1 Comment »
Array Formulas: Working with Matrices
An array is a linked range of cells on a spreadsheet containing values. A formula in which the individual values in a
As an introduction to array formulas - we introduce one of the builtin array functions - TRANSPOSE, which as the same suggests - transposes the rows and columns of the original array to the target array.
In the example below, we wish to transpose A1:D3 to B6:D9.
With B6 selected - enter =TRANSPOSE(A1:D3) - followed byCtrl-Shift-Enter. OOo Calc takes care of the rest! Note that in the Input Window - the function is embedded within { } indicating an array function. These are automatically added by OOo Calc.

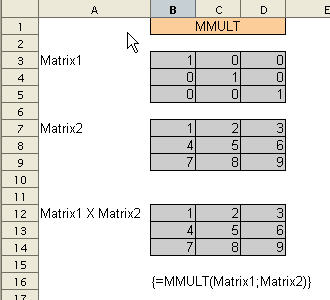
OOo Calc also has a builtin function for multiplying matrices -MMULT. The use of this function is demonstrated in the example below.
We use Insert->Names->Define to define the two product matrices as Matrix1 and Matrix2. Using defined names to define and manipulate matrices is good practice - as is highlighting the matrices with different backgorund colors.
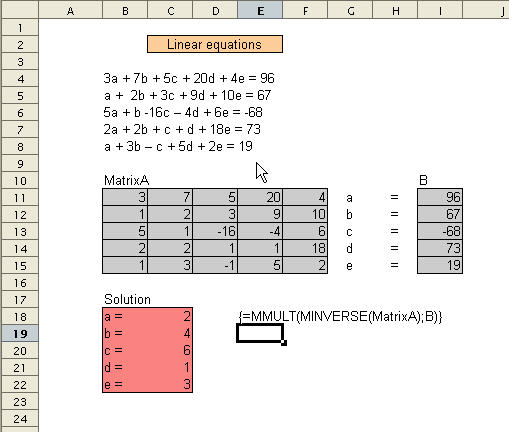
To calculate the inverse of a matrix, we use the MINVERSEfunction. This is illustrated below.

We can now apply our knowledge of matrix manipulation in OOo Calc to solve for a system of linear equations. The technique is illustrated in the example below.
This entry was posted on Monday, O
Datasources : Spreadsheets
In OOo Calc, there exists the concept of Data Sources. A data source can take many forms - including MySQL database, text file, address book and spreadsheet. We will eventually examine each of these in more detail.
When we identify a data source that we would like to use, we will need to register it as such with Open Office Calc. This short tutorial will illustrate how to do this for an OOo Calc spreadsheet.
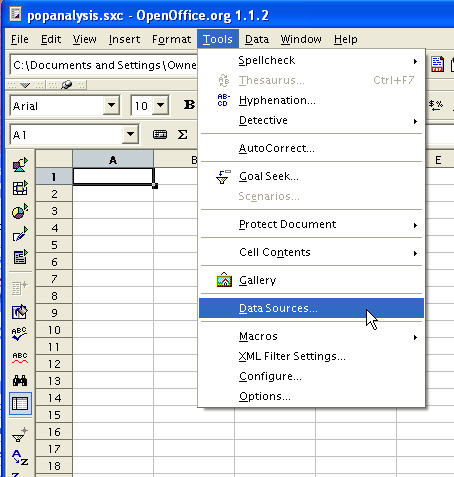
We first invoke the Data Source Adminstration dialog window - as shown below.
In the Data Source Adminstration dialog window, we select theGeneral tab.

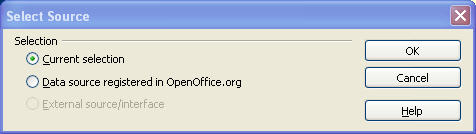
At the top left. we select New Data Source. In the Name box, we enter “popdata”. The Database type is a drop-down list of different options - we will choose spreadsheet. The Data source URL allows us to specify the path to our external spreadsheet data source.
Next click on the Tables tab. By default, all sheets/tables in the spreadsheet will be tagged as visible. At this time, we will make no changes. Click OK. We have completed the registration of our OOo Calc spreadsheet as a data source.

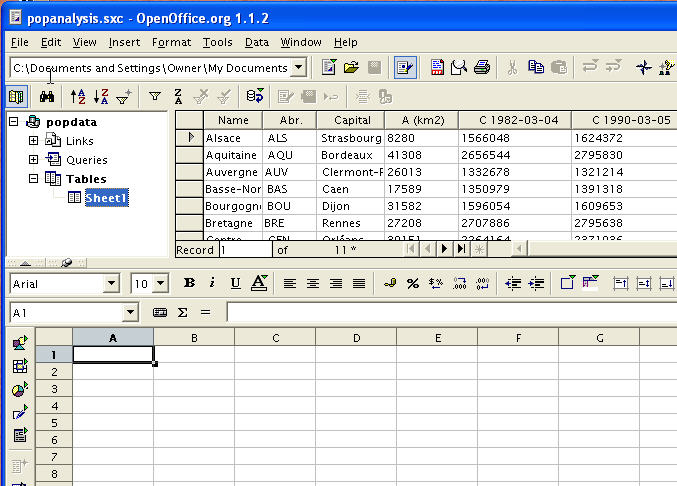
To confirm that we have indeed added a new data source, we can browse our data sources as shown below.
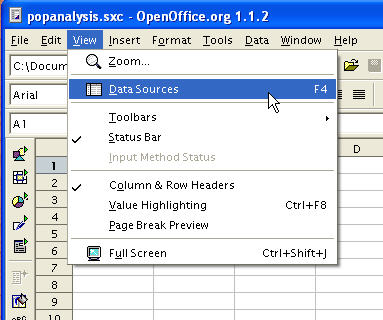
By clicking on Sheet1 under popdata, we can view the contents of that particular table.
To be continued…
Datapilot Revisited
August 21st, 2005
Version 2.0 of OOo Calc will feature significant improvements to the DataPlot functionality. For this reason, we will revisit this powerful feature over the next few days.
First, the basics…
Consider the table of data below. There are numerous ways we may want to analyse this data. By using the DataPilot functionality in OOo Calc, we can perform the different analyses quite easily - with a bit of practice.

We first select the table we wish to analyze. Then Data-DataPilot-Start as is illustrated below.

We first are presented with the popup dialog below. We have already selected the data we are interested in - so we just select OK.
The next dialog box allow us to choose the layout of the DataPilot table. In our example, we are interested in knowing how each broker performed in each exchange.

Normally, at least one of the columns in our data source is numerical data that will be processed against the variables we are interested in.

Finally, we get to decide how the data is processed against the input variables. By default, the data is SUMmed, but that may not necessarily always be the case. This dialog is activated by double-clicking on the data field button.

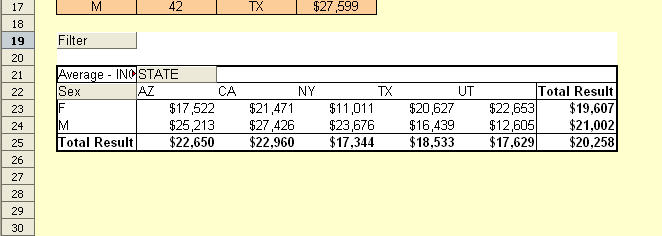
Finally, the output DataPIlot table (or Pivot Table in Excel speak). It isplaced by OOo Calc just below the original data in this example.