

vk.com/id446425943
Russia
Electric Utilities
9 November 2018
TGK-1, ord. (TGKA RX, RUB)
Buy (10 May 2018, 14:05 UTC)
Previous: Hold (28 Feb 2018, 06:02 UTC)
Target price, 12mo: 0.013
Last price: 0.0088 (08 Nov 2018, close)
Expected total return: 54%
Upside, 12mo: 47%
DY, next 12mo: 7.1%
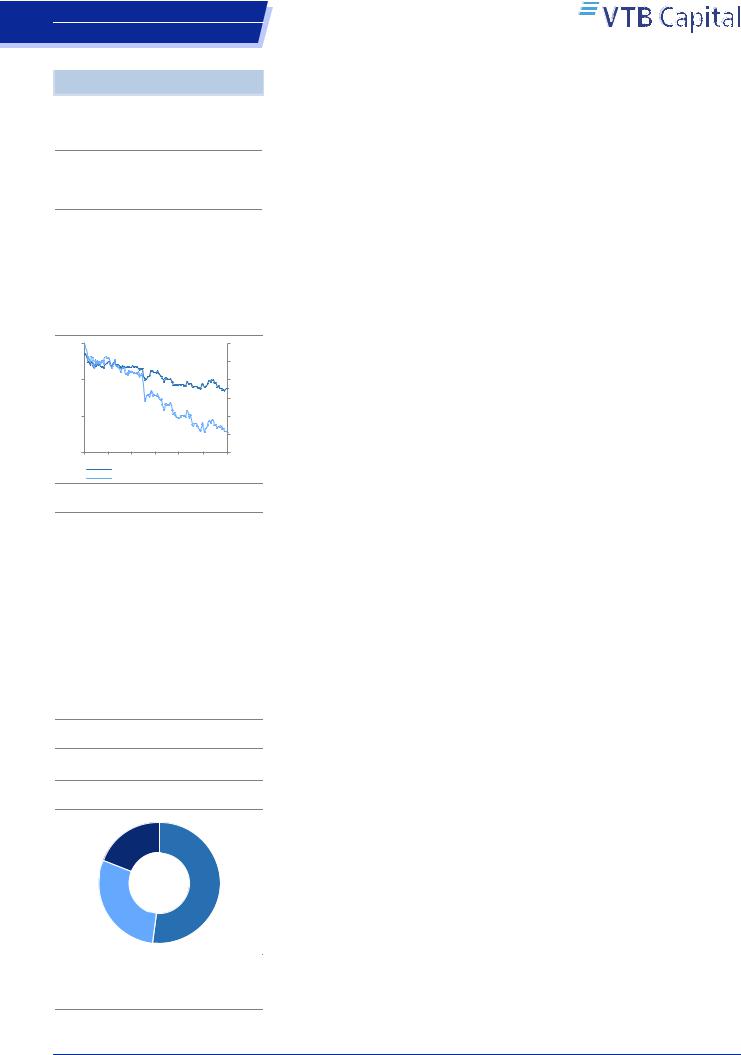
Share price performance, 12-mo
0.016 |
|
|
|
|
10% |
0.014 |
|
|
|
|
0% |
0.012 |
|
|
|
|
-10% |
|
|
|
|
|
|
0.01 |
|
|
|
|
-20% |
0.008 |
|
|
|
|
|
|
|
|
|
-30% |
|
0.006 |
|
|
|
|
|
|
|
|
|
|
|
0.004 |
|
|
|
|
-40% |
|
|
|
|
|
|
0.002 |
|
|
|
|
-50% |
0 |
|
|
|
|
-60% |
Nov |
Jan |
Mar |
May |
Jul |
Sep |
TGKA RX, RUB, lhs
Relative to MOEX Index, %, rhs
Equities |
|
|
|
|
|
|
1M |
3M |
12M |
3Y |
|
|
|
||||
|
Price |
-8% |
-7% |
-43% |
110% |
|
Price relative |
-7% |
-13% |
-49% |
51% |
|
ADTV (USD mn) |
0.21 |
0.18 |
0.32 |
0.28 |
|
Key financial highlights |
|
|
|
|
|
Fiscal year end |
12/17 |
12/18F |
12/19F |
12/20F |
|
P/E, x |
6.6x |
3.5x |
3.7x |
3.3x |
|
EV/EBITDA, x |
3.3x |
2.3x |
2.0x |
1.7x |
|
P/B, x |
0.4x |
0.3x |
0.3x |
0.2x |
|
FCF yield, % |
14.7% |
20.3% |
21.0% |
24.1% |
|
DY (ords), % |
3.6% |
7.1% |
6.7% |
7.6% |
|
Net sales, RUB mn |
87,395 |
89,668 |
92,083 |
95,577 |
|
EBITDA, RUB mn |
20,992 |
20,748 |
20,979 |
22,426 |
|
Net income, RUB mn |
7,927 |
9,652 |
9,105 |
10,322 |
|
Net sales, chg |
11% |
3% |
3% |
4% |
|
EBITDA, chg |
17% |
-1% |
1% |
7% |
|
Net income, chg |
49% |
22% |
-6% |
13% |
|
EPS(ords), RUB |
0.0021 |
0.0025 |
0.0024 |
0.0027 |
|
DPS (ord.), RUB |
0.00 |
0.00 |
0.00 |
0.00 |
|
BPS(ords), RUB |
0.030 |
0.032 |
0.034 |
0.036 |
|
EBITDA margin, % |
24.0% |
23.1% |
22.8% |
23.5% |
|
ROE, % |
7% |
8% |
7% |
8% |
|
Net Debt, RUB mn |
17,734 |
13,002 |
8,905 |
3,350 |
|
ND/EBITDA, x |
0.8x |
0.6x |
0.4x |
0.1x |
|
Net int. cover, x |
7.0x |
17.2x |
12.5x |
18.8x |
Multiples and yields are calculated based on period-average prices where available.
Source: Bloomberg, Company data, VTB Capital Research
Change of Forecasts
TGK-1
9mo18 IFRS; profits on track, dividends not in sight
TGK1 released its 9mo18 IFRS results on 7 November. Net income gained 26% YoY, slightly beating our estimates, albeit growing at a slowed pace. The financials suggested that TGK1 is not preparing for a 50% dividend payout, taking into account the cash balances and accelerated deleveraging. We have updated our model and rolled it forward into 2019F, taking a closer look at the 2019 outlook, which suggests a profitability plateau for the company in coming years. Along with stability, but no growth, in profitability metrics, we forecast a 6-7% dividend yield at a 25% dividend payout that is unlikely to change, in our view. We believe that this is subpar. Thus, we do not see any shortterm triggers that could immediately cause the stock to rerate. Our unchanged 12-month Target Price of RUB 0.013 implies an ETR of 54%. Buy reiterated.
9mo18 – 26% bottom line gain exceeds expectations. TGK1’s 9mo18 numbers were another set of financials to show decent profitability growth. The company’s top line was RUB 63,494mn, up 6% YoY on the production results, export operations and capacity payments. There were no surprises reported on the costs side, and accounting for accelerated cost growth, adj. EBITDA increased only slightly YoY, to RUB 16,202mn, 5% above our expectations due to higher revenues. However, because TGK1 continues to record a sharp moderation of finance costs (with total debt reduction of 43% from the end of 2017), net income still jumped 26% YoY to RUB 8,548mn, albeit with the rate of increases slowing from 1H18.
Short-term outlook implies stability, but almost no growth. For most of the companies in the sector, the period of high double-digit profitability growth has already passed – and TGK1 is no exception, after having posted cumulative 39% growth of EBITDA in 2015-2017 and 17% only in 2017. In FY18, we forecast a 1% YoY slide and only marginal gains in the next two years, implying that TGK1 has reached its profitability plateau, which we expect to slide as early as in 2021F. Although, this profitability alone would be sufficient to justify a substantially higher valuation, the reluctance of Gazprom as controlling shareholder to step up its dividend policy from the current 25% is unfavorable for the investment case, in our view.
Buy maintained. We update our model for the released production results and financial data, incorporate updated economic forecasts and modernisation expectations, along with rolling the model forward into 2019. We continue to rate the stock as a Buy with a 12-month target price of RUB 0.013 and ETR of 54%.
Vladimir Sklyar, Equities Analyst
+7 495 589 21 62 // vladimir.sklyar@vtbcapital.com
Anastasia Tikhonova, Equities Analyst
+7 495 660 42 18 // anastasia.tikhonova@vtbcapital.com
Prices cited in the body of this report are as of the last close before, or the close on, 08 Nov 2018 (except where indicated otherwise). VTB Capital analysts update their recommendations periodically as required.
Please refer to the Disclosures section of this report for other important disclosures, including the analyst certification and information as required by EU-MAR. Additional disclosures regarding the subject company(ies) discussed in this report can be found at http://research.vtbcapital.com/ServicePages/Disclosures.aspx.

vk.com/id446425943
Russia
Electric Utilities
TGK-1 |
|
Table of contents |
|
9mo18 results summary ............................................................................................ |
5 |
Short-term outlook ..................................................................................................... |
5 |
Long-term drivers....................................................................................................... |
6 |
Forecast changes....................................................................................................... |
7 |
Disclosures ................................................................................................................. |
8 |
9 November 2018 |
2 |
vk.com/id446425943
Russia
Electric Utilities
VTB Capital Facts & Forecasts
Russia
Electric Utilities
TGK-1
Prices as of: 8 November 2018
Ticker |
CCY |
Current |
12mo TP |
Rating |
TGKA RX* |
RUB |
0.0088 |
0.013 |
Buy |
Note: * - per 1,000 shares |
|
|
||
Share price performance, 12-mo
0.015 |
0% |
|
-10% |
0.01 |
-20% |
|
-30% |
0.005 |
-40% |
|
-50% |
0 |
-60% |
Nov Jan Mar May Jul Sep Nov
TGKA RX, RUB, lhs
Relative to MOEX Index, %, rhs
Company description
TGK 1 produces electricity and heat in NorthWest Russia (St Petersburg and the Leningrad region, as well as the Karelia and Murmansk regions). It owns 55 power plants with a total capacity of 6.9GW of electric and 14,362GCal/h of heat. TGK 1 is the only TGK with notable hydro assets (46% and 50% based on capacity and production, respectively). Gazprom is TGK 1's controlling shareholder, with 52% ownership. Another 26% is owned by Fortum. One of the key risks for the company is a potential sale of hydro assets to either Fortum or RusHydro (both have expressed interest). However, at the current stage the potential sale has a low chance of going through given i) comments by Gazprom that there are no negotiations taking place and ii) the high valuation demanded by Gazprom at the level of EM peers, which would be unlikely to be paid, in our view.
Company website
http://eng.tgc1.ru/
Shareholder structure
Free-float |
GazpromEnergo |
19% |
Holding |
|
52% |
Fortum
29%
Source: Company data, VTB Capital Research
Research team
Vladimir Sklyar / +7 495 589 21 62
Anastasia Tikhonova / +7 495 660 42 18
TGK-1
Last model update on: 9 November 2018
|
IFRS |
2016 |
2017 |
2018F |
2019F |
2020F |
|
2021F |
||
|
Company data |
|
|
|
|
|
|
|
|
|
|
Weighted avg # shares, mn |
|
3,854,341 |
3,854,341 |
3,854,341 |
3,854,341 |
3,854,341 |
|
3,854,341 |
|
|
Avg market cap, RUB mn |
25,060 |
52,377 |
34,072 |
34,072 |
34,072 |
34,072 |
|
||
|
EV, RUB mn |
48,857 |
70,111 |
47,074 |
42,978 |
37,422 |
33,020 |
|
||
|
Ratios & analysis |
|
|
|
|
|
|
|
|
|
|
P/E, x |
|
4.7x |
6.6x |
3.5x |
3.7x |
3.3x |
|
4.1x |
|
|
EV/EBITDA, x |
2.7x |
3.3x |
2.3x |
2.0x |
1.7x |
|
1.7x |
||
|
P/B, x |
|
0.2x |
0.4x |
0.3x |
0.3x |
0.2x |
|
0.2x |
|
|
FCF yield, % |
29.7% |
14.7% |
20.3% |
21.0% |
24.1% |
20.7% |
|
||
|
Dividend yield (ords), % |
5.3% |
3.6% |
7.1% |
6.7% |
7.6% |
6.1% |
|
||
|
Dividend yield (prefs), % |
|
|
|
|
|
|
|
|
|
|
EPS(ords), RUB |
0.0014 |
0.0021 |
0.0025 |
0.0024 |
0.0027 |
0.0021 |
|
||
|
CFPS, RUB |
0.0037 |
0.0045 |
0.0052 |
0.0053 |
0.0055 |
0.0052 |
|
||
|
Free CFPS, RUB |
0.0019 |
0.0020 |
0.0018 |
0.0019 |
0.0021 |
0.0018 |
|
||
|
DPS (ords), RUB |
0.00035 |
0.00049 |
0.00063 |
0.00059 |
0.00067 |
0.00054 |
|
||
|
Payout ratio (ords), % |
25.0% |
23.8% |
25.0% |
25.0% |
25.0% |
25.0% |
|
||
|
BPS(ords), RUB |
0.029 |
0.030 |
0.032 |
0.034 |
0.036 |
0.038 |
|
||
|
Revenues growth, % |
|
14% |
11% |
3% |
3% |
4% |
|
-1% |
|
|
EBITDA, chg |
|
6% |
17% |
-1% |
1% |
7% |
|
-12% |
|
|
EPS growth, % |
|
-9% |
49% |
22% |
-6% |
13% |
|
-20% |
|
|
EBIT margin, % |
13% |
14% |
14% |
13% |
14% |
11% |
|
||
|
EBITDA margin, % |
22.7% |
24.0% |
23.1% |
22.8% |
23.5% |
20.8% |
|
||
|
Net margin, % |
6.7% |
9.1% |
10.8% |
9.9% |
10.8% |
8.7% |
|
||
|
ROE, % |
5.2% |
7.4% |
8.3% |
7.4% |
7.9% |
6.1% |
|
||
|
ROIC, % |
5.0% |
6.3% |
6.6% |
6.4% |
6.9% |
5.3% |
|
||
|
Capex/Revenues, % |
12% |
12% |
15% |
14% |
14% |
14% |
|
||
|
Capex/Depreciation, x |
1.2x |
1.2x |
1.5x |
1.5x |
1.4x |
|
1.4x |
||
|
Net debt/Equity, % |
22% |
15% |
10% |
7% |
2% |
-1% |
|
||
|
Net debt/EBITDA, x |
1.3x |
0.8x |
0.6x |
0.4x |
0.1x |
|
(0.1x) |
||
|
Net interest cover, x |
4.2x |
7.0x |
17.2x |
12.5x |
18.8x |
|
21.5x |
||
|
Income statement summary, RUB mn |
|
|
|
|
|
|
|
|
|
|
Revenues |
78,891 |
87,395 |
89,668 |
92,083 |
95,577 |
94,742 |
|
||
|
Cost of sales |
(62,118) |
(67,553) |
(69,533) |
(71,782) |
(73,852) |
(75,722) |
|
||
|
SG&A and other opexp. |
(488) |
599 |
746 |
678 |
700 |
726 |
|
||
|
EBITDA |
17,890 |
20,992 |
20,748 |
20,979 |
22,426 |
19,746 |
|
||
|
Depreciation & amortization |
|
(7,684) |
(8,454) |
(8,448) |
(8,776) |
(9,063) |
|
(9,331) |
|
|
Operating profit |
8,601 |
11,986 |
12,433 |
12,203 |
13,362 |
10,415 |
|
||
|
EBIT |
|
10,206 |
12,537 |
12,301 |
12,203 |
13,362 |
|
10,415 |
|
|
Net interest income/(exp.) |
(2,134) |
(1,466) |
(368) |
(822) |
(460) |
(86) |
|
||
|
Profit before tax |
6,466 |
10,520 |
12,065 |
11,382 |
12,903 |
10,329 |
|
||
|
Income tax |
(1,142) |
(2,592) |
(2,413) |
(2,276) |
(2,581) |
(2,066) |
|
||
|
Net income |
5,324 |
7,927 |
9,652 |
9,105 |
10,322 |
8,263 |
|
||
|
Cash flow statement summary, RUB mn |
|
|
|
|
|
|
|
|
|
|
Cash flow from operations |
|
14,162 |
17,209 |
20,039 |
20,254 |
21,214 |
|
19,991 |
|
|
Working capital changes |
(2,597) |
(2,418) |
(86) |
(287) |
(539) |
419 |
|
||
|
Capex |
(9,283) |
(10,281) |
(13,051) |
(12,923) |
(12,923) |
(12,923) |
|
||
|
Other investing activities |
203 |
161 |
346 |
155 |
250 |
399 |
|
||
|
Free cash flow |
7,434 |
7,720 |
6,915 |
7,167 |
8,199 |
7,051 |
|
||
|
Dividends paid |
(937) |
(1,331) |
(1,888) |
(2,413) |
(2,276) |
(2,581) |
|
||
|
Net change in borrowings |
(2,450) |
(2,421) |
(10,144) |
(3,098) |
(4,000) |
(2,000) |
|
||
|
Other financing cash flow |
- |
- |
(714) |
(976) |
(710) |
(485) |
|
||
|
Movement in cash |
1,654 |
3,621 |
(5,412) |
999 |
1,555 |
2,402 |
|
||
|
Balance sheet summary, RUB mn |
|
|
|
|
|
|
|
|
|
|
Cash and equivalents |
3,355 |
6,976 |
1,564 |
2,562 |
4,117 |
6,519 |
|
||
|
PP&E |
132,469 |
133,412 |
138,147 |
142,294 |
146,153 |
149,744 |
|
||
|
Other assets |
23,947 |
23,400 |
22,125 |
20,834 |
19,718 |
17,638 |
|
||
|
Total assets |
159,771 |
163,788 |
161,836 |
165,690 |
169,988 |
173,901 |
|
||
|
Interest bearing debt |
27,152 |
24,710 |
14,565 |
11,467 |
7,467 |
5,467 |
|
||
|
Other liabilities |
22,635 |
22,619 |
23,047 |
23,307 |
23,559 |
23,790 |
|
||
|
Total liabilities |
|
49,787 |
47,328 |
37,613 |
34,774 |
31,027 |
|
29,257 |
|
|
Total shareholder's equity |
|
101,678 |
107,830 |
115,594 |
122,286 |
130,332 |
|
136,015 |
|
|
Minority interest |
|
8,306 |
8,629 |
8,629 |
8,629 |
8,629 |
|
8,629 |
|
|
Net working capital |
10,918 |
11,953 |
10,249 |
8,698 |
7,329 |
5,019 |
|
||
|
Net Debt |
23,797 |
17,734 |
13,002 |
8,905 |
3,350 |
(1,052) |
|
||
|
Capital |
128,830 |
132,540 |
130,159 |
133,754 |
137,799 |
141,482 |
|
||
9 November 2018 |
3 |
vk.com/id446425943 |
TGK-1 |
Russia |
|
Electric Utilities |
|
Figure 1: General company information
Ticker |
TGKA RX |
12-month Target Price, RUB/share |
0.013 |
Rating |
Buy |
Installed capacity in 2018F, MW |
6,952 |
Current price, RUB/share |
0.009 |
Market cap, RUB mn |
34,188 |
EV, RUB mn |
47,190 |
EV/Installed capacity, USD/kW |
104 |
Multiples 2018F |
|
EV/EBITDA, x |
2.3 |
PE, x |
3.5 |
EBITDA margin, % |
23% |
Net debt/EBITDA, x |
0.6 |
Source: Company data, Bloomberg, VTB Capital Research
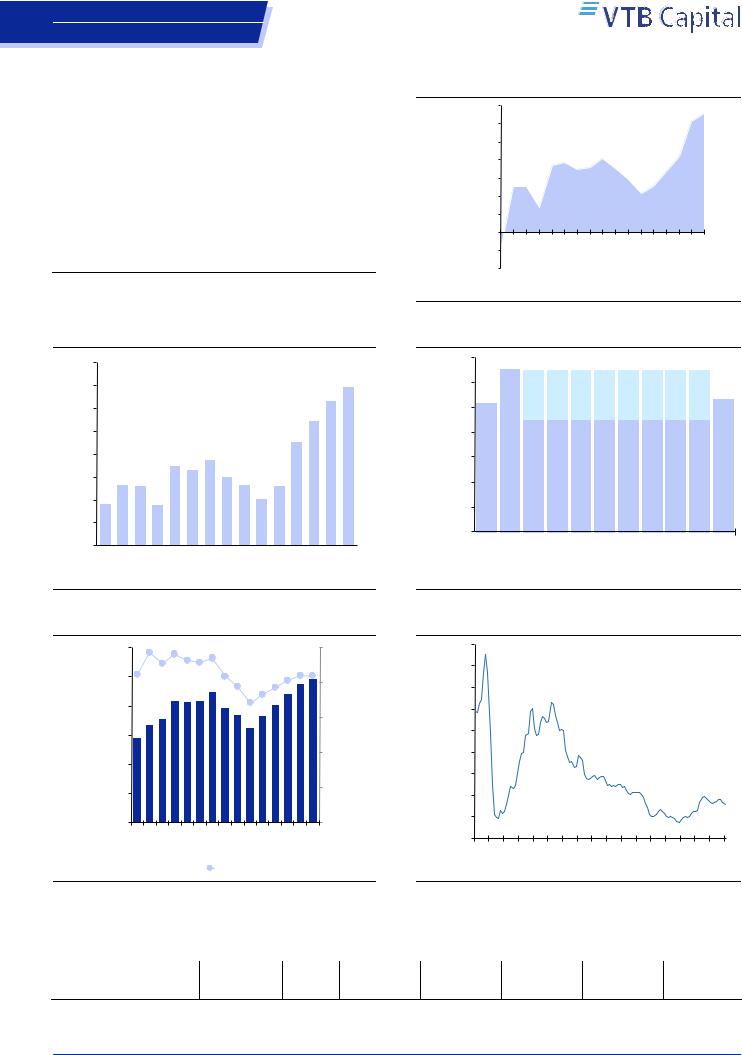
Figure 2: TGK1 FCFF profile, RUB mn
|
14,000 |
|
12,000 |
|
10,000 |
RUBmn |
8,000 |
4,000 |
|
|
6,000 |
2,000
-
(2,000)
(4,000)
2012 |
2013 |
2014 |
2015 |
2016 |
2017 |
2018F |
2019F |
2020F |
2021F |
2022F |
2023F |
2024F |
2025F |
2026F |
2027F |
2028F |
Source: Company data, VTB Capital Research
Figure 3: TGK1 dividend yield profile
16% |
|
|
|
|
|
|
|
|
|
|
|
|
|
|
|
|
|
|
14% |
|
|
|
|
|
|
|
|
|
|
|
|
|
|
|
|
14% |
|
|
|
|
|
|
|
|
|
|
|
|
|
|
|
13% |
||||
|
|
|
|
|
|
|
|
|
|
|
|
|
|
|
||||
12% |
|
|
|
|
|
|
|
|
|
|
|
|
11% |
|
|
|||
|
|
|
|
|
|
|
|
|
|
|
|
|
|
|
||||
10% |
|
|
|
|
|
|
|
|
|
|
|
9% |
|
|
|
|
|
|
|
|
|
|
|
|
|
|
|
|
|
|
|
|
|
|
|
|
|
8% |
|
|
|
|
7% |
7% |
8% |
|
|
|
|
|
|
|
|
|
|
|
|
|
|
|
|
|
6% 5% |
|
|
|
|
|
|
|
|
|
|||
6% |
|
5% 5% |
|
|
|
|
|
5% |
|
|
|
|
|
|
|
|||
4% |
4% |
|
|
4% |
|
|
|
|
|
4% |
|
|
|
|
|
|
|
|
|
|
|
|
|
|
|
|
|
|
|
|
|
|
|
|
|||
2% |
|
|
|
|
|
|
|
|
|
|
|
|
|
|
|
|
|
|
0% |
|
|
|
|
|
|
|
|
|
|
|
|
|
|
|
|
|
|
|
|
|
|
|
|
|
|
|
|
|
|
|
|
|
|
|
|
|
2014 |
2015 |
2016 |
2017 |
2018F |
2019F |
2020F |
2021F |
2022F |
2023F |
2024F |
2025F |
|
2026F |
|
2027F |
|
2028F |
|
|
|
|
|
|||||||||||||||
Source: Company data, VTB Capital Research
Figure 4: TGK1 capex outlook
|
14,000 |
|
|
|
|
|
|
|
|
|
|
|
|
|
|
|
|
|
12,000 |
|
|
|
|
3,923 |
3,923 |
|
3,923 |
|
|
3,923 |
3,923 |
3,923 |
3,923 |
3,923 |
|
|
10,000 |
|
|
|
|
|
|
|
|
||||||||
|
|
|
|
|
|
|
|
|
|
|
|
|
|
|
|
|
|
RUBmn |
8,000 |
10,281 |
13,051 |
9,000 |
9,000 |
|
9,000 |
|
|
9,000 |
9,000 |
9,000 |
9,000 |
9,000 |
10,584 |
||
4,000 |
|
|
|
||||||||||||||
|
6,000 |
|
|
|
|
|
|
|
|
|
|
|
|
|
|
|
|
|
2,000 |
|
|
|
|
|
|
|
|
|
|
|
|
|
|
|
|
|
- |
|
|
|
|
|
|
|
|
|
|
|
|
|
|
|
|
|
|
|
|
|
|
|
|
|
|
|
|
|
|
|
|
|
|
|
2017 |
|
2018F |
2019F |
2020F |
2021F |
2022F |
2023F |
2024F |
2025F |
2026F |
2027F |
|||||
|
|
|
|||||||||||||||
|
|
|
|
|
Maintenance |
|
|
|
Modernisation |
|
|
|
|||||
|
|
|
|
|
|
|
|
|
|
|
|||||||
|
|
|
|
|
|
|
|
|
|
|
|||||||
Source: Company data, VTB Capital Research
Figure 5: TGK1 adjusted EBITDA profile |
Figure 6: TGK1 EV/installed capacity |
|
30,000 |
24% |
24% |
|
|
|
|
|
|
|
|
|
25% |
||
|
|
23% |
23%23% 23% |
|
|
|
|
|
|
||||||
|
21% |
|
|
|
|
|
21% |
|
|
|
|
21%21% |
|||
|
25,000 |
|
|
|
|
|
|
|
19% |
|
|
20% |
|
||
|
|
|
|
|
|
|
|
|
19% |
|
20% |
||||
|
|
|
|
|
|
|
|
|
|
|
18% |
|
|
||
|
|
|
|
|
|
|
|
|
|
17% |
|
|
|
|
|
|
20,000 |
|
|
|
|
|
|
|
|
|
|
|
|
|
15% |
RUBmn |
|
|
|
|
|
|
|
|
|
|
|
|
|
|
|
15,000 |
|
|
|
|
|
|
|
|
|
|
|
|
|
% |
|
|
|
|
|
|
|
|
|
|
|
|
|
|
|
||
|
10,000 |
|
|
|
|
|
|
|
|
|
|
|
|
|
10% |
|
|
|
|
|
|
|
|
|
|
|
|
|
|
|
|
|
5,000 |
|
|
|
|
|
|
|
|
|
|
|
|
|
5% |
|
|
|
|
|
|
|
|
|
|
|
|
|
|
|
|
|
- |
|
|
|
|
|
|
|
|
|
|
|
|
|
0% |
|
2014 |
2015 |
2016 |
2017 |
2018F |
2019F |
2020F |
2021F |
2022F |
2023F |
2024F |
2025F |
2026F |
2027F |
2028F |
|
Adj. EBITDA, lhs |
Adj. EBITDA margin, rhs |
|
||
|
Source: Company data, VTB Capital Research
Figure 7: Russian genco multiples
|
900 |
|
|
800 |
|
|
700 |
|
USD/kW |
600 |
|
500 |
||
|
||
|
400 |
300
200
100
-
Jan-18
Jun-17
Nov-16
Apr-16
Sep-15
Feb-15
Jul-14
Dec-13
May-13
Oct-12
Mar-12
Aug-11
Jan-11
Jun-10
Nov-09
Apr-09
Sep-08
Feb-08
Source: Bloomberg, Company data, VTB Capital Research
|
EV/EBITDA, x |
|
P/E, x |
|
EV/kW, |
|
Net Debt/ |
|
|
EBITDA |
|
|
Net |
|
Dividend |
|
FCFF |
|
|||||
|
|
|
|
|
|
|
USD/kW |
|
EBITDA, x |
|
margin, % |
margin, % |
|
yield, % |
|
|
yield, % |
|
|||||
|
2018F 2019F 2020F |
2018F |
2019F |
2020F |
2018F |
2018F 2019F 2020F |
2018F |
2019F 2020F |
2018F 2019F 2020F |
2018F 2019F 2020F |
2018F 2019F 2020F |
||||||||||||
TGK1 |
2.3 |
2.0 |
1.7 |
3.5 |
3.7 |
3.3 |
104 |
0.6 |
0.4 |
0.2 |
23% |
|
23% |
23% |
11% |
10% |
11% |
7% |
7% |
8% |
20% |
21% |
24% |
Russian average |
3.0 |
3.0 |
2.7 |
5.4 |
6.2 |
5.6 |
112 |
0.4 |
0.4 |
0.4 |
23% |
|
23% |
24% |
11% |
10% |
11% |
7.4% |
6.7% |
8.5% |
20% |
8% |
9% |
DM average |
7.6 |
7.2 |
6.7 |
16.6 |
14.1 |
11.9 |
1,077 |
2.6 |
2.5 |
2.3 |
18% |
|
19% |
20% |
6% |
7% |
8% |
5.3% |
5.3% |
5.3% |
-6% |
-6% |
-6% |
Source: Bloomberg as of 8 November 2018 for DM average, VTB Capital Research
9 November 2018 |
4 |
vk.com/id446425943 |
TGK-1 |
Russia |
|
Electric Utilities |
|
9mo18 results summary
TGK1’s 9mo18 IFRS results again delivered on profit growth – though at a decelerated rate. However, they still came slightly above of our estimates. Revenue of RUB 63,494mn, implied a 6% increase, 1% higher than our estimates. Adjusted EBITDA added 1% YoY to RUB 16,202mn, 5% higher than our estimates, while net income, due to the reduction of finance expenses, grew 26% YoY to RUB 8,548mn.
Figure 8: TGK1 1H18 financial highlights
|
9mo18 |
9mo18F, VTBC |
Diff to VTBC |
9mo17 |
Chng, YoY |
|
|
|
|
|
|
Revenues |
63,494 |
62,683 |
1% |
60,176 |
6% |
Adj EBITDA |
16,202 |
15,494 |
5% |
16,040 |
1% |
Adj EBITDA margin |
26% |
25% |
|
27% |
|
Net income |
8,548 |
7,965 |
7% |
6,766 |
26% |
Net income margin |
13% |
13% |
|
11% |
|
Source: Company data, VTB Capital Research
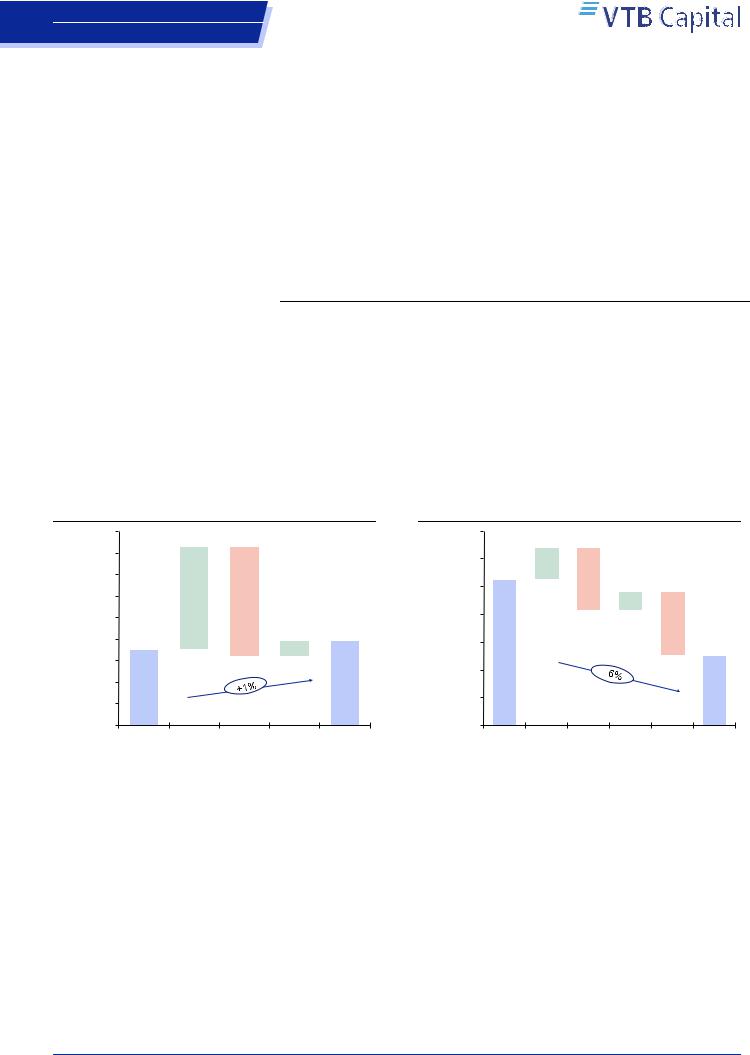
Short-term outlook
TGK1 will next year operate in a business-as-usual environment, in our view. We expect both stable EBITDA and net profit as company remains a beneficiary of its strong operational numbers, DPM revenues and the favourable economics of its hydro capacity. In such environment, cost control and the electricity market price outlook gain importance; however, we question the extent to which the company can alter the investment outlook on the stock.
Thus, in 2019F, we forecast a 1% YoY increase in adjusted EBITDA vs. a 6% net income slide to RUB 9,105mn.
Figure 9: TGK1 2019F adj. EBITDA outlook |
Figure 10: TGK1 2019F net income outlook |
RUBmn
23,500 |
|
|
|
|
|
10,000 |
|
|
|
|
|
23,000 |
|
|
|
|
|
9,800 |
|
231 |
|
|
|
|
|
|
|
|
|
|
|
|
|
||
22,500 |
|
2,415 |
|
|
|
9,600 |
|
453 |
|
|
|
20,500 |
|
2,577 |
393 |
RUBmn |
9,652 |
137 |
460 |
||||
|
|
||||||||||
22,000 |
|
|
|
|
|
|
|
|
|
|
|
21,500 |
|
|
|
|
|
9,400 |
|
|
|
|
|
21,000 |
|
|
|
|
|
9,200 |
|
|
|
|
|
20,000 |
20,748 |
|
|
20,979 |
|
9,000 |
|
|
|
|
9,105 |
|
|
|
8,800 |
|
|
|
|
||||
|
|
|
|
|
|
|
|
|
|
|
|
19,500 |
|
|
|
|
|
|
|
|
|
|
|
19,000 |
|
|
|
|
|
8,600 |
|
|
|
|
|
Adj |
Revenue Costs |
Other |
Adj |
Net |
Adj |
Net fin |
Tax |
Other |
Net |
EBITDA |
|
|
EBITDA |
income |
EBITDA |
exp |
|
|
income |
2018F |
|
|
2019F |
2018F |
|
|
|
|
2019F |
Source: Company data, VTB Capital Research |
|
Source: Company data, VTB Capital Research |
2020F could depict a slightly more positive meaningful improvement, with 7% YoY adjusted EBITDA growth; however, we forecast that the company’s active deleveraging will lead to higher upside on net income, with a 13% YoY increase to RUB 10,322mn. At the same time, even with this bottom line improvement, the dividend yield might stand at 7.5%, along with 24% FCF yield and an 11% FCFE yield.
9 November 2018 |
5 |

vk.com/id446425943 |
TGK-1 |
|
Russia |
|
|
Electric Utilities |
|
|
Figure 11: TGK1 2020F Adj EBITDA outlook |
Figure 12: TGK1 2020F net income outlook |
|
RUBmn
25,000 |
|
|
|
|
|
|
12,000 |
|
|
|
|
|
|
|
24,000 |
|
|
|
|
|
|
11,000 |
|
|
362 |
304 |
287 |
|
|
20,979 |
3,494 |
2,357 |
310 |
22,426 |
RUBmn |
5,000 |
9,105 |
1,446 |
10,322 |
|||||
|
||||||||||||||
|
|
|
|
|
|
|
10,000 |
|
|
|
|
|
|
|
23,000 |
|
|
|
|
|
|
9,000 |
|
|
|
|
|
|
|
|
|
|
|
|
|
|
|
|
|
|
|
|
||
22,000 |
|
|
|
|
|
|
8,000 |
|
|
|
|
|
|
|
21,000 |
|
|
|
|
|
|
7,000 |
|
|
|
|
|
|
|
|
|
|
|
|
|
|
|
|
|
|
|
|
||
|
|
|
|
|
|
|
6,000 |
|
|
|
|
|
|
|
20,000 |
|
|
|
|
|
|
|
|
|
|
|
|
|
|
19,000 |
|
|
|
|
|
|
4,000 |
|
|
|
|
|
|
Adj |
Revenue Costs |
Other |
Adj |
Net |
Adj |
Net fin |
Tax |
Other |
Net |
EBITDA |
|
|
EBITDA |
income |
EBITDA |
exp |
|
|
income |
2019F |
|
|
2020F |
2019F |
|
|
|
|
2020F |
Source: Company data, VTB Capital Research |
|
Source: Company data, VTB Capital Research |
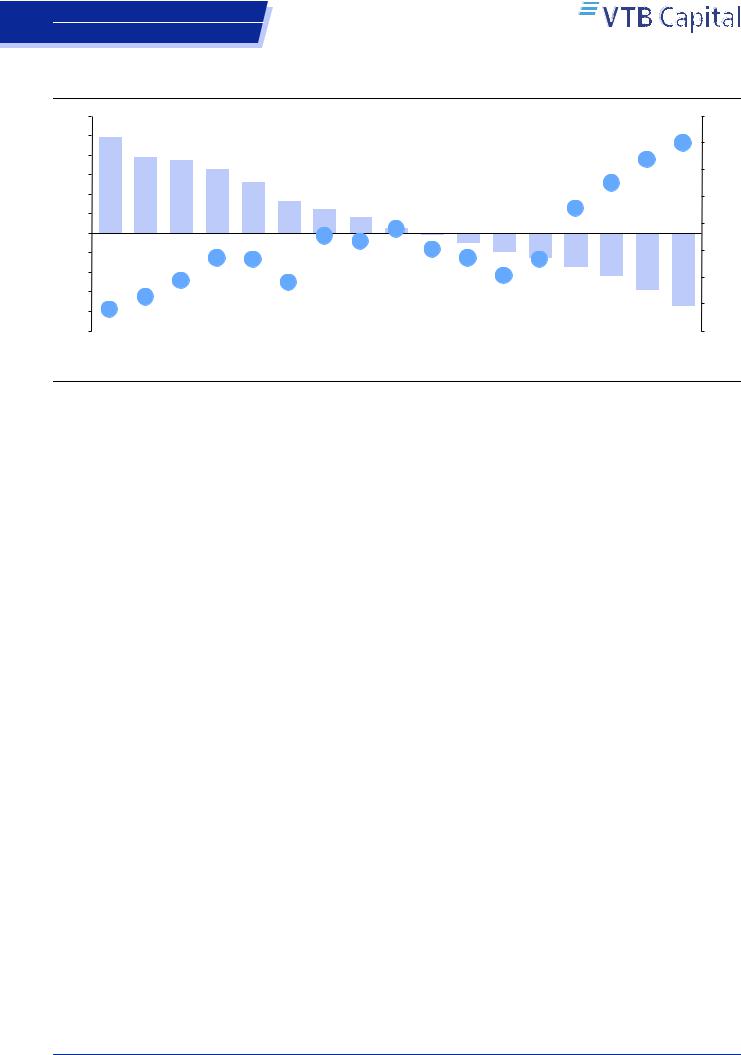
Long-term drivers
In the longer-term, we estimate that TGK1 requires far less modernisation capex (RUB 31.4bn for 918MW of capacity) due to the limited amount of its capacity that could qualify for DPM-2. Taking into account that the company’s DPM-1 is set to start to phase out only from 2021F, TGK1 is much more well positioned to overcame any financing hardships. Thus, first company’s DPMs would reduce to RUB 10bn, then RUB 7bn in 2022F and reach RUB 3-4bn in the next six years. At the same time, the maximum DPM-2 contribution could be RUB 4,980mn, representing 20% of EBITDA, compared to the maximum DPM contribution being almost twofold higher.
Figure 13: TGK1 adj EBITDA outlook
RUBmn
30,000 |
|
|
|
|
|
|
|
|
|
|
|
|
|
|
|
|
|
|
|
|
|
25,000 |
|
|
|
|
|
|
|
|
|
|
|
|
|
|
|
|
|
|
|
|
|
|
|
|
|
|
|
|
|
|
|
|
|
|
|
|
|
|
|
4,150 |
|
4,980 |
4,980 |
20,000 |
|
|
|
|
|
|
|
|
|
|
|
|
|
|
|
|
|
|
|
||
|
|
|
|
|
|
|
|
|
830 |
|
|
|
3,320 |
|
|
|
|
||||
|
|
|
|
|
|
|
|
|
|
|
|
2,490 |
|
4,010 |
|
3,761 |
3,337 |
||||
15,000 |
|
|
|
|
|
|
14,109 |
|
|
|
1,660 |
|
|
|
|
|
|
||||
|
12,918 |
12,719 |
|
|
10,112 |
7,396 |
|
3,901 |
|
|
|
|
|||||||||
|
14,141 |
|
3,796 |
|
|
|
|
|
|||||||||||||
9,249 |
|
|
3,521 |
|
|
|
|
|
|||||||||||||
|
|
|
|
|
|
|
|
|
|
|
|
|
|
|
|
|
|
|
|||
10,000 |
|
|
|
|
|
|
|
|
|
|
|
|
|
|
|
|
|
|
|
|
16,304 |
|
|
|
|
|
|
|
|
|
|
|
|
|
|
13,006 |
14,060 |
|
15,178 |
||||
|
|
|
|
|
|
|
|
|
|
|
11,162 |
12,060 |
|
|
|||||||
5,000 |
|
|
|
|
|
|
|
|
|
10,362 |
|
|
|
||||||||
8,640 |
8,073 |
8,030 |
|
8,317 |
|
9,634 |
|
|
|
|
|||||||||||
6,838 |
|
|
|
|
|
|
|
|
|
|
|
|
|||||||||
|
|
|
|
|
|
|
|
|
|
|
|
|
|
|
|
|
|
|
|
|
|
- |
|
|
|
|
|
|
|
|
|
|
|
|
|
|
|
|
|
|
|
|
|
|
|
|
|
|
|
|
|
|
|
|
|
|
|
|
|
|
|
|
|
|
|
2016 |
2017 |
2018F |
2019F |
2020F |
2021F |
2022F |
|
2023F |
2024F |
2025F |
|
2026F |
2027F |
2028F |
|||||||
|
|
|
|||||||||||||||||||
|
|
|
Adj EBITDA without modernisation and DPM |
|
|
|
DPM |
|
|
|
|
Modernisation |
|
|
|||||||
|
|
|
|
|
|
|
|
|
|
|
|
||||||||||
Source: Company data, VTB Capital Research
Thus, in contrast to Mosenergo (another subsidiary of Gazprom Energoholding), TGK1 does not require any borrowing for modernisation and, on our estimates, along a step by step debt reduction path, TGK1 could reach -0.1x net debt/EBITDA by 2021F at a 25% dividend payout only, despite the company’s hefty 21% FCFF yield. The dividend yields throughout the investment cycle could stand at 4% to 8%, with meaningful growth only in 2026F when, at 25% TGK1, could start to deliver doubledigit 11%+ dividend yields. Moreover, we see sufficient room for dividend upside on back of a higher payout, but refrain from making it the base case, considering the reluctance of the controlling shareholder to significantly step up dividend payments.
9 November 2018 |
6 |
vk.com/id446425943 |
TGK-1 |
Russia |
|
Electric Utilities |
|
Figure 14: TGK1 dividend yield vs. leverage
x
3.0 |
2.5 |
|
|
|
|
|
|
|
|
|
|
|
|
|
|
|
|
16% |
2.5 |
|
|
|
|
|
|
|
|
|
|
|
|
|
|
|
|
|
|
|
|
|
|
|
|
|
|
|
|
|
|
|
|
|
|
14% |
14% |
|
2.0 |
|
2.0 |
1.9 |
|
|
|
|
|
|
|
|
|
|
|
|
|
||
|
1.7 |
|
|
|
|
|
|
|
|
|
|
|
13% |
|
|
|||
|
|
|
|
|
|
|
|
|
|
|
|
|
|
|
|
|||
|
|
|
|
1.3 |
|
|
|
|
|
|
|
|
|
|
|
12% |
||
1.5 |
|
|
|
|
|
|
|
|
|
|
|
|
|
|
|
|
||
|
|
|
|
|
|
|
|
|
|
|
|
|
11% |
|
|
|
||
1.0 |
|
|
|
|
|
0.8 |
|
|
|
|
|
|
|
|
|
|
10% |
|
|
|
|
|
|
0.6 |
0.4 |
0.1 |
|
|
|
|
9% |
|
|
|
|||
0.5 |
|
|
|
|
|
|
|
|
|
|
|
|
|
|
||||
|
|
|
|
|
|
|
|
|
|
|
|
|
|
8% % |
||||
|
|
|
|
|
|
|
|
|
-0.1 |
|
|
|
|
|
|
|
||
0.0 |
|
|
|
|
|
|
|
|
8% |
|
|
|
|
|
|
|
||
|
|
|
|
|
|
|
|
|
|
|
|
|
|
|
|
|
||
|
|
|
|
|
|
7% |
7% |
6% |
-0.3 |
-0.5 |
-0.7 |
|
|
|
|
|
||
|
|
|
|
|
|
|
|
|
|
|
|
|
||||||
-0.5 |
|
|
|
|
|
|
|
|
|
|
|
|
6% |
|||||
|
|
|
5% |
5% |
|
|
|
|
5% |
|
5% |
|
|
|
|
|||
-1.0 |
|
|
|
|
|
|
|
|
|
|
|
|
|
|
||||
|
|
4% |
|
|
4% |
|
|
|
|
|
4% |
|
-0.9 |
-1.1 |
|
|
4% |
|
|
|
|
|
|
|
|
|
|
|
|
|
|
||||||
-1.5 |
|
3% |
|
|
|
|
|
|
|
|
|
|
|
|
|
|||
|
|
|
|
|
|
|
|
|
|
|
|
|
|
-1.5 |
|
2% |
||
-2.0 2% |
|
|
|
|
|
|
|
|
|
|
|
|
|
|
||||
|
|
|
|
|
|
|
|
|
|
|
|
|
|
|
-1.9 |
|||
|
|
|
|
|
|
|
|
|
|
|
|
|
|
|
|
|||
|
|
|
|
|
|
|
|
|
|
|
|
|
|
|
|
|
|
|
-2.5 |
2012 |
2013 |
2014 |
2015 |
2016 |
2017 |
2018F |
2019F |
2020F |
2021F |
2022F |
2023F |
2024F |
2025F |
2026F |
2027F |
2028F |
0% |
|
|
|||||||||||||||||

 Net debt/EBITDA, lhs
  Dividend yield, rhs
Source: Company data, VTB Capital Research
Forecast changes
We update our model for operating data, along with financials, incorporate new economic forecasts and roll our model forward into 2019F, deriving the following updated forecasts and maintain our 12-months target price of RUB 0.013.
Figure 15: TGK1 forecast changes
RUB mn |
2017 |
2018F |
2019F |
2020F |
2021F |
2022F |
2023F |
2024F |
2025F |
2026F |
2027F |
2028F |
New forecast |
|
|
|
|
|
|
|
|
|
|
|
|
Revenues |
87,395 |
89,668 |
92,083 |
95,577 |
94,742 |
95,800 |
95,900 |
100,467 |
104,999 |
109,674 |
114,136 |
117,671 |
Adj. EBITDA |
20,992 |
20,748 |
20,979 |
22,426 |
19,746 |
18,589 |
16,344 |
18,346 |
20,227 |
22,221 |
23,919 |
24,621 |
Net income |
7,927 |
9,652 |
9,105 |
10,322 |
8,263 |
7,388 |
5,610 |
7,252 |
8,897 |
10,712 |
12,437 |
13,644 |
Previous forecast |
|
|
|
|
|
|
|
|
|
|
|
|
Revenues |
87,395 |
90,110 |
92,302 |
96,012 |
96,090 |
97,311 |
97,353 |
101,672 |
105,954 |
110,378 |
114,274 |
|
Adj. EBITDA |
20,992 |
21,547 |
21,680 |
22,917 |
20,579 |
19,368 |
17,016 |
18,770 |
20,398 |
22,142 |
23,282 |
|
Net income |
7,927 |
9,553 |
9,698 |
10,832 |
9,126 |
8,295 |
6,517 |
8,042 |
9,557 |
11,235 |
12,593 |
|
Change, % |
|
|
|
|
|
|
|
|
|
|
|
|
Revenues |
0% |
0% |
0% |
0% |
-1% |
-2% |
-1% |
-1% |
-1% |
-1% |
0% |
|
Adj. EBITDA |
0% |
-4% |
-3% |
-2% |
-4% |
-4% |
-4% |
-2% |
-1% |
0% |
3% |
|
Net income |
0% |
1% |
-6% |
-5% |
-9% |
-11% |
-14% |
-10% |
-7% |
-5% |
-1% |
|
Source: Company data, VTB Capital Research
9 November 2018 |
7 |