

vk.com/id446425943
Kazakhstan – KCELL
Renaissance Capital
8 January 2019
EMEA telecoms
Kazakhstan’s mobile market backdrop remains bleak – a slow-growing customer base due to high penetration, tough competition and unfavourable regulation (i.e. the termination of pay-as-you-go data charges in 2Q18) continued putting pressure on revenues, while growth is mainly driven by higher handset sales negatively affecting margins. There were four mobile operators in the market (Tele2 and Altel operate under separate brands) in 3Q18 but after the acquisition of KCELL by Kazakhtelecom, the latter became the main force in the market in 2019.
Figure 43: Telecom market structure in Kazakhstan in 2017 |
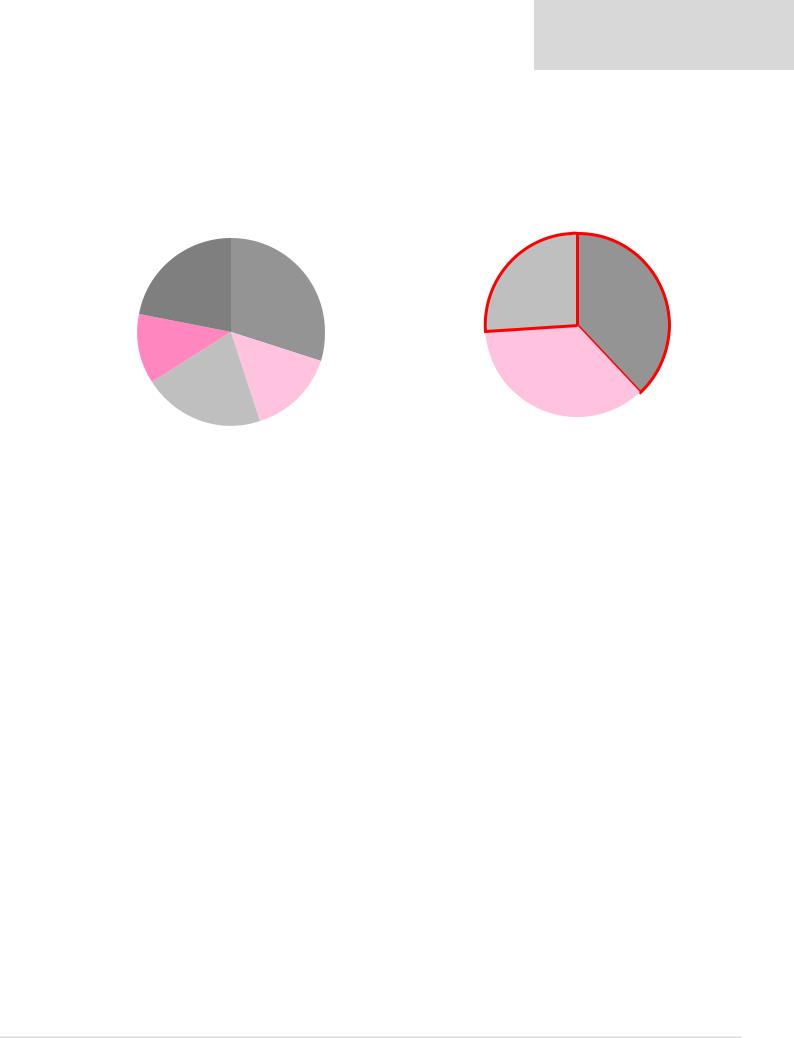
Figure 44: Mobile market structure in Kazakhstan in 2017 |
Other
22%
Kazakhtelecom
30%
Beeline
12%
Altel/Tele2 JV
15%
Kcell
21%
Altel/Tele2 |
Kcell |
|
38% |
||
JV* |
||
|
||
26% |
|
Beeline
36%
Note: *Kazakhtelecom owns 51%/49% of the economic interest/voting shares in Altel/Tele2 JV with a call option to consolidate 100% effective in 2019
Source: Company data
Kazakhtelecom has closed the deal and purchased a 75% stake in KCELL (24% owned directly by Telia and 51% owned by Fintur, in which TCELL owned a 41.45% stake and Telia a 58.55% stake) for $446mn, with an implied EV of $771mn for 100% on a cash and debt free basis.
Kazakhtelecom did not make a mandatory tender offer for minorities, as, according to local law, entities in which the state has more than 50% (and the sovereign wealth fund Samruk-Kazyna owns 51% in Kazakhtelecom) are exempt from MTO procedures.
The regulator has committed to the implementation of a number of remedies for the deal’s approval: 1) to keep flat tariffs over the three-year period after the deal’s close; 2) to retain existing infrastructure sharing agreements with other operators (e.g. network sharing with VEON’s Beeline); 3) to roll out 4G in rural areas with a population above 4k; 4) to implement 5G standards no later than 2021; 5) to retain the KCELL and Activ brands with an independent management in the mobile operator.
We adjust our forecasts for down KCELL, reduce our TP to $3/ADR (from $3.3) and downgrade the stock to SELL from Hold as we see higher risks to its business from Kazakhtelecom ownership.
Figure 45: Kcell – old estimates vs new, KZTmn (unless otherwise stated)
|
Old (January 2017) |
New |
|
Deviation |
||
|
2018E |
2019E |
2018E |
2019E |
2018E |
2019E |
Revenue |
157,581 |
163,864 |
150,718 |
153,146 |
-4.4% |
-6.5% |
EBITDA (excl. non-recurring items) |
66,668 |
71,915 |
54,614 |
56,778 |
-18.1% |
-21.0% |
EBITDA margin |
42.3% |
43.9% |
36.2% |
37.1% |
|
|
Net income |
27,909 |
33,937 |
13,931 |
18,779 |
-50.1% |
-44.7% |
Note: Including. IFRS15 impact
Source: Renaissance Capital estimates

vk.com/id446425943
Renaissance Capital
8 January 2019
EMEA telecoms
Figure 46: Kcell key financials, KZTmn (unless otherwise stated)
Income statement |
2017 |
2018E |
2019E |
2020E |
Sales |
147,475 |
150,718 |
153,146 |
154,975 |
Costs ex. D&A |
(89,828) |
(96,104) |
(96,367) |
(96,987) |
EBITDA (excl. non-recurring items) |
57,647 |
54,614 |
56,778 |
57,988 |
EBITDA margin, % |
39.1% |
36.2% |
37.1% |
37.4% |
PBIT |
31,827 |
26,343 |
31,897 |
32,299 |
Net interest |
(9,419) |
(8,483) |
(7,821) |
(7,109) |
PBT |
22,408 |
17,860 |
24,075 |
25,190 |
Tax rate |
39% |
22% |
22% |
22% |
PAT |
13,786 |
13,931 |
18,779 |
19,648 |
Shares, mn |
200 |
200 |
200 |
200 |
ADR, mn |
200 |
200 |
200 |
200 |
EPS, KZT |
69 |
70 |
94 |
98 |
DPS, KZT |
58 |
56 |
66 |
69 |
Balance sheet |
2017 |
2018E |
2019E |
2020E |
Non-current assets |
138,217 |
133,056 |
137,373 |
141,138 |
Current assets |
28,973 |
33,158 |
32,467 |
32,855 |
Monetary assets |
12,659 |
11,231 |
11,793 |
11,761 |
Total assets |
179,849 |
177,445 |
181,633 |
185,754 |
Current liabilities |
28,823 |
21,165 |
20,719 |
21,337 |
Indebtedness |
70,418 |
73,418 |
70,418 |
67,418 |
Other |
6,172 |
6,172 |
6,172 |
6,172 |
Equity |
74,437 |
76,690 |
84,324 |
90,827 |
Total liabilities & shareholders' equity |
179,849 |
177,445 |
181,633 |
185,754 |
Net debt |
57,758 |
62,187 |
58,624 |
55,656 |
Cash flow |
2017 |
2018E |
2019E |
2020E |
Net income attributable to parent |
13,786 |
13,931 |
18,779 |
19,648 |
Non-cash items |
23,147 |
26,261 |
24,882 |
25,689 |
Change in working capital |
(17,871) |
(11,843) |
245 |
230 |
Operating cash flow |
33,483 |
28,349 |
43,905 |
45,567 |
Capex |
(22,584) |
(21,101) |
(21,440) |
(21,697) |
Investing cash flow |
(22,584) |
(21,101) |
(29,198) |
(29,454) |
Free cash flow to equity |
10,899 |
7,249 |
14,707 |
16,113 |
Financing cash flow |
(6,678) |
(8,678) |
(14,145) |
(16,145) |
Source: Company data, Renaissance Capital estimates
23