

Standard Chartered - Global Market Outlook_watermark
.pdfvk.com/id446425943Standard Chartered Bank
Global Market Outlook | 2 May 2019
Japan – Trade talks, sales tax hike in focus
Global slowdown dominates outlook. Japan’s exports contracted for the fourth straight month in March. The BoJ’s Tankan Survey also indicated business sentiment was hurt by the external slowdown. The outlook for Japan’s large manufacturers, a barometer of trade conditions, fell sharply, while the outlook for domestic-focussed non-manufacturers remained resilient, highlighting the relatively robust services sector. A trade deal with the US and/or a delay in the planned sales tax hike in October could improve sentiment.
BoJ to stay accommodative. The BoJ’s latest downgrade to its outlook for exports and production suggests the central bank remains concerned about downside risks to growth and inflation. We believe it will maintain its accommodative policy over the next 12 months, despite tight labour markets.
China – Economy responding to stimulus
Nascent upturn. Latest data suggests China’s coordinated policy easing has started to impact the real economy. The acceleration in infrastructure investment growth, for instance, coincided with the pick-up in credit impulse, although a few more months of data may be needed to confirm the upturn. While the stimulus measures are unlikely to match previous cycles (the credit impulse so far is notably smaller than in 2009, 2012 and 2015), the front-loading of stimulus measures may be sufficient to stabilise growth by H2, as stability becomes a key policy priority in the lead-up to the 70th anniversary of the People’s Republic on 1 October.
Sustainable recovery likely. The latest policy easing, including tax cuts and targeted lending initiatives, has been targeted towards the private sector, which are usually more efficient and account for a larger share of employment than state-owned firms. Hence, we believe the latest policy easing may have longer-lasting second-order effects.
Emerging Markets – Outlook brightening
Turning positive. We are more constructive on Emerging Markets (EM) and believe the consensus is underestimating the impact on EM growth from China’s nascent recovery and the dovish shift in global central bank policy. Rate cuts across many EMs are likely, aiding recovery in growth.
Differentiation remains key. We believe Asia is likely to benefit from China’s recovery and easing financial conditions, while markets with structural deficits (Turkey, South Africa) are likely to remain under pressure.
Figure 14
Japan’s manufacturing sector outlook remains under pressure due to trade uncertainty, while services sector holds up
Japan’s Tankan survey indicator of the outlook for manufacturing and nonmanufacturing sector business confidence
|
40 |
|
|
|
|
20 |
|
|
|
Index |
0 |
|
|
|
-20 |
|
|
|
|
|
|
|
|
|
|
-40 |
|
|
|
|
-60 |
|
|
|
|
Jun-04 |
May-09 |
Apr-14 |
Mar-19 |
|
Large enterprises manufacturing |
Large enterprise non-manufacturing |
||
Source: Bloomberg, Standard Chartered
Figure 15
China’s infrastructure investment is showing signs of recovery as authorities revive credit stimulus
China’s infrastructure investment, % y/y 3-month average; credit impulse (y/y change in new credit issued as percentage of GDP)
|
60 |
|
|
|
45 |
|
|
50 |
|
|
|
40 |
|
|
|
|
|
|
|
|
|
40 |
|
|
|
35 |
|
3mma |
|
|
|
30 |
|
|
|
|
|
|
y/y |
||
30 |
|
|
|
25 |
||
|
|
|
|
|
|
|
y/y |
20 |
|
|
|
20 |
% |
|
|
|
|
|||
|
|
|
|
15 |
||
% |
10 |
|
|
|
|
|
|
|
|
|
10 |
|
|
|
|
|
|
|
|
|
|
0 |
|
|
|
5 |
|
|
|
|
|
|
|
|
|
-10 |
|
|
|
0 |
|
|
Apr-06 |
Jul-09 |
Oct-12 |
Jan-16 |
Apr-19 |
|
|
|
Infrastructure investment |
Credit impulse (RHS) |
|
||
Source: Bloomberg, Standard Chartered
Figure 16
EM economic data surprises have turned positive with signs of a recovery in China, while DM data has continued to disappoint
EM and DM economic surprises indices
|
10 |
|
|
|
|
|
0 |
|
|
|
|
|
-10 |
|
|
|
|
Index |
-20 |
|
|
|
|
|
|
|
|
|
|
|
-30 |
|
|
|
|
|
-40 |
|
|
|
|
|
-50 |
|
|
|
|
|
Apr-18 |
Jul-18 |
Oct-18 |
Jan-19 |
Apr-19 |
|
|
EM economic surprises |
|
G10 economic surprises |
|
Source: Bloomberg, Standard Chartered
This reflects the views of the Wealth Management Group |
11 |

vk.com/id446425943Standard Chartered Bank
Global Market Outlook | 2 May 2019
USD – Looking for a move back down
The USD faces several cyclical and structural headwinds. We believe narrowing interest differentials and renewed focus on the US twin deficits will ultimately drive the USD lower. We remain bullish on the EUR as we expect the currency to benefit from positive spillover effects of fiscal and monetary policies from China and other Asian economies. We also continue to like the GBP given its attractive valuations, which is underpinned by our expectation of a
“soft” or no Brexit.
Gold – Lacking catalysts to move higher
Lukewarm investor sentiment weighs on gold. Gold prices have eased as market participants scaled back the probability of a Fed rate cut this year. We expect the Fed to remain on hold this year and we do not expect the economy to tilt into recession. Central bank buying and an improving physical market have slowed the decline.
Range-trading likely in the absence of fresh catalysts.
Unless we see a further compression in real rates or a significant decline in the USD, we believe risks are skewed towards the upside given our expectations of gold trading in the USD 1250-1350/oz range over the next 6-12 months.
Crude Oil – Is this time different?
Supply continues to hog headlines. Demand for oil has remained resilient despite the recent soft patch in the global economy, while concerns around supply (i.e. renewed conflict in Libya) have risen. The timing of the US decision to end all sanction waivers caught most market participants by surprise, driving prices higher. However, we believe the fundamental set-up is significantly different compared to last year, given the visibility on available OPEC spare capacity.
Tug of war between OPEC and US shale continues. The US has continued to increase its oil output although this had been offset by OPEC production cuts. The de-bottlenecking of the Permian on the back of new pipeline and export capacity should boost US shale production. Investor diversity has also been relatively low. Further price gains will unlikely be sustained in our view. Our expectation for oil to trade in the USD 65-75/bbl range remains unchanged.
Figure 17
The allocation of FX reserves has gradually broadened; A sharper focus on US twin deficits could drive the USD lower
DXY, FX holdings in USD (% of total; RHS)
|
130 |
|
|
|
74 |
|
120 |
|
|
|
72 |
DXY |
110 |
|
|
|
70 |
100 |
|
|
|
% |
|
|
|
|
|
68 |
|
|
90 |
|
|
|
66 |
|
80 |
|
|
|
64 |
|
70 |
|
|
|
62 |
|
60 |
|
|
|
60 |
|
Jan-00 |
Nov-04 |
Sep-09 |
Jul-14 |
May-19 |
|
|
DXY |
FX holdings in USD (% of total, RHS) |
||
Source: Bloomberg, Standard Chartered
Figure 18
Central bank buying has remained robust
Central Bank demand (tonnes)
|
700 |
|
600 |
Tonnes |
500 |
300 |
|
|
400 |
|
200 |
|
100 |
|
0 |
2010 |
2011 |
2012 |
2013 |
2014 |
2015 |
2016 |
2017 |
2018 |
|
|
|
|
|
|
|
|
|
Source: World Gold Council, Standard Chartered
Figure 19
There is greater visibility on spare capacity, despite recent supply disruptions
Estimated Saudi Arabia spare capacity (mbd)
|
3.5 |
|
|
|
|
|
3.0 |
|
|
|
|
|
2.5 |
|
|
|
|
mbd |
2.0 |
|
|
|
|
1.5 |
|
|
|
|
|
|
|
|
|
|
|
|
1.0 |
|
|
|
|
|
0.5 |
|
|
|
|
|
0.0 |
|
|
|
|
|
Jan-00 |
Nov-04 |
Sep-09 |
Jul-14 |
May-19 |
Source: Bloomberg, Standard Chartered
This reflects the views of the Wealth Management Group |
12 |
vk.com/id446425943Standard Chartered Bank
Global Market Outlook | 2 May 2019
8 Bonds
Preference for EM bonds
•We retain bonds as a core holding and view them as an important source of income and diversification in an investment allocation.
•A pick-up in Emerging Market (EM) growth, largely range-bound US Treasury yields and relatively attractive yields should help EM bonds outperform global bonds. We believe EM USD government bonds have the highest likelihood of outperforming global bonds, closely followed by Asian USD bonds; both are preferred.
•A Fed pause and an accommodative ECB stance should reduce the risk of a sharp increase in government bond yields. We believe US 10-year Treasury yields will remain within a 2.50-2.75% range over the next 12 months. However, the low yield on offer leads us to view Developed Market (DM) Investment Grade (IG) government bonds as most likely to underperform global bonds.
Figure 20
Bond sub-asset classes in order of preference
Bond asset |
|
Rates |
Macro |
Valua- |
|
|
|
class |
View |
policy |
factors |
tions |
FX |
Comments |
|
EM USD |
▲ |
● ● |
|
Attractive yields, relative value and |
|||
NA fund inflows are positive; high |
|||||||
government |
|||||||
|
|
|
|
|
|
interest rate sensitivity a risk |
|
Asian USD |
|
▲ |
|
● |
|
NA |
High credit quality, low volatility. |
|
|
Influenced by China risk sentiment |
|||||||
|
||||||||
|
|
|
||||||
EM local |
|
|
|
|
|
|
Attractive yield, more supportive |
|
|
● |
● ●EM central bank policy; FX volatility |
||||||
currency |
|
|||||||
|
|
|
|
|
|
|
a risk |
|
|
|
|
|
|
|
|
|
|
DM HY |
|
|
|
|
|
● |
Attractive yield, short maturity |
|
|
profile; risk of decline in credit |
|||||||
corporate |
|
|||||||
|
fundamentals |
|||||||
|
|
|
|
|
|
|
||
DM IG |
|
|
|
|
|
|
Moderate yield, yield premium on |
|
|
|
offer; credit quality deterioration a |
||||||
corporate |
|
|||||||
|
|
|
|
|
|
|
risk |
|
DM IG |
|
|
|
|
|
|
Relatively low yield; easier |
|
|
▼ |
|
NA monetary policy; upside inflation |
|||||
government |
|
|||||||
|
|
|
|
|
|
|
surprise is a risk. Hedge FX risk |
|
|
||||||||
Source: Standard Chartered Global Investment Committee |
||||||||
Legend: ●Supportive Neutral○Not Supportive ▲Preferred ▼Less Preferred Core Holding |
||||||||
Stronger data nudges yields higher
Global bond yields rebounded in April as stronger economic data led markets to reduce their expectations for a rate cut by Fed in 2019 and the yield curve (difference between 10-year and 3-month Treasury yields) reverted to positive territory. However, short of a sustained increase in US long-term inflation expectations, we expect US 10-year Treasury yield to remain largely rangebound.
IMPLICATIONS
FOR INVESTORS
EM USD government bonds are most likely to outperform global bonds
Upgrade Asian USD bonds to a preferred holding following constructive data in China
Reduce DM IG government bonds to less preferred owing to low absolute yield
Figure 21 |
|
|
|
Where markets are today |
|
||
|
|
|
|
|
|
1m |
|
Bonds |
Yield |
return# |
|
DM IG |
|
|
|
government |
1.36%* |
-1.3% |
|
(unhedged) |
|
|
|
|
|
|
|
EM USD |
6.07% |
0.3% |
|
government |
|||
|
|
||
|
|
|
|
DM IG |
|
|
|
corporates |
2.72%* |
0.1% |
|
(unhedged) |
|
|
|
|
|
|
|
DM HY |
6.26% |
0.7% |
|
corporates |
|||
|
|
||
|
|
|
|
Asia USD |
4.42% |
0.5% |
|
|
|
|
|
EM local |
|
|
|
currency |
6.25% |
-1.6% |
|
government |
|
|
|
|
|
|
|
Source: Bloomberg, JPMorgan, Barclays, FTSE, Standard Chartered
# 25 March to 25 April 2019
*As of 31 March 2019
This reflects the views of the Wealth Management Group |
13 |

vk.com/id446425943Standard Chartered Bank
Global Market Outlook | 2 May 2019
9 Equities
Equities – China data reinforces preference for Asian equities
•Global equities remains our preferred asset class. In our assessment, there is a 75% probability that global equities will outperform other asset classes. Optimism over Chinese stimulus measures are contributing to a more constructive view on Asia ex-Japan and other regions leveraged to China, including the Euro area.
•Asia ex-Japan is our preferred market, followed by the US and Euro area. The Global Investment Committee continues to anticipate a weaker USD in 2019, which is bullish for Asia ex-Japan.
•US equities are viewed as a core holding. Investors are continuing to look through weak Q1 earnings, focusing on the potential for a pick-up in economic growth and, in turn, corporate earnings in late 2019 and 2020.
•The Euro area ranks third in order of preference within equity regions. There has been a notable improvement in the outlook for Euro area banks and industrials. This is driven in part by expectations of changes to ECB special bank lending policies and China’s stimulus measures.
•Japan is now least preferred, with only a 20-25% probability of outperforming global equities. UK equities are core.
•Risks to our equity views: tightening in US monetary policy, weakening Chinese growth and significant USD strength.
Figure 22
Equity
Asia ex-Japan
US
Euro area
EM ex-Asia
UK
Japan
|
|
|
Return |
Economic |
Bond |
|
View |
Valuations |
Earnings |
on equity |
data |
yields |
Comments |
|
|
|
|
|
|
|
▲ ○ ●
 ● ●
● ●
●

● ○ ●
 ▼ ● ● ●
Fair valuations, signs of better earnings outlook as China prioritises growth.
Earnings recession is a risk,
but investors are looking to 2020 recovery.
ECB changes to rates paid on bank excess reserves is a potential positive.
Fair valuations with catalyst from higher commodity prices and easing trade tensions.
Likelihood of soft Brexit is driving market re-rating. Valuations attractive.
Valuations attractive. Returns to shareholders structurally rising.
Source: Standard Chartered
Legend: ●Supportive Neutral○Not Supportive ▲Preferred ▼Less Preferred Core Holding
IMPLICATIONS
FOR INVESTORS
Global equities are the preferred asset class, with a preference for Asia ex-Japan
Asia ex-Japan is preferred, while US, Euro area, Non Asia EM and UK are core holdings. Japan is least preferred
Prefer China (onshore and offshore) within Asia ex-Japan
Figure 23 |
|
|
|
Where markets are today |
|
||
|
|
|
|
Market |
|
Index |
|
P/E ratio |
P/B |
EPS |
level |
US (S&P 500) |
|
|
|
17x |
3.2x |
6% |
2,926 |
|
|
||
Euro area (Stoxx 50) |
|
||
13x |
1.5x |
9% |
3,492 |
|
|
|
|
Japan (Nikkei 225) |
|
|
|
13x |
1.1x |
2% |
22,308 |
|
|
|
|
UK (FTSE 100) |
|
|
|
13x |
1.7x |
5% |
7,434 |
|
|
||
MSCI Asia ex-Japan |
|
||
13x |
1.5x |
7% |
673 |
|
|
|
|
MSCI EM ex-Asia |
|
|
|
11x |
1.5x |
9% |
1,418 |
|
|
|
|
Source: FactSet, MSCI, Standard Chartered. Note: valuation and earnings data refer to 12-month forward data for MSCI indices, as of 25 April 2019
This reflects the views of the Wealth Management Group |
14 |
vk.com/id446425943Standard Chartered Bank
Global Market Outlook | 2 May 2019
Asia ex-Japan equities – Preferred holding
Asia ex-Japan equities are a preferred holding and are most likely to outperform global equities over the coming 6-12 months, in USD terms, in our assessment.
This view is underpinned by expected USD weakness, which could lead to fund inflows to the region, as well as nascent signs of a recovery in corporate earnings’ expectations.
The consensus 12-month forward EPS growth forecast of 8% looks achievable assuming that a US-China trade resolution in H2 helps trade and investment flows pick up. Meanwhile, the easing of fiscal and credit policy in China could help Asia ex-Japan’s earnings to bottom out.
Although the 12-month ahead price-earnings ratio – currently at 14x – is in line with the long-term average valuation, we believe a recovery in earnings momentum could be a catalyst, driving the performance of Asia ex-Japan equities ahead.
Risks to our preferred view include: escalation in US-China trade tensions, a slowdown in the global economy and fund outflows, potentially on the back of significant USD strength. From current valuations, history since 2005 suggests a 76% probability of positive returns in the coming 12 months.
China is a preferred market within Asia ex-Japan. The rebound in Q1 economic data reassures investors that fiscal stimulus measures and credit easing policies have been effective in boosting the economy. Meanwhile, the rising foreign investment in Chinese equities brought about by the gradual opening up of capital markets is constructive for fund inflows.
Figure 24
Earnings growth for Asia ex-Japan has started to recover
MSCI Asia ex-Japan’s earnings growth estimate for 12-month
|
40 |
|
|
|
(%) |
30 |
|
|
|
20 |
|
|
|
|
EPSg |
|
|
|
|
10 |
|
|
|
|
fwd |
|
|
|
|
0 |
|
|
|
|
12m |
|
|
|
|
|
|
|
|
|
|
-10 |
|
|
|
|
-20 |
|
|
|
|
Jan-02 |
Oct-07 |
Jul-13 |
Apr-19 |
|
|
|
Mean |
|
Source: FactSet, MSCI, Standard Chartered
This reflects the views of the Wealth Management Group |
15 |

vk.com/id446425943Standard Chartered Bank
Global Market Outlook | 2 May 2019
12 FX
USD to peak as rate differentials narrow
•The ECB and the BoJ have little room to lower rates. Reduced rate differentials should ultimately weigh on the USD
•We expect the USD to break lower once the current period of sideways trading and falling volatility ends. US trade talks with China, Japan and EU are a key risk
•China economic stimulus could support AUD and EUR if trade flows improve. We expect USD/INR to fall on investment inflows post-election
Figure 25
Foreign exchange: key driving factors and outlook
|
|
|
|
Real |
|
|
|
|
|
|
|
|
interest |
|
|
Broad |
|
|
3m |
12m |
|
rate |
Risk |
Commodity |
USD |
|
Currency |
View |
View |
|
differentials |
sentiment |
prices |
strength |
Comments |
|
|
|
|
|
|
|
|
|
USD |
▼ |
▼ |
|
○ |
|
|
|
Growth and rate |
|
NA |
NA differentials to narrow |
||||||
|
|
|||||||
EUR |
|
▲ |
|
● |
|
NA |
● |
Growth to bottom; |
|
rates cannot fall far |
|||||||
|
|
|
||||||
|
|
|
|
|
|
|
|
No BoJ policy shift; |
JPY |
|
|
|
|
|
NA |
●new fiscal stimulus |
|
|
|
|||||||
|
|
|
|
|
|
|
|
|
GBP |
▲ |
▲ |
|
|
● |
NA |
● |
Brexit risk fades; |
|
undervalued |
|||||||
|
|
|
||||||
|
|
|
|
|
|
|
|
Support from China; |
AUD |
|
|
|
○ |
|
|
●better terms of trade |
|
|
||||||||
|
|
|
|
○ |
● |
|
● |
Stimulus and data |
CNY |
|
support; trade deal |
||||||
|
|
dependency |
||||||
|
|
|
|
|
|
|
|
|
|
|
|
|
|
|
|
|
|
Source: Bloomberg, Standard Chartered Global Investment Committee
Legend: ●Supportive Neutral○Not Supportive ▲Bullish ▼Bearish Range
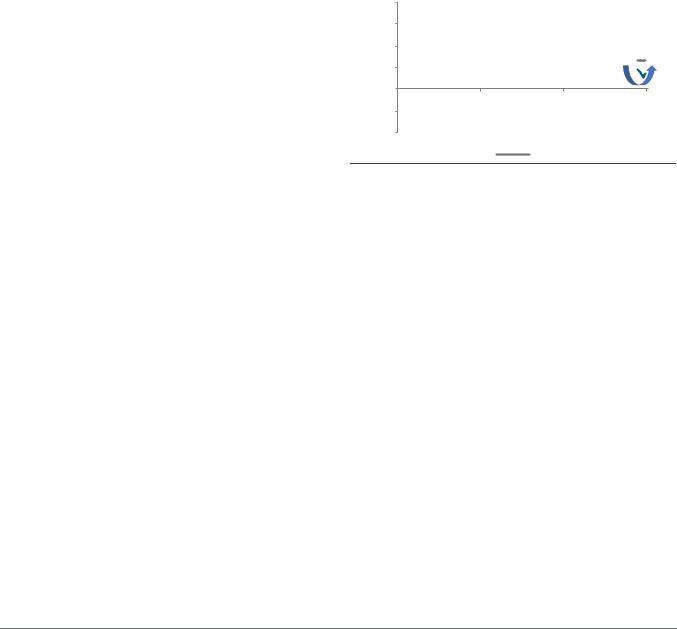
USD – Sideways trading and low volatility augur a breakout
As cyclical and structural factors generate increasing headwinds and the USD uptrend loses momentum, we expect the USD to break lower in the near term and begin a medium-term downtrend. We believe China, Japan and EM will deliver fiscal stimulus that could help re-synchronise global growth and allow interest rate differentials to narrow. Capital flows could also shift away from the US. We also await the outcome of bilateral US trade talks with China, Japan and the EU for currency agreements that could limit USD gains. Combined with a gradual diversification in FX reserves allocation and sharper focus on the US twin deficits, the USD is likely peaking now. The USD (DXY) index has strong resistance near 98.00. A break of the previous low at 95.74 and key 95.00 support would increase confidence that a downtrend towards 92.00 is developing. After recent tight ranges, this move could accelerate.
IMPLICATIONS
FOR INVESTORS
We believe the USD uptrend is fading. A rise in volatility and a breakout from recent tight trading ranges could signal the start of a USD decline
The EUR is likely to strengthen amid USD weakness and a stabilising economy
The GBP is likely to strengthen as a ‘hard Brexit’ is avoided and valuations remain inexpensive
Figure 26
Where markets are today
|
Current |
1m |
FX (against USD) |
level |
change# |
Asia ex-Japan |
105.59 |
-0.9% |
|
|
|
AUD |
0.70 |
-1.4% |
|
|
|
EUR |
1.11 |
-1.6% |
|
|
|
GBP |
1.29 |
-2.2% |
|
|
|
JPY |
111.63 |
1.5% |
|
|
|
SGD |
1.36 |
1.0% |
|
|
|
Source: Bloomberg, Standard Chartered
# 25 March to 25 April 2019
This reflects the views of the Wealth Management Group |
16 |
vk.com/id446425943Standard Chartered Bank
Global Market Outlook | 2 May 2019
EUR – Global stimulus expected to drive rally
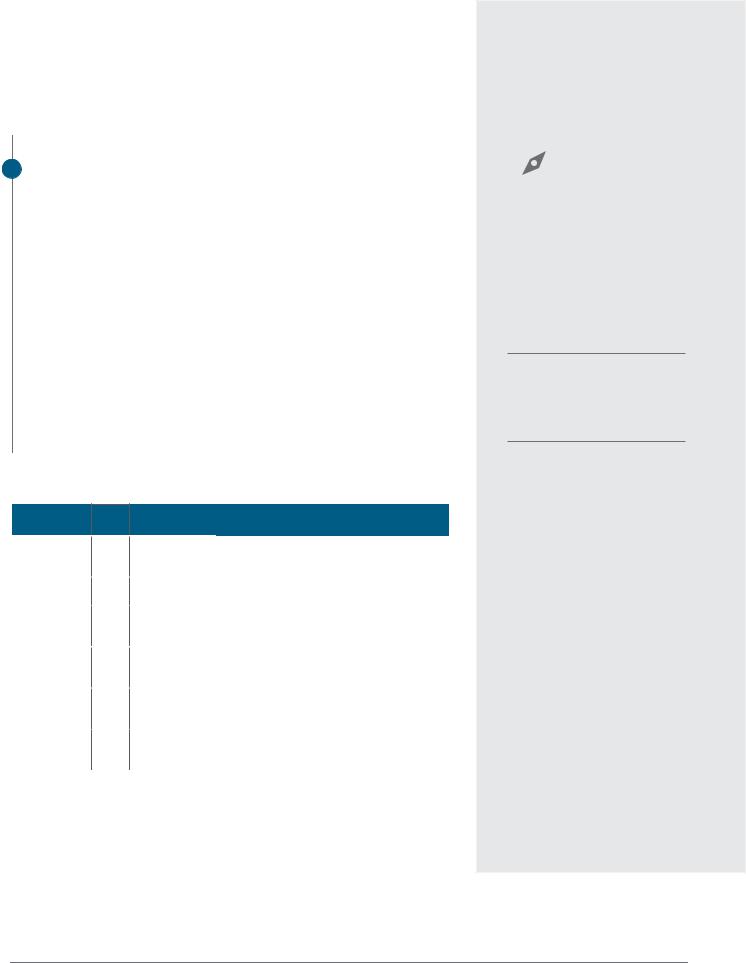
We are bullish on EUR/USD in the medium term despite current weak European growth and inflation data. Ongoing policy uncertainty resulting from Brexit, US-EU trade issues and forthcoming EU elections continue to weigh on the EUR. However, we believe that as China and Asian economies recover on the back of fiscal and monetary stimulus, sentiment towards the Euro area will become less pessimistic as the economy stabilises. If the USD loses its upward traction, EUR/USD, almost by necessity, would finally turn higher. Once the bottoming process is widely accepted, EUR/USD could gain momentum from narrowing interest rate differentials and increasing capital inflows.
EUR/USD volatility has fallen to very low levels as the sideways trading range endures. A break of 1.1450 – 1.15 resistance would add confidence to our bullish view, and that a medium-term EUR/USD rally towards 1.1700 and 1.1865 is under way. A break below 1.1170 could trigger a decline to the 1.0850 – 1.10 support area before the current downtrend is complete.
JPY – Trade talks and hedging costs are key
We expect USD/JPY to be range-bound and subject to twoway risk. Key drivers are likely to be centred around trade talks with the US and the visit of President Trump in late May, as well as the decisions of institutional investors regarding hedging foreign, particularly USD, assets. High costs have recently supported USD/JPY as Japanese investors have preferred not to hedge. Any trade agreement that includes a USD-capping currency accord could trigger USD/JPY weakness. Near-term levels to watch for a break of trading range are 109.70 and 114.60. A break lower opens the risk of a 105 test.
GBP – Bullish GBP despite deadline delay
We remain bullish on the GBP as we expect a “soft” or no
Brexit, following the recent deadline delay to 31 October. UK political negotiations are likely to centre around a common market or customs union, with a growing chance of a confirmatory referendum. The GBP is very undervalued and we expect that Brexit resolution and interest rate normalisation will drive the GBP strength in the nearand medium-term. We expect GBP/USD to find immediate support around 1.29 or risk re-testing the 1.2430 January low. A break of 1.34 would suggest a rally to reclaim the 1.4375 high of 2018 is underway.
Figure 27
Major currency drivers – what has changed
Factor |
Recent moves |
Real interest |
Narrowing differentials as the Fed holds; |
rate differentials |
global interest rates have less room to fall |
|
|
Risk sentiment |
Current low volatility, diverse views and tight |
|
trading ranges likely to end with a sharp move |
Speculator |
Net positions are moderately long USD; asset |
positioning |
managers are short and hedge funds are long |
Source: Bloomberg, Refinitiv, Standard Chartered
Figure 28
Sideways trading and falling volatility suggest breakout soon
DXY Index vs. Deutsche Bank FX volatility index (RHS)
14 |
|
|
105 |
|
12 |
|
|
100 |
|
|
|
|
|
|
10 |
|
|
|
Index |
% |
|
|
95 |
|
|
|
|
|
|
8 |
|
|
|
|
6 |
|
|
90 |
|
|
|
|
|
|
4 |
|
|
85 |
|
Jan-15 |
Jun-16 |
Nov-17 |
Apr-19 |
|
|
Deutsche Bank FX Volatility Index |
DXY (RHS) |
|
|
Source: Bloomberg, Deutsche Bank, Standard Chartered
Figure 29
EUR to rally medium term as EU economic data recovers
EUR/USD vs. EU – US economic surprise indices (RHS)
|
1.30 |
|
|
|
150 |
|
|
1.25 |
|
|
|
100 |
|
EUR/USD |
1.20 |
|
|
|
50 |
Differential |
1.15 |
|
|
|
0 |
||
|
|
|
|
|
||
|
1.10 |
|
|
|
-50 |
|
|
1.05 |
|
|
|
-100 |
|
|
1.00 |
|
|
|
-150 |
|
|
Jan-15 |
Jan-16 |
Jan-17 |
Jan-18 |
Jan-19 |
|
|
|
EU-US spread (RHS) |
|
EUR/USD |
|
|
Source: Bloomberg, Citibank, Standard Chartered
This reflects the views of the Wealth Management Group |
17 |
vk.com/id446425943Standard Chartered Bank
Global Market Outlook | 2 May 2019
AUD – RBA awaits data as exports may boost
We expect AUD/USD to continue trading within a broad 0.6825 – 0.7400 range. The RBA is likely to wait on further house price, household spending and employment data to monitor the weak domestic economic backdrop before taking any interest rate action. Much will also depend upon export growth. Australia’s terms of trade have improved recently, and exports, particularly of LNG to China, have improved. While domestic and international economic drivers remain balanced, we see no obvious catalyst for the current broad range to break.
CNY – Data shows stimulus supports stability
China has continued to provide additional monetary and fiscal support into its slowing economy, and this is visible in recent data releases that indicate the quest for economic stability is succeeding. Currency stability has continued in tandem. Despite a weakening current account balance – and the prospect of a further deterioration should a Sino-US trade agreement be finalised soon – there are few signs of pressure on the capital account. We expect capital flows into China will continue to be supported by recent index inclusion as investors target increased allocations to onshore markets.
USD/CNY movements are likely to be driven by the outcome of trade talks that may have multiple stages. We await the conclusion of the first stage, and specifically any currency statement or accord, that might set the tone for the USD/CNY and broad USD trend in the medium term. The recent tight range between 6.67 and 6.74 has held for two months. Given our bearish medium-term USD view, a positive trade outcome could see a break down to 6.50.
EM FX – Trending stronger; USD/INR may fall
EM currencies are likely to trade in line with our bearish medium-term USD view, although we expect most to trade towards the stronger side of established ranges. We believe USD/INR can move towards 68.25 and 66.85 as the election process concludes. Foreign investment inflows can rise and we see little current account or inflationary pressure weighing on the economy. Higher oil prices are a risk to this view. USD/SGD is likely to remain range-bound following the unchanged MAS decision.
Figure 30
AUD/USD export improvement to offset softer domestic market
AUD/USD vs. Australia Terms of Trade (RHS)
|
1.2 |
|
|
70 |
|
|
1.1 |
|
|
60 |
|
|
|
|
|
|
|
|
1.0 |
|
|
50 |
|
|
|
|
40 |
|
|
AUD/USD |
|
|
|
Index |
|
0.9 |
|
|
10 |
||
|
|
|
|
30 |
|
|
0.8 |
|
|
20 |
|
|
|
|
|
|
|
|
0.7 |
|
|
0 |
|
|
|
|
|
|
|
|
0.6 |
|
|
-10 |
|
|
|
|
|
|
|
|
0.5 |
|
|
-20 |
|
|
Jan-06 |
Jun-10 |
Nov-14 |
Apr-19 |
|
|
|
AUD/USD |
Terms of trade (RHS) |
|
|
Source: Bloomberg, Standard Chartered
Figure 31
What has changed in Emerging Market currencies
Factor |
Recent moves |
|
||
USD |
Narrowing rate and growth differentials expected |
|||
|
|
to weigh on the USD and support break lower |
|
|
China risks |
China fiscal and monetary stimulus supportive; |
|||
|
|
Sino-US trade and currency talks may end soon |
||
Risk |
Risk sentiment positive as interest rate pressure |
|||
sentiment |
recedes and fiscal stimulus expectations rise |
|
||
Source: Standard Chartered |
|
|||
Figure 32 |
|
|
||
USD/INR expected to benefit from inflows; oil price a risk |
|
|||
USD/INR vs. Brent oil price (RHS) |
|
|||
|
|
90 |
|
|
|
74 |
|
|
|
|
72 |
80 |
|
|
USD/INR |
|
USD/bbl |
||
70 |
70 |
|||
|
|
|||
|
68 |
60 |
|
|
|
|
|
||
|
66 |
|
|
|
|
64 |
50 |
|
|
|
|
|
||
|
62 |
40 |
|
|
Jan-17 |
Jul-17 |
Jan-18 |
Jul-18 |
Jan-19 |
|
USD/INR |
|
Brent oil (RHS) |
|
|
|
|
|
|
Source: Bloomberg, Standard Chartered
This reflects the views of the Wealth Management Group |
18 |

vk.com/id446425943Standard Chartered Bank
Global Market Outlook | 2 May 2019
12.1 Technical perspectives
Would this year be a repeat of ‘Sell in May and go away’?
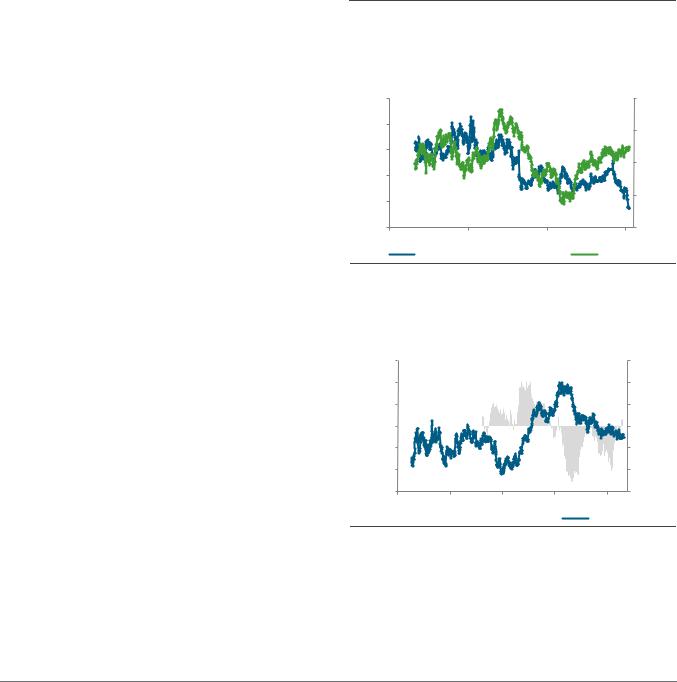
This is a very pertinent question given the sharp rise (over 20%) in the S&P 500 index YTD. Also, there have been five instances since the Great Financial Crisis when the index has made a high in April-May and corrected lower in subsequent months (2009, 2010, 2011, 2013, 2015).
Sentiment indicators are not at their highs even as the S&P index is close to its record high. The American Association of Individual Investors Bullish Reading index is well below its January 2018 peak. Likewise, other indicators, including the CBOE put-call ratio and the NYSE New Highs minus New Lows, are not at their extremes.
This is important from a psychological standpoint. Markets often peak when optimism is at its peak and bottom when pessimism is at its extreme. However, that doesn’t seem to be the case right now. Given consistent signals across several sentiment/breadth market indicators, the probability of a meaningful correction at this stage seems low.
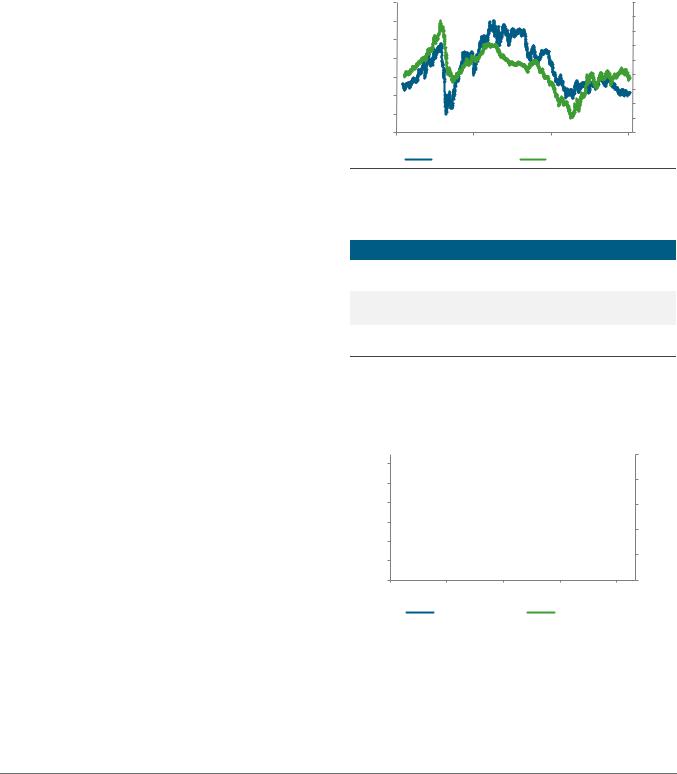
When will the USD break out of its range?
The narrowing of trading ranges and the sharp fall in implied volatilities reflect the lack of direction in major currencies. This can be partly explained by the convergence of monetary policies and economic growth outlook this year (vs diverging policies and growth outlook last year). Just as the Fed switched to a dovish stance, other central banks followed suit. Also, notwithstanding the recent upbeat global manufacturing data, the global economy is expected to slow this year (IMF recently downgraded its forecasts). This leaves little room for differentiation and makes risk-reward assessments difficult.
The question then arises, when will the sideway period end? The Bollinger Band Width (BBW) indicator is at its lowest level since 2014. Extreme low levels indicate low level of volatility, but this is often followed by a rise in volatility and a break out of the USD index from its range. Obviously, for this to occur, there needs to be a catalyst. In this regard, global data in the next few weeks will be key. A repricing in Fed interest rate expectations and signs of the US economy underperforming or outperforming, or a stabilisation in the Euro area growth outlook, could bring life back to the currency markets.
Not at the peak of optimism yet
S&P 500 and AAII Bullish Readings, Daily chart |
|
|
||
|
|
American Association of Individual |
|
|
|
3,200 |
Investors Vs S&P500 |
130 |
|
|
|
|
||
|
2,700 |
|
110 |
|
Index |
2,200 |
|
90 |
Index |
1,700 |
|
70 |
||
|
|
|
||
|
1,200 |
|
50 |
|
|
700 |
|
30 |
|
|
200 |
|
10 |
|
May-12 |
Feb-14 |
Nov-15 |
Aug-17 |
May-19 |
|
S&P500 |
|
AAII bull readings |
|
Source: Bloomberg, Standard Chartered
Figure 34
FX volatility has fallen sharply
CVIX, Daily chart
|
27 |
|
23 |
|
19 |
Index |
15 |
|
|
|
11 |
|
7 |
|
3 |
Feb-07 |
Mar-10 |
Apr-13 |
May-16 |
Jun-19 |
|
3m realised FX volatility (based on CVIX) |
|
||
|
3m implied FX volatility (based on CVIX) |
|
||
|
|
|
||
Source: Refinitiv Eikon, Standard Chartered |
|
|
||
Figure 35
USD appears to be in advanced stages of its range
USD (DXY) Index, Weekly chart
|
105 |
|
100 |
|
95 |
Index |
90 |
85 |
|
|
80 |
|
75 |
|
70 |
|
18 |
Index |
12 |
6 |
|
|
0 |
Apr-11 |
Dec-13 |
Aug-16 |
|
Apr-19 |
|
|
Index |
|
Upper |
|
Spread |
|
|
|
|||
|
Boll 20DMA |
|
Lower |
|
|
Source: Refinitiv Eikon, Standard Chartered
Figure 33
This reflects the views of the Wealth Management Group |
19 |
vk.com/id446425943Standard Chartered Bank
Global Market Outlook | 2 May 2019
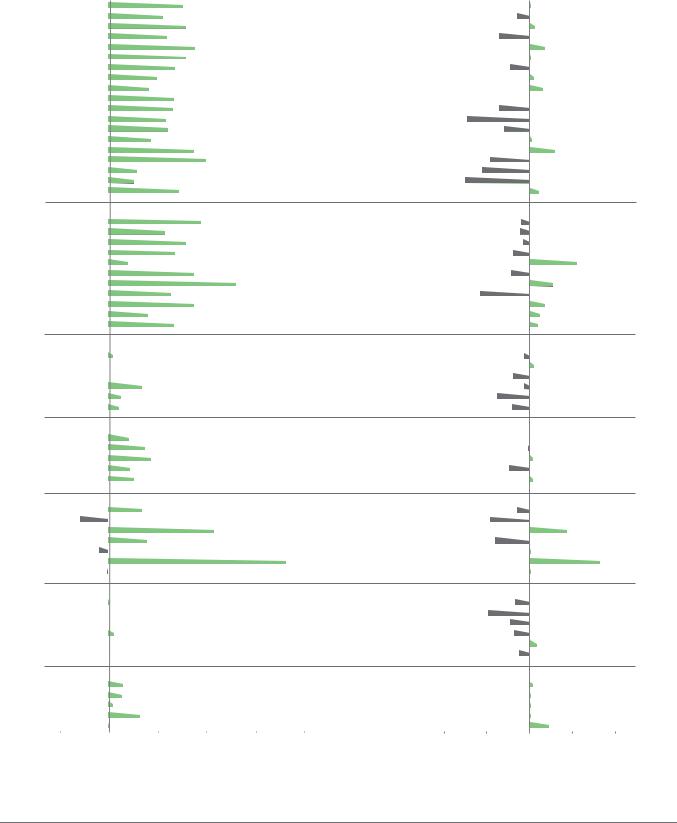
16Market performance summary*
Year to date
15.3%
11.1%
15.7%
12.0%
17.5%
15.7%
13.7%
9.8%
8.1%
13.4%
13.1%
11.6%
12.1%
8.6%
17.3%
19.9%
5.9%
5.1%
14.2%
18.8%
11.4%
15.8%
13.6%
3.9%
17.4%
26.0%
12.7%
17.3%
8.1%
13.5%
0.9%
 1.6% -0.4%
6.8%
2.5% 2.1%
4.1%
7.5%
8.6%
4.4% 5.1%
6.7%
-5.8%
21.5%
7.9%
-2.0%
-0.4%
0.2%
-0.5%  -2.9%
-2.9% 
1.1%
-1.8%  0.0%
0.0% 
|
Equity | Country & Region |
1 Week |
|
|
Global Equities |
|
0.1% |
|
Global High Divi Yield Equities |
-0.6% |
|
|
Developed Markets (DM) |
|
0.3% |
|
Emerging Markets (EM) |
|
|
|
|
-1.4% |
|
|
US |
|
|
|
|
0.7% |
|
|
Western Europe (Local) |
|
|
|
|
0.0% |
|
|
Western Europe (USD) |
|
|
|
|
-0.9% |
|
|
Japan (Local) |
|
|
|
|
0.2% |
|
|
Japan (USD) |
|
|
|
|
0.6% |
|
|
Australia |
|
|
|
|
0.0% |
|
|
Asia ex-Japan |
|
|
|
|
-1.4% |
|
|
Africa |
|
|
|
|
-2.9% |
|
|
Eastern Europe |
|
|
|
|
-1.2% |
|
|
Latam |
|
|
|
|
0.1% |
|
|
Middle East |
|
|
|
|
1.2% |
|
|
China |
|
|
|
|
-1.8% |
|
|
India |
|
|
|
|
-2.2% |
|
|
South Korea |
|
|
|
-3.0% |
||
|
Taiwan |
||
|
|
0.5% |
|
|
|
|
|
|
Equity | Sector |
|
|
|
Consumer Discretionary |
|
-0.4% |
|
Consumer Staples |
|
-0.4% |
|
Energy |
|
-0.3% |
|
|
|
|
|
Financial |
|
-0.8% |
|
Healthcare |
|
|
|
|
2.2% |
|
|
Industrial |
|
|
|
|
-0.9% |
|
|
IT |
|
|
|
|
1.1% |
|
|
Materials |
|
|
|
|
-2.3% |
|
|
Telecom |
|
|
|
|
0.7% |
|
|
Utilities |
|
|
|
|
0.5% |
|
|
Global Property Equity/REITs |
|
|
|
|
0.4% |
|
|
|
|
|
|
Bonds | Sovereign |
|
|
|
DM IG Sovereign |
|
-0.3% |
|
US Sovereign |
|
0.2% |
|
|
|
|
|
EU Sovereign |
|
-0.8% |
|
|
|
|
|
EM Sovereign Hard Currency |
|
-0.3% |
|
EM Sovereign Local Currency |
|
|
|
|
-1.5% |
|
|
Asia EM Local Currency |
|
|
|
|
-0.8% |
|
|
|
|
|
|
Bonds | Credit |
|
|
|
DM IG Corporates |
|
0.0% |
|
DM High Yield Corporates |
|
-0.1% |
|
US High Yield |
|
0.2% |
|
Europe High Yield |
|
-1.0% |
|
Asia Hard Currency |
|
0.2% |
|
Commodity |
|
|
|
Diversified Commodity |
|
-0.6% |
|
|
-1.8% |
|
|
Agriculture |
|
|
|
|
|
|
|
Energy |
|
1.8% |
|
Industrial Metal |
|
-1.6% |
|
Precious Metal |
|
0.1% |
|
Crude Oil |
|
|
36.2% |
|
3.3% |
|
Gold |
|
||
|
|
0.1% |
|
|
|
|
|
|
FX (against USD) |
|
|
|
Asia ex-Japan |
|
-0.7% |
|
AUD |
|
-1.9% |
|
EUR |
|
-0.9% |
|
GBP |
|
-0.7% |
|
JPY |
|
0.3% |
|
SGD |
|
-0.5% |
Alternatives
|
|
|
3.0% |
|
|
|
|
Composite (All strategies) |
|
|
0.2% |
|
|
|
|
|
|
2.7% |
|
|
|
|
Relative Value |
|
|
0.0% |
|
|
|
|
|
|
0.9% |
|
|
|
|
Event Driven |
|
|
0.0% |
|
|
|
|
|
|
6.4% |
|
|
|
|
Equity Long/Short |
|
|
0.0% |
|
|
|
|
|
|
0.1% |
|
|
|
|
Macro CTAs |
|
|
|
0.9% |
|
|
-10% |
0% |
10% |
20% |
30% |
40% |
-4% |
-2% |
0% |
2% |
4% |
||||
Source: MSCI, JPMorgan, Barclays, Citigroup, Dow Jones, HFRX, FTSE, Bloomberg, Standard Chartered *All performance shown in USD terms, unless otherwise stated
*YTD performance data from 31 December 2018 to 25 April 2019 and 1-week performance from 18 April 2019 to 25 April 2019
This reflects the views of the Wealth Management Group |
20 |