


vk.com/id446425943
NOVEMBER 7, 2018 RUSSIAN RETAIL – DISRUPTED BY SPECIALISTS
Competition and Cannibalization
Specialized retailers have emerged as a headwind for the industry only in the past two years, though the traditional drags on revenues of competition and cannibalization remain. We think their effect is diminishing, however.
The last few years have seen a growing overlap between chains, which is normally associated with declining margins. The pattern is that a retailer with first mover advantage initially sets a higher markup and then reduces prices once competitors start building scale in the same area. A good example is Magnit, which used to be the only efficient player in small and medium sized cities. In 1H14, 56% of Magnit stores overlapped with Pyaterochka stories. Back then, our price checks showed higher prices at Magnit stores outside Moscow than Pyaterochka stores in Moscow (though Magnit’s prices were nevertheless lower than in non organized retail). But the rapid expansion of Pyaterochka boosted the overlapping ratio to 81% as of 3Q18. As you would expect, new Pyaterochkas were in relatively worse locations and offered lower prices to attract customers. As a result, Magnit was forced to adjust prices and is still experiencing traffic outflow. Meanwhile, the company’s gross margin declined from 28.6% in 1H14 to 25.7% in 1H18. There of course were other reasons behind this, but Pyaterochka’s entry was the most important one, in our view.
Overlap between Magnit convenience and Pyaterochka
100%
Share of overlapped Magnits grew from 56% to 81%
80% |
60% |
40% |
20% |
0% |
1Q14 3Q14 1Q15 3Q15 1Q16 3Q16 1Q17 3Q17 1Q18 3Q18 |
Magnit and X5 gross margin, seasonally adjusted
30%
28%
26%
Gross margin compressed from 29% to 25%
24%
22%
20%  1Q14 3Q14 1Q15 3Q15 1Q16 3Q16 1Q17 3Q17 1Q18 3Q18
|
|
Magnit overlapped by Pyaterochka |
|
Pyaterochka overlapped by Magnit |
|
Magnit 12m gross margin |
X5 12m gross margin |
|
|
|
|||||
|
|
|
|
|
|
||
Source: Cint, Sberbank CIB Investment Research |
|
|
|
Source: Companies, Sberbank CIB Investment Research |
|
||
We think this headwind is abating, as both chains are already well represented in key regions. The overlap ratio in relation to the other chain is comparable and we expect its future growth to be just moderate. Prices at the chains are already at the same levels (evidenced by our price checks) and further adjustments seem to be unnecessary. Thus, we can conclude that most of the margin squeeze is behind us. Promos have been moderating and gross margins stabilizing for X5 Retail Group this year. The exceptions to these trends are Moscow and St Petersburg, where Magnit is underrepresented and Pyaterochka competes mostly against Dixy. Nevertheless, despite lower quality locations, Magnit plans to triple revenues in Moscow, reasoning that an updated concept and assortment will bring in customers.
14 |
SBERBANK CIB INVESTMENT RESEARCH |
This document is being provided for the exclusive use of strogaas@baltinvest.com |
This document is being provided for the exclusive use of strogaas@baltinvest.com |

vk.com/id446425943
RUSSIAN RETAIL – DISRUPTED BY SPECIALISTS |
NOVEMBER 7, 2018 |
|
|
Overlap between Magnit convenience and Pyaterochka in 3Q18
100% |
90% |
|
|
|
|
|
|
|
|
|
|
|
|
82% |
82% |
76% 78% |
80% |
80% |
|
|
77% |
||
|
|
|
|
71% |
|
|
|
|
|
|
|
60% |
50% |
53% |
|
|
|
|
|
|
|
|
|
40% |
|
|
|
|
|
20% |
|
|
|
|
|
0% |
|
|
|
|
|
|
Moscow |
St Petersburg |
Major cities |
Regions |
Average |
|
|
|
(excl Mos |
|
|
|
|
|
and SPb) |
|
|
|
|
Magnit overlapped by Pyaterochka |
|
Pyaterochka overlapped by Magnit |
|
|
|
||
|
|
|
|
|
Source: Cint, Sberbank CIB Investment Research
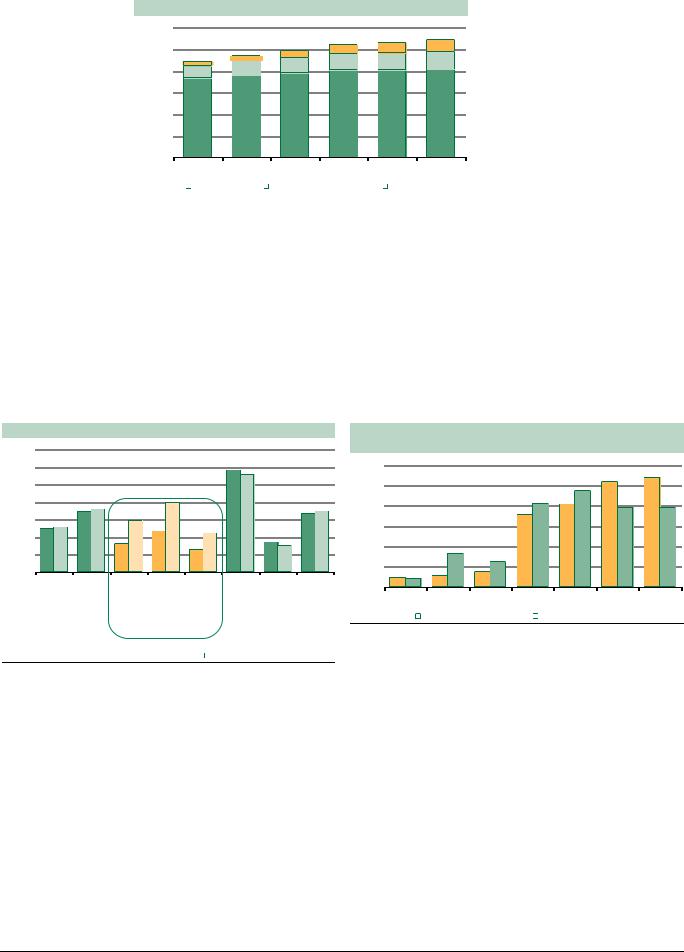
We believe we are now entering a new stage of evolution on the food retail market. Both Magnit and Pyaterochka are well represented in key regions and offer comparable prices. However, they are still expanding, which increases the density of stores, with each newly opened store capturing some revenues of existing ones. Assuming rational price strategies, we do not believe margins will suffer much longer. This means only top line pressure should persist, and this can be evaluated. Based on our market database, 2018 should finally mark a material decrease in space additions. We have seen that hypermarkets have stopped expanding: closures by other players have offset additions by Lenta, and the latter has guided halving store additions next year. Supermarkets are expanding (we include the specialists in this category), but at a slowing pace, and their share of the growth is small. Convenience stores represent the biggest contributor to space additions, but the pace of expansion is decelerating. In absolute terms, we see 2.3 mln m2 of new selling space being introduced in 2018, which would be a significant step back from the average of 3.0 mln m2 per annum we have seen over the past few years. Moreover, we assume a further deceleration to 1.6 mln m2 of additions by 2020.
We expect space CAGR to slow from the 11% average over 2014 17 to 4% in 2018 21. In addition, we forecast 2020 industry revenue growth of 5.6% to outpace the 4.0% growth of new space. All else being equal, the competitive environment will offer a 2 pp tailwind for LFL sales growth by 2H19. That said, Moscow could be an exception, owing to Magnit’s expansion plans there (we examine these in the next chapter).
Modern space by format, ’000 m2 |
|
Overall food retail revenue growth vs modern space |
50,000 |
|
growth |
|
|
40,000 |
|
|
|
|
|
|
|
18% |
|
|
|
|
|
|
|
|
|
|
|
|
|
|
|
|
|
|
|
|
|
|
|
|
|
|
|
|
|
|
|
15% |
|
|
|
|
|
|
|
30,000 |
|
|
|
|
|
|
|
12% |
|
|
|
Revenue growth to converge with |
|||
|
|
|
|
|
|
|
|
|
|
|
|||||
|
|
|
|
|
|
|
|
|
|
|
|
||||
20,000 |
|
|
|
|
|
|
|
9% |
|
|
|
space growth in 2H19, which is |
|||
|
|
|
|
|
|
|
|
|
|
LFL positive. |
|
|
|||
|
|
|
|
|
0% CAGR |
|
|
|
|
|
|
||||
|
|
|
|
|
|
|
|
|
|
|
|
||||
|
|
|
|
|
|
6% |
|
|
|
|
|
|
|
||
10,000 |
|
|
|
|
|
|
|
|
|
|
|
|
|
|
|
0 |
|
|
|
|
|
|
|
3% |
|
|
|
|
|
|
|
|
|
|
|
|
|
|
|
|
|
|
|
|
|
|
|
2014 |
2015 |
2016 |
2017 |
2018E |
2019E |
2020E |
2021E |
0% |
|
|
|
|
|
|
|
|
|
|
|
|
|
|
|
|
|
|
|
|
|
|
|
Supermarkets |
|
Hypermarkets |
Discounters |
|
2014 |
2015 |
2016 |
2017 |
2018E |
2019E |
2020E |
2021E |
|||
|
|
|
|
|
|
|
|
|
|
||||||
Source: State Statistics Service, Sberbank CIB Investment Research |
|
|
Total food retail revenue growth |
Modern retail selling space growth |
|||||||||||
|
|
|
|
|
|
|
|
|
|
||||||
|
|
|
|
|
|
|
|
Source: State Statistics Service, Sberbank CIB Investment Research |
|
|
|||||
We have already seen a deceleration in selling space added this year: over 9m18, the three public retail chains added a total of 1.040 mln m2 of selling space, 25% less than in 9m17. In 3Q18, the three companies added 40% less space than in 3Q17.
SBERBANK CIB INVESTMENT RESEARCH |
15 |
This document is being provided for the exclusive use of strogaas@baltinvest.com |
This document is being provided for the exclusive use of strogaas@baltinvest.com |

vk.com/id446425943
NOVEMBER 7, 2018 RUSSIAN RETAIL – DISRUPTED BY SPECIALISTS
Another important point is that we assume that X5, Magnit and Lenta will account for nearly all of the space additions in 2019 20, or 84% combined. This compares with just 53% over 2014 17, as other modern retailers were adding space but have recently frozen expansion. Thus, should these three decide to stop expanding, we would expect space additions across the entire industry to drop to just 200k m2 per year (or a 0.5% CAGR). In such a scenario, almost all of the industry’s 5% growth would translate into an LFL increase and rent inflation would ease.
Annual space additions by Magnit and X5 |
|
Space increases: public three vs overall market |
1,500 |
|
|
Deceleration |
|
|
|
5,000 |
|
|
|
|
|
|
|
|
||
1,200 |
|
|
already |
|
|
|
|
4,000 |
|
|
taking |
|
|
|
|
||
|
|
|
|
|
|
|
|
|
900 |
|
|
place |
|
|
|
|
3,000 |
|
|
|
|
|
|
|
||
600 |
|
|
|
|
|
|
|
2,000 |
300 |
|
|
|
|
|
|
|
1,000 |
0 |
|
|
|
|
|
|
|
0 |
2014 |
2015 |
2016 |
9m17 |
2017 |
9m18 |
2018E |
2019E |
2020E |
Top 3 accounting for 53% of total space
increases before...
|
|
|
|
...to be 84% going forward |
||
2014 |
2015 |
2016 |
2017 |
2018E |
2019E |
2020E |
|
X5, Magnit and Lenta (combined) |
|
Total modern retail |
|
|
|
|
Magnit |
|
X5 Retail Group |
Source: Companies, Sberbank CIB Investment Research |
|
|
|
|||
|
|
|
|
|
|
Source: Companies
Cannibalization has a similar effect on revenues as competition, the only difference being that it is controlled by the companies. It is also diminishing.
How many Pyaterochka and Magnit convenience stores do you have nearby?
1.5 |
1.2 |
0.9 |
0.6 |
0.3 |
0.0 |
4Q14 4Q15 4Q16 1Q17 2Q17 3Q17 4Q17 1Q18 2Q18 3Q18 |
|
Magnit |
|
Pyaterochka |
|
|
Source: Cint, Sberbank CIB Investment Research
16 |
SBERBANK CIB INVESTMENT RESEARCH |
This document is being provided for the exclusive use of strogaas@baltinvest.com |
This document is being provided for the exclusive use of strogaas@baltinvest.com |

vk.com/id446425943
RUSSIAN RETAIL – DISRUPTED BY SPECIALISTS NOVEMBER 7, 2018
Magnit’s Strategy: The Only Risks Are in
Moscow
Magnit recently presented an updated strategy. The market, however, took it negatively, as the store expansion targets were deemed excessive. The company then downplayed its leadership targets, saying that the medium term focus would be on efficiency and renovations, while 2019 openings would not exceed those of 2018. We have incorporated the long term key numbers from the company’s presentation in our market database to gauge the potential impact on the competitive landscape. Our conclusion is that the company’s plans could distort the market equilibrium in Moscow, but outside the capital the expansion plans are not excessively aggressive.
The company estimates that the market will be worth R16.2 bln in 2023 and its market share will reach 15%. Elsewhere in the strategy presented by the company, it gives market share forecasts for each individual region, though when we add them together, we get an overall market share of 14% in 2023. Based on this, we arrive at a revenue target of R2,252 bln for 2023, an 81% increase versus our forecast for 2018 (for a 13% CAGR).
Magnit sees its three formats (excluding pharmacies) expanding by 14,700 stores through 2023. Assuming an even allocation over the periods, this suggests 1,880 convenience store openings per year, or an 11% store count CAGR for this key format. This would be well below Pyaterochka’s 28% store count CAGR over the past five years. Magnit is already playing this down, saying that its additions of convenience stores in 2019 will not exceed those in 2018 (1,500 gross) and that 70% of the new stores will be opened in locations currently occupied by non chain food shops.
Implied store expansion for Magnit convenience
30,000
25,000 |
|
|
|
|
20,920 |
22,800 |
|
|
|
|
19,040 |
|
|
20,000 |
|
|
17,160 |
|
|
|
|
|
|
|
|
||
|
|
15,280 |
|
|
|
|
15,000 |
13,400 |
|
|
|
|
|
|
|
|
|
|
||
10,000 |
|
|
|
|
|
|
5,000 |
|
|
|
|
|
|
0 |
|
|
|
|
|
|
|
2018E |
2019E |
2020E |
2021E |
2022E |
2023E |
|
Central (ex. Moscow) |
|
Moscow |
|
|
||
|
Northwest (ex. St Petersburg) |
|
St Petersburg |
|
|
||
|
South |
|
North Caucasus |
|
|
||
|
Volga |
|
Urals |
|
|
||
|
Siberia |
|
|
|
|
|
Note: Estimates for 2019 22 made by Sberbank CIB Investment Research.
Source: Magnit, Sberbank CIB Investment Research
Implied revenue calculations, R bln |
|
|
||||
3,000 |
|
|
|
|
|
|
2,500 |
|
|
|
|
2,050 |
2,252 |
|
|
|
|
1,848 |
|
|
2,000 |
|
|
1,646 |
|
|
|
|
|
1,445 |
|
|
|
|
1,500 |
1,243 |
|
|
|
|
|
|
|
|
|
|
||
1,000 |
|
|
|
|
|
|
500 |
|
|
|
|
|
|
0 |
|
|
|
|
|
|
|
2018E |
2019E |
2020E |
2021E |
2022E |
2023E |
|
|
Central (ex. Moscow) |
|
Moscow |
|
|
|
||
|
|
Northwest (ex. St Petersburg) |
|
St Petersburg |
|
|
|
||
|
|
South |
|
North Caucasus |
|
|
|
||
|
|
Volga |
|
Urals |
|
|
|
||
|
|
Siberia |
|
|
|
|
|
|
|
|
|
|
|
|
Note: Estimates for 2019 22 made by Sberbank CIB Investment Research.
Source: Magnit, Sberbank CIB Investment Research
Comparing the implied revenue growth target (based on projected market size and its market share) with selling space expansion (assuming store sizes remain in line with 3Q18 openings) also provides a fairly conservative picture: selling space will grow by 84% through 2023, outpacing implied revenue growth of 81%. Mathematically, this suggests a compound decline of 2% in sales densities. This contradicts another part of the strategy where the company projects 28 55% upside for its sales densities. Meanwhile, we found the slide in the company’s presentation about benchmarking confusing. Our data on key benchmark Pyaterochka indicates materially lower densities: in fact, outside of Moscow and St Petersburg they are lower than for Magnit. Hence, we consider it reasonable that the new strategy’s headline numbers do not rely on growth in sales densities.
SBERBANK CIB INVESTMENT RESEARCH |
17 |
This document is being provided for the exclusive use of strogaas@baltinvest.com |
This document is being provided for the exclusive use of strogaas@baltinvest.com |

vk.com/id446425943
NOVEMBER 7, 2018 |
RUSSIAN RETAIL – DISRUPTED BY SPECIALISTS |
|
|
Magnit revenue growth vs space growth |
|
|
2018 sales densities per m2, R ‘000 per year |
|
|
|
||||||||
15,000 |
The announced plans suggest a 3% decline in sales density. |
2,500 |
|
|
+64% |
|
|
|
|
|||||
|
|
|
|
|
|
|
|
|||||||
|
|
|
|
|
|
|
|
|
|
|
|
|
|
|
12,000 |
|
|
|
|
|
|
2,000 |
+55% |
|
+60% |
|
|
|
|
|
|
|
|
|
|
|
|
|
|
|
|
|||
|
|
|
|
|
|
|
|
|
|
460 |
|
|
|
|
9,000 |
|
|
|
|
|
|
1,500 |
+28% |
|
400 |
|
|
|
|
|
|
|
|
|
|
|
|
360 |
|
|
|
|
|
|
|
|
|
|
|
|
|
|
|
|
|
|
+61% |
+50% |
|
6,000 |
|
|
|
|
|
|
1,000 |
276 |
|
280 |
|
|
||
|
|
|
|
|
|
|
|
|
|
|
||||
|
|
|
|
|
|
|
|
240 |
|
250 |
|
|
|
|
|
|
|
|
|
|
|
|
215 |
205 |
|
|
185 |
|
|
|
|
|
|
|
|
|
|
|
|
|
|
|
||
3,000 |
|
|
|
|
|
|
500 |
|
|
|
|
|
|
|
|
|
|
|
|
|
|
|
|
|
115 |
|
135 |
||
|
|
|
|
|
|
|
|
|
|
|
|
|
90 |
|
|
|
|
|
|
|
|
|
|
|
|
|
|
|
|
0 |
|
|
|
|
|
|
0 |
Moscow Regions |
Moscow Regions |
Moscow |
Regions |
|||
|
2018E |
2019E |
2020E |
2021E |
2022E |
2023E |
|
|||||||
|
Selling space, 000 sq m |
|
Sales, R bln |
|
Convenience stores |
Supermarkets |
|
Cosmetics |
||||||
|
|
|
|
|
|
|
|
|
|
|||||
Source: Sberbank CIB Investment Research |
|
|
|
|
|
Current |
Potential |
Pyaterochka |
|
|
|
|||
|
|
|
|
|
|
|
|
|
|
|
|
|||
|
|
|
|
|
|
|
|
Note: By “Regions” we mean outside of Moscow for Magnit and outside of Moscow and St |
||||||
|
|
|
|
|
|
|
|
Petersburg for Pyaterochka. The estimates for Pyaterochka are compiled by Sberbank CIB |
||||||
|
|
|
|
|
|
|
|
Investment Research. |
|
|
|
|
|
|
|
|
|
|
|
|
|
|
Source: Magnit, Sberbank CIB Investment Research |
|
|
|
|
||
The market share forecasts for each individual region provide an interesting picture. Magnit envisages a massive boost in two regions, Moscow and Siberia, where it expects its respective market shares to grow 2.5 fold and 3.5 fold. Excluding these two regions, the company’s long term market share will reach 11.7% and its top line CAGR will come in just under 9% (a reasonably conservative target amid 4 5% industry growth). Competition and penetration are low in Siberia, so Magnit’s stores there will be competing against local players rather than large nationwide chains. Hence, the key challenge for Magnit will be the rollout in Moscow.
Magnit market share by region |
|
Magnit revenue expansion by region |
25% |
|
|
|
|
|
|
|
|
|
600 |
|
|
|
|
|
20% |
|
|
|
|
500 |
20% |
|
|
|
|
19% |
|
|
|
|
|
|
|
17% |
|
|
|
|
|
|
|
|
|
16% |
|
|
|
|
|
16% |
|
400 |
|
|
|
|
|
|
|
15% |
|
|||
|
|
|
|
|
|
|
|
14% |
||
15% |
13% |
|
13% |
13% |
|
|
12% |
|
14% |
|
|
|
|
|
|
300 |
|||||
|
|
|
|
|
|
|
|
|
||
|
|
10% |
|
|
10% |
|
10% |
|
||
10% |
|
|
|
|
|
9% |
||||
|
|
|
8% |
|
|
|
|
|
||
|
|
|
|
|
|
|
|
200 |
||
|
|
|
|
|
|
|
|
|
|
|
5% |
|
4% |
|
|
|
4% |
|
|
3% |
100 |
|
|
|
|
|
|
|
|
|||
0% |
Central |
Moscow |
|
|
South |
|
Volga |
|
|
0 |
|
Northwest |
St Petersburg |
North Caucasus |
Urals |
Siberia |
Average |
||||
|
|
|
2018E |
|
|
|
2023E |
|
|
|
Source: Magnit
477The expansion targets for Moscow
and Siberia are the most ambitious. 423
316 |
272 |
|
|
321 |
|
276 |
|
|
|
|
|
249 |
|
|
|
||
|
|
|
|
|
|
218 |
219 |
|
|
|
|
|
|
|
|
||
|
|
160 |
|
|
|
|
|
|
|
89 |
100 |
70 |
|
92 |
111 |
|
|
|
|
|
35 |
|
30 |
|
|
38 |
Central (excl Moscow) |
Moscow |
Northwest (excl St Petersburg) |
St Petersburg |
South |
North Caucasus |
Volga |
Urals |
Siberia |
|
|
2018E |
|
|
|
2023E |
|
|
Source: Magnit, Sberbank CIB Investment Research
The company plans to boost its market share in Moscow from 4% to 10%. This, coupled with its market growth outlook, suggests revenues in Moscow expanding to R272 bln in 2023 from R89 bln in 2018E. We calculate that X5 Retail Group will generate revenues of R289 bln in Moscow in 2018. Magnit aims to reach a similar size in just five years (whereas it took X5 Retail Group 18 years to build up to its current scale in Moscow). It aims to do this despite higher competition and the best locations already being taken by competitors. This sounds really ambitious to us. It also suggests that Magnit will capture 40% of the anticipated incremental market increase, leaving X5 with only modest market share growth (from 13% up to 15%). We think it unlikely that X5 would sit quietly on the sidelines and watch this scenario play out. It would likely take countermeasures, so we think that Magnit will ultimately have to downgrade its opening plans in Moscow.
18 |
SBERBANK CIB INVESTMENT RESEARCH |
This document is being provided for the exclusive use of strogaas@baltinvest.com |
This document is being provided for the exclusive use of strogaas@baltinvest.com |
vk.com/id446425943
RUSSIAN RETAIL – DISRUPTED BY SPECIALISTS |
NOVEMBER 7, 2018 |
|
|
Market projections for Moscow
3,000 |
|
|
|
|
|
|
|
2,500 |
|
5% |
7% |
8% |
9% |
10% |
|
|
4% |
14% |
15% |
15% |
|||
|
14% |
||||||
2,000 |
14% |
||||||
13% |
|
|
|
||||
|
|
|
|
||||
|
|
|
|
|
|||
1,500 |
|
|
|
|
|
|
|
1,000 |
|
|
|
|
|
|
|
500 |
|
|
|
|
|
|
|
0 |
|
|
|
|
|
|
|
|
2018E |
2019E |
2020E |
2021E |
2022E |
2023E |
|
|
Other |
|
X5 Retail Group |
|
Magnit |
|
|
|
|
|||
|
|
|
|
|
|
|
Source: Magnit, Sberbank CIB Investment Research
The company argues that expansion in Moscow will require no price investments, as its stores are already cheap enough. The focus will fall on assortment mix and atmosphere. For it to make progress, existing stores will need to generate traffic inflow, and newly opened stores will have to ensure higher revenue potential. Our regular Ivanovs survey shows that Magnit is the preferred option for those on lower incomes, so it represents a major destination when people are shopping for staples. Changing this perception will help to attract wealthier customers and drive a favorable change in the sales mix. Our survey confirms that Magnit is lagging far behind Pyaterochka in terms of assortment and atmosphere, so if it can overcome this it should attract more customers. Meanwhile, it offers fewer promotions, so we would expect it to intensify these to help it expand in the city, which in turn would likely have a detrimental impact on X5 Retail Group’s margins.
Store perception in Moscow, Magnit vs Pyaterochka
3.50 |
|
|
|
|
|
|
|
|
|
3.00 |
|
|
|
|
|
|
|
|
|
2.50 |
|
|
|
|
|
|
|
|
|
2.00 |
|
|
|
|
|
|
|
|
|
1.50 |
|
|
|
|
|
|
|
|
|
1.00 |
|
|
|
|
|
|
|
|
|
0.50 |
|
|
|
|
|
|
|
|
|
0.00 |
Price |
|
|
|
|
|
|
|
|
Quality |
Assortment |
Number |
of promos |
Atmosphere, interior and |
cleanliness |
Location |
Level of service |
Convenience of shopping |
|
Magnit |
|
Pyaterochka |
|
|
Source: Cint, Sberbank CIB Investment Research
Core customer distribution by income group in Moscow, R ‘000
30% |
|
|
|
|
|
26% |
27% |
|
|
|
|
|
|
||
|
|
|
|
|
24% |
|
|
25% |
|
|
|
|
|
|
|
|
|
|
21% |
|
|
|
|
20% |
|
|
|
20% |
20% |
20% |
|
|
|
|
18% |
|
|||
|
|
|
|
|
|
||
15% |
|
|
|
|
|
|
|
10% |
|
8% |
6% |
|
|
|
|
|
|
|
|
|
|
|
|
5% |
2% 2% |
3% |
4% |
|
|
|
|
|
|
|
|
|
|||
|
|
|
|
|
|
|
|
0% |
|
|
|
|
|
|
|
|
<10 |
10 15 |
15 20 |
20 30 |
30 40 |
40 60 |
>60 |
|
Pyaterochka |
|
Magnit convenience |
|
|
Source: Cint, Sberbank CIB Investment Research
A higher number of stores suggests downside for LFL sales and margins in Moscow, but this scenario is unlikely to play out rapidly. To boost openings next year, Magnit should already have a decent pipeline by now, but we do not think this is the case, whereas X5 is progressing at full steam.
SBERBANK CIB INVESTMENT RESEARCH |
19 |
This document is being provided for the exclusive use of strogaas@baltinvest.com |
This document is being provided for the exclusive use of strogaas@baltinvest.com |