

Report - How Robots Change the World_watermark
.pdfvk.com/id446425943
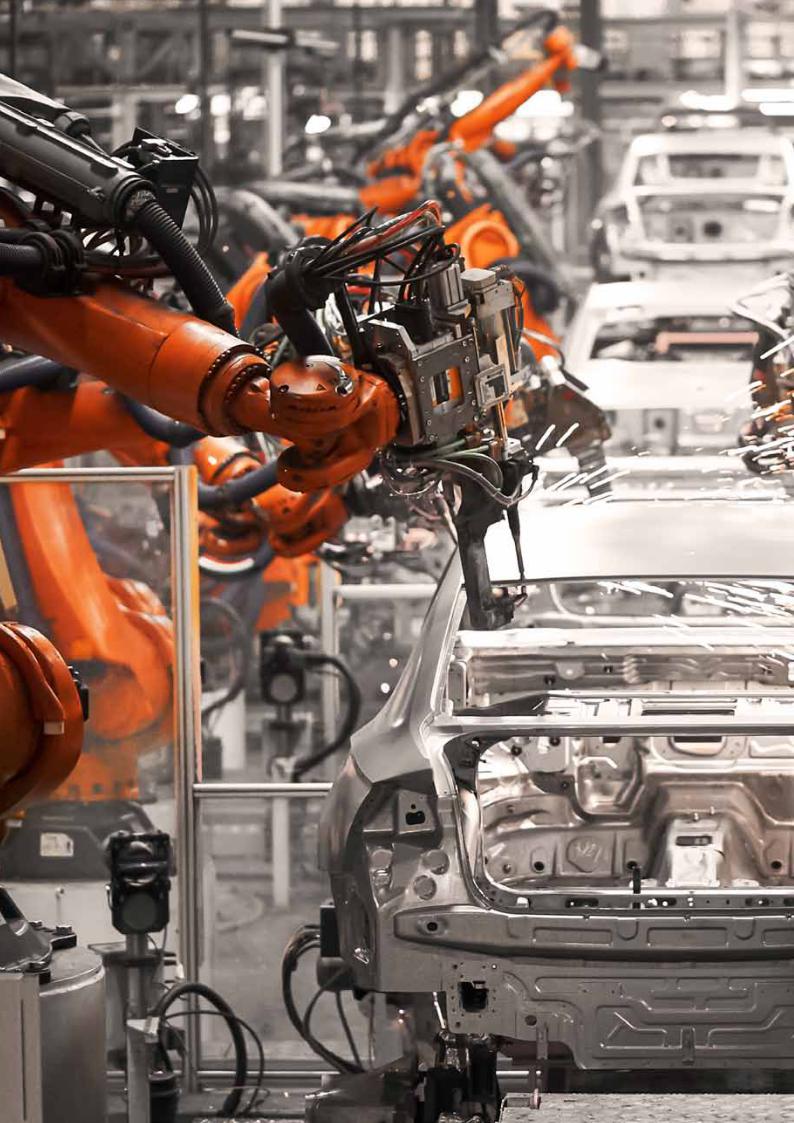
How Robots Change the World
THE IMPACT OF ROBOTS ON MANUFACTURING JOBS
While China leads the way in robot investment, many other major manufacturing economies have also rapidly expanded their use of industrial robots in recent years. We quantified the impact of this global rise in industrial robot inventory on manufacturing employment since 2000. We also forecast
the number of manufacturing jobs that could be lost to robotization around the world by 2030, and the distribution of potential changes across higherand lower-income regions within countries.
It’s important to note that despite the rising pace of robotics investment and installation, popular fears that robots will create huge swathes of unemployment around the world are somewhat misplaced.
This is because the value created by robots across the economy more than offsets their disruptive impact on employment.
Manufacturers automate their production processes to boost productivity.
This creates a “displacement effect” on manufacturing jobs, since the new technology can perform a worker’s job more cost-effectively for a given standard of quality. It also reduces unit-production costs that, in a competitive market, translate into lower prices and effectively raises the real spending power of consumers. Therefore, the
same robots that displace jobs
in manufacturing also create employment across the wider economy. We explore this positive economic impact in greater detail on page 35.
At a regional or local level, however, the impact on jobs varies greatly. Since most manufactured goods are highly tradable (because they are cheap to transport and have a long shelf life), the households that benefit from cheaper goods are widely dispersed. By contrast, the communities most reliant on manufacturing jobs—and thus most affected by the introduction of new technology—are typically much more concentrated. Throughout history, this geographical imbalance between the positive
and negative effects of automation has had significant economic, social, and political implications. We developed an econometric model to quantify the impact on manufacturing jobs in each country’s higherand lower-income regions.
GLOBAL IMPACTS
Since 2004, each new industrial robot installed in the manufacturing sector displaced an average of 1.6 workers from their jobs. The full impact takes time to materialise, however. Within the first year of a robot’s installation, roughly 1.3 workers are displaced, on average, from their job; this extends to 1.6 workers over subsequent years.
This finding is consistent with other evidence from industry
Throughout history, the geographical imbalance between the positive and negative
effects of automation has had significant economic, social and political implications.
as it adopts automation: the true productivity gains can take several years to
materialise as workers receive appropriate training, and as firms understand how best to reorganise their production processes and business models to exploit the benefits of the new technology at scale.
19

vk.com/id446425943
How Robots Change the World
A NOTE ABOUT OUR ECONOMETRIC MODELLING
Our study presents our econometric analysis of the link between robot installations and manufacturing job losses at both the national level and for regions within specific countries. Our model focuses on 29 manufacturing-intensive countries using 11 years of data, offering unprecedented levels of detail about the
past and future impacts of robotization on manufacturing jobs around the world.
In addition to providing absolute figures, we have calculated the marginal impact of each additional robot installation on manufacturing jobs across the countries studied. Our modelling establishes how this impact compares between lowerand higher-income regions within a country (defined as regions with average household income levels above and below the national average).
Drawing on data from the International Federation of Robotics (IFR), an industry trade group, we investigated the ways in which the installation of additional industrial robots affected local manufacturing employment in Japan, the European Union,
the United States, South Korea, and Australia.11 By constructing a large, regional panel dataset of robot stock alongside other labour market indicators over an 11-year timeframe, we were able to isolate the impact
of robotization versus other strong influences on local
labour markets—these include changes in real wages, shifts in global trade patterns, and other unobservable regional and industry-related factors.
See Appendix for a full explanation of this methodology.
Fig. 6: Our econometric modelling framework
Source |
Variable |
|
|
|
|
|
|
|||
|
|
|
|
|
|
|
|
|
|
|
|
Momentum |
|
|
|
|
|
|
|
||
Oxford |
Manufacturing jobs per |
|
|
|
|
|
|
|
|
|
Economic’s |
|
|
|
|
|
|
|
|
||
capita in previous year |
|
|
|
|
|
|
|
|||
Global |
|
|
|
|
|
|
|
|||
|
|
|
|
|
|
|
|
Data used for 29 countries |
||
Economics |
|
|
|
|
|
|
|
|
||
and |
Economic |
|
|
|
|
|
over 11 years from 2004 to |
|||
Global |
|
|
|
|
|
2016, disaggregated by |
||||
performance |
|
|
|
|
|
region and sector. |
||||
Cities |
|
|
|
|
|
|||||
|
|
|
|
|
|
|
||||
databanks |
GDP per capita |
|
|
|
|
|
|
|
||
|
|
|
|
|
|
|
|
|||
|
|
|
|
|
|
|
|
|
Employment impact |
|
|
|
|
|
|
||||||
|
|
|
|
|
|
|
|
|
|
|
|
Outsourcing |
|
|
|
|
|
|
|
||
|
|
|
|
|
|
|
|
|||
|
|
|
|
|
|
|
|
|
Share of |
|
Comtrade |
Trade with China |
|
|
|
|
|
manufacturing jobs |
|
||
database; |
|
|
|
|
|
in local economy |
|
|||
|
|
|
|
|
|
|
|
|
||
Oxford |
|
|
|
|
|
|
|
|
|
|
Economics |
Export |
|
|
|
|
|
Manufacturing jobs per |
|
||
calculations |
|
|
|
|
|
|
||||
aptitude |
|
|
|
|
|
1,000 workers |
|
|||
|
|
|
|
|
|
|
|
|||
|
Trade with the rest |
|
|
|
|
|
|
|
||
|
of world |
|
|
|
|
|
|
|
||
|
|
|
|
|
|
|
||||
|
|
|
|
|
|
|
|
|
|
|
|
|
|
|
|
|
|
|
|
|
|
|
Region-specific |
|
|
|
|
|
|
|
||
|
factors |
|
|
|
|
|
We isolate the average marginal |
|||
|
|
|
|
|
|
|||||
|
Panel data techniques |
|
|
|
|
|||||
|
|
|
|
|
|
impact on manufacturing jobs |
||||
|
|
|
|
|
|
|
|
|
||
|
|
|
|
|
|
|
|
|
at local level from each |
|
|
|
|
|
|
|
|
|
|
||
|
|
|
|
|
|
|
|
|
additional robot intsalled. |
|
IFR; |
Robot |
|
|
|
|
|
||||
|
|
|
|
|
|
|
||||
densification |
|
|
|
|
|
|
|
|||
Oxford |
|
|
|
|
|
|
|
|||
Economics |
Robots per 1,000 workers |
|
|
|
|
|
|
|
||
calculations |
|
|
|
|
|
|
|
|||
|
|
|
|
|
|
|
|
|
|
|
20 |
11 Despite its prominence in global manufacturing, China was omitted from our econometric modelling exercise due to a lack of data in other important |
|
modelling variables. |

vk.com/id446425943
How Robots Change the World
We also calculated the total amount of manufacturing jobs lost to robotization throughout the world since the turn of
the century,12 considering factors such as redundancies caused by off-shoring and the globalisation of supply chains. In all, we estimate that around 1.7 million manufacturing jobs have been wiped out since 2000 due to the global rise of industrial robots. Fig. 7 illustrates the impact by country: in the US, we estimate that more than 260,000 jobs have been lost to robots (around 2%
of today’s manufacturing workforce), while in the European Union, robots have taken the place of 1.5% of the current manufacturing
workforce (some 400,000 jobs). In China, as many as 550,000 manufacturing jobs have been displaced by robotization since 2000, equivalent to around 1% of its current manufacturing workforce.
Assuming robot investments continue at their current pace, many millions of additional manufacturing jobs are likely to be displaced by robots by 2030. While considerable uncertainties exist around the rate of adoption of new technologies, it is possible to estimate the likely impact of robotization in the coming years.
We have projected the growth in the active robot stock across major manufacturing economies to 2030, based on the IFR’s three-year growth projections for new robot installations and including
the need to replace some robots over time as they deteriorate. On this basis, we expect almost 20 million manufacturing jobs to disappear around the world
because of robotic automation (see Fig. 8). Put differently, if current trends hold, the global manufacturing workforce would be 8.5% larger by 2030 if robots were not remaking the market.13
Fig. 7: Cumulative jobs losses implied by automation since 2000
Cumulative jobs lost since 2000
0 |
|
|
|
|
|
|
|
|
|
|
|
|
|
|
|
|
|
|
|
|
|
|
|
|
|
|
|
|
|
|
|
|
|
400,000 |
|
|
|
|
|
|
|
|||||
-200,000 |
|
|
|
|
|
|
|
|
|
|
|
|
|
|
|
|
|
|
|
|
|
|
|
|
|
|
|
|
|
|
|
|
|
|
|
|
|
|
|
|
||||||
-400,000 |
|
|
|
|
|
|
|
|
|
|
|
|
|
|
|
|
|
|
|
|
|
|
|
|
|
|
|
|
|
|
|
|
|
550,000 |
|
|
|
|
|
|
EU28 |
|||||
-600,000 |
|
|
|
|
|
|
|
|
|
|
|
|
|
|
|
|
|
|
|
|
|
|
|
|
|
|
|
|
|
|
|
|
|
|
260,000 |
|
|
|
|
China |
||||||
|
|
|
|
|
|
|
|
|
|
|
|
|
|
|
|
|
|
|
|
|
|
|
|
|
|
|
|
|
|
|
|
|
|
|
|
|
|
|
||||||||
-800,000 |
|
|
|
|
|
|
|
|
|
|
|
|
|
|
|
|
|
|
|
|
|
|
|
|
|
|
|
|
|
|
|
|
|
|
|
|
|
|
US |
|||||||
|
|
|
|
|
|
|
|
|
|
|
|
|
|
|
|
|
|
|
|
|
|
|
|
|
|
|
|
|
|
|
|
|
|
340,000 |
|
|
|
|
||||||||
-1,000,000 |
|
|
|
|
|
|
|
|
|
|
|
|
|
|
|
|
|
|
|
|
|
|
|
|
|
|
|
|
|
|
|
|
|
|
|
|
|
|
||||||||
|
|
|
|
|
|
|
|
|
|
|
|
|
|
|
|
|
|
|
|
|
|
|
|
|
|
|
|
|
|
|
|
|
|
|
|
|
|
South Korea |
||||||||
-1,200,000 |
|
|
|
|
|
|
|
|
|
|
|
|
|
|
|
|
|
|
|
|
|
|
|
|
|
|
|
|
|
|
|
|
|
|
|
|
|
|
|
|
|
|
|
|
|
|
|
|
|
|
|
|
|
|
|
|
|
|
|
|
|
|
|
|
|
|
|
|
|
|
|
|
|
|
|
|
|
|
|
|
|
|
|
|
|
|
|
|
|
|
|
Rest of world |
|
-1,400,000 |
|
|
|
|
|
|
|
|
|
|
|
|
|
|
|
|
|
|
|
|
|
|
|
|
|
|
|
|
|
|
|
|
|
|
|
|
|
100,000 |
|
|||||||
|
|
|
|
|
|
|
|
|
|
|
|
|
|
|
|
|
|
|
|
|
|
|
|
|
|
|
|
|
|
|
|
|
|
|
|
|
|
|
||||||||
-1,600,000 |
|
|
|
|
|
|
|
|
|
|
|
|
|
|
|
|
|
|
|
|
|
|
|
|
|
|
|
|
|
|
|
|
|
|
|
|
|
|
|
|
|
|
|
|
|
|
-1,800,000 |
|
|
|
|
|
|
|
|
|
|
|
|
|
|
|
|
|
|
|
|
|
|
|
|
|
|
|
|
|
|
|
|
|
|
|
|
|
|
|
|
|
|
|
|
|
|
|
|
1 |
|
|
2 |
|
|
3 |
|
|
4 |
|
|
5 |
|
|
6 |
|
|
7 |
|
|
8 |
|
|
9 |
10 |
|
11 |
|
12 |
013 |
|
14 |
|
15 |
|
16 |
||||||||
|
0 |
|
0 |
|
|
0 |
|
|
0 |
|
|
0 |
|
|
0 |
|
|
0 |
|
|
0 |
|
|
0 |
0 |
|
|
|
|
|||||||||||||||||
0 |
|
0 |
|
|
0 |
|
|
0 |
|
|
0 |
|
|
0 |
|
|
0 |
|
|
0 |
|
|
0 |
|
0 |
2 |
|
0 |
0 |
0 |
0 |
|||||||||||||||
2 |
|
2 |
|
|
2 |
|
|
2 |
|
|
2 |
|
|
2 |
|
|
2 |
|
|
2 |
|
|
2 |
|
|
2 |
|
|
2 |
|
2 |
2 |
|
2 |
|
2 |
|
|||||||||
Source: Oxford Economics
12 |
Global estimate based on more than 90% of known global industrial robot installations, according to the International Federation of Robotics. |
21 |
13 |
Manufacturing employment projections from Oxford Economics’ Global Industry model. |
|

vk.com/id446425943
How Robots Change the World
Installing one extra industrial robot in a lower-income region leads to almost twice as many manufacturing job losses as in higherincome regions.
REGIONAL IMPACTS HIT HARDER IN LOWER-INCOME AREAS
Our modelling also allows us to look at the impact of automation on different
regions within each country. These regional differences offer important social and political implications for policy-makers.
Our analysis shows that installing one extra industrial robot in a lower-income region leads to almost twice as many manufacturing job losses as in higher-income regions (see Fig. 9). This finding is based on an analysis of our 29 sample countries, distinguishing between regions whose average household income
levels are either above or below the national average. It also controls for regionallyspecific labour market shocks and underlying employment trends.
Why do these regional differences occur? They are not driven by the relative size of the manufacturing sector— manufacturing accounts
for roughly the same share of economic activity and employment in both lowerand higher-income regions in our sample, and our model controls for sector size. But
there are structural differences in the composition of employment in manufacturing that influence the impact robots have.
Fig. 8: Projected cumulative jobs losses by automation, up to 203014
0 |
|
|
|
|
|
|
|
|
|
|
|
|
|
|
|
|
|
|
|
|
|
|
|
|
-5,000,000 |
|
|
|
|
|
|
|
|
|
|
|
|
|
|
|
|
|
|
|
|
|
|
EU28 |
|
|
|
|
|
|
|
|
|
|
|
|
|
|
|
|
|
|
|
|
|
|
|
China |
||
|
|
|
|
|
|
|
|
|
|
|
|
|
|
|
|
|
|
|
|
|
|
|
|
|
-10,000,000 |
|
|
|
|
|
|
|
|
|
|
|
|
|
|
|
|
|
|
|
|
|
|
US |
|
|
|
|
|
|
|
|
|
|
|
|
|
|
|
|
|
|
|
|
|
|
|
|
|
|
-15,000,000 |
|
|
|
|
|
|
|
|
|
|
|
|
|
|
|
|
|
|
|
|
|
|
South Korea |
|
|
|
|
|
|
|
|
|
|
|
|
|
|
|
|
|
|
|
|
|
|
|
|
||
-20,000,000 |
|
|
|
|
|
|
|
|
|
|
|
|
|
|
|
|
|
|
|
|
|
|
Rest of world |
|
|
|
|
|
|
|
|
|
|
|
|
|
|
|
|
|
|
|
|
|
|
|
|
||
-25,000,000 |
|
|
|
|
|
|
|
|
|
|
|
|
|
|
|
|
|
|
|
|
|
|
|
|
|
18 |
|
19 |
|
20 |
|
21 |
|
22 |
|
23 |
|
24 |
|
25 |
|
26 |
|
27 |
|
28 |
29 |
|
30 |
0 |
0 |
0 |
0 |
0 |
0 |
0 |
0 |
0 |
0 |
0 |
20 |
0 |
||||||||||||
2 |
|
2 |
|
2 |
|
2 |
|
2 |
|
2 |
|
2 |
|
2 |
|
2 |
|
2 |
|
2 |
|
2 |
|
|
Source: Oxford Economics
22 |
14 Projections for ‘Rest of World’ include countries covering more than 99% of the estimated global total. |

vk.com/id446425943
How Robots Change the World
Fig. 9: Manufacturing job losses skew towards lower-income regions
Change in number of jobs due to one additional robot
-1.6
-2.2
-1.3
Average e ect
Lowerincome regions
Higherincome regions
-2.5 |
-2.0 |
-1.5 |
-1.0 |
-0.5 |
0.0 |
|
|
|
Long-term impact |
|
Short-term impact |
|
|
|
|
|
|
|
||
|
|
|
|
|
||
Source: Oxford Economics
Manufacturing workers in lower-income areas tend to have lower skill levels and are therefore more vulnerable to automation. There is typically a difference in the number of robots per manufacturing worker between higher-
and lower-income regions, indicating that those in lower-income regions are, on average, less productive. Data from the UK Labour Force Survey, for example, shows that manufacturing workers in lower-income regions of the UK are more likely to work in lower-skilled occupations— elementary workers and machine operatives account for around one-third of the workforce in lower income regions, compared with 22% in higher-income regions. In
contrast, a significantly higher proportion of managers
and professionals in the manufacturing industry are in higher-income regions.
This vulnerability has evolved over time. In the past, lowerincome areas competed with more expensive cities and regions for manufacturing investment, with the lure
of lower unit costs of production. This competitive edge was a consequence
of relying on a lower-paid, less-productive workforce to carry out lower-skilled jobs. In the new era of automation, the occupational mix in lower income areas means those same manufacturers face the biggest opportunities for efficiency savings. The functions their employees
carry out are—on balance— easier to automate. These efficiency gains can be realised by laying off staff, or by moving the firm to a new, more productive (and likely more automated) site.
Either way, the manufacturing workers in those regions are at risk.
Moreover, the regions of a country most likely to shed manufacturing workers will not benefit equally from the “robotics dividend” —the new jobs created from the productivity boost that feed into the wider economy. Instead, increased industrial automation will tend to exacerbate the regional inequalities that already exist within advanced economies.
23
vk.com/id446425943

vk.com/id446425943
How Robots Change the World
THE ROBOT VULNERABILITY INDEX
It is vital for policy-makers to understand how an uneven distribution of robotics will affect different parts of their country. We have developed a Robot Vulnerability Index to help identify which regions within our chosen economies (the US, Germany, UK, France, Japan, South Korea, and
Australia) will be hardest hit by the ongoing automation of the manufacturing sector.
Our index produces a vulnerability score for each sub-national region15, comprised of three equally weighted indicators:
•Local dependence on manufacturing
employment—defined as the manufacturing share of total employment in the region.
•Future readiness of local industry—characterised by a region’s current intensity of robot use
in manufacturing, controlling for the type of manufacturing activity
undertaken, and measured relative to international competitors.
•Productivity of the local manufacturing workforce— measured relative to the national average.
The index is thus designed to highlight regions that are economically dependent on a less productive (or
lower-skilled) manufacturing industry and do not currently use many robots, since these areas are at highest risk of
economic upheaval in the years ahead. Mapping the vulnerability to robot adoption across all regions of these five advanced economies revealed some common patterns, which can be summarised in three key trends.
Trend #1: Existing inequalities will intensify
Successful economic performance at the regional level in advanced economies is usually inversely correlated with robot vulnerability. In the UK, France, and Germany, those regions that have performed best in recent years (in terms of overall GDP growth) are the least exposed to future robot automation, and vice versa.
This means the regional inequalities that exist within countries, such as England’s north-south divide, could be exacerbated by the rise of the robots. This trend has important implications for policy design in advanced economies pursuing international competitiveness through automation.
Our Robot Vulnerability Index shows that specific regions that are at highest risk of labour disruption—but also reveals some common patterns across regions.
15 Sub-national regions correspond to European NUTS 2, US States, Japanese prefectures, Australian states, and South Korean districts. |
25 |

vk.com/id446425943
How Robots Change the World
The pockets of workers most vulnerable to automation can often be found in rural areas.
Trend #2: Many major cities are safe (for now)
Our analysis shows that major cities are often safe havens for workers in the face of robot led job displacement. Diversified economies depend less on manufacturing jobs, and higher labour costs mean manufacturers located there are already highly productive and tend to employ more highly skilled workers. London, Paris, Seoul, Sydney and Tokyo are all examples.
But manufacturing-intensive cities (including many in South Korea) face a more uncertain future. Cities
with large populations that are more dependent on the manufacturing sector for employment but lag their industry peers in robot intensity and labour
productivity are vulnerable to disruption. Fierce competition will ultimately lead these citybased industries to pursue further automation or risk losing out to more productive competition elsewhere. Either way, additional job displacement of current
manufacturing workers is likely.
Trend #3: Rural regions mask hidden vulnerabilities
The pockets of workers most vulnerable to automation can often be found in rural areas. Despite relatively sparse populations, these regional economies are frequently grounded to isolated towns with more manufacturingintensive industrial structures on which the wider region depends. This is especially problematic when manufacturing in these towns is characterised by traditional, labour-intensive techniques, low levels of productivity, and dated manufacturing processes.
In many countries, such regions have often been left behind as metropolitan centres prospered, and those dynamics have generated political polarisation. This highlights the importance of taking policy action to cushion the likely impact of robotization in these vulnerable areas.
Country-by-country analysis
Over the next seven pages, we illustrate each local region’s relative vulnerability to future manufacturing automation, according to our Robot Vulnerability Index. Each
map is colour-coded from “high vulnerability” to “low vulnerability” regions (relative to the rest of that country) and includes commentary on some of the most striking geographical results.
26 |
1 Xxxxxx |

vk.com/id446425943
How Robots Change the World
UNITED STATES
 Low vulnerability
 Lower-medium vulnerability
 Upper-medium vulnerability
 High vulnerability
While Texas and its |
|
neighbour Louisiana are two |
|
particularly vulnerable states in |
|
the south, Indiana is equally |
|
vulnerable in the mid-west. It is |
|
associated with steel-making (and |
Alaska |
with heavy industry more |
|
generally), albeit with an |
Hawaii |
increasing focus on developing |
|
the growth of its higher-value, |
|
knowledge-based |
|
industries. |
|
Oregon is the most vulnerable state in
the US to a future acceleration in robot installations. The state has had success in transitioning out of traditional sectors into the
production of high-tech components. But high dependence on manufacturing, particularly in and around Portland, and the state’s exposure to globally competitive sectors, mean its workers are vulnerable to rapid
technological progress.
New England states tend to have low vulnerability to the future spread of manufacturing
robots, as do those with a higher reliance on tourism (Florida, Nevada, Hawaii). The same is true for New York state, which, alongside a significant manufacturing base has a high concentration of financial
and business services.
Most |
State: |
Index Score: |
Least |
State: |
Index Score: |
vulnerable |
Oregon |
0.58 |
vulnerable |
Hawaii |
0.17 |
states |
Louisiana |
0.58 |
states |
District of Columbia (DC) 0.18 |
|
|
Texas |
0.50 |
|
Nevada |
0.25 |
|
Indiana |
0.46 |
|
Florida |
0.25 |
|
North Carolina |
0.46 |
|
Vermont |
0.26 |
27

vk.com/id446425943
How Robots Change the World
GERMANY
 Low vulnerability
  Lower-medium vulnerability
 Upper-medium vulnerability
  High vulnerability
The home regions of BMW and Mercedes—Bavaria and Stuttgart, respectively—are examples of future-ready production ecosystems, featuring a highly skilled, highly productive workforce.
Germany’s least-vulnerable region is Hamburg. It has a low level of dependence on manufacturing jobs, and what manufacturing it does have is typically advanced and highly productive, with cutting-edge levels of automation.
A cluster of four eastern regions close to the Czech border—Chemnitz, Thüringen, Oberfranken, and Oberpfalz—look to be the most
vulnerable to robotization. All have high concentrations of manufacturing employment, and (typically) low levels of productivity—particularly
Chemnitz and
Thüringen.
Most |
Region: |
Index Score: |
Least |
Region: |
Index Score: |
vulnerable |
Chemnitz |
0.56 |
vulnerable |
Hamburg |
0.06 |
regions |
Thüringen |
0.49 |
regions |
Darmstadt |
0.13 |
|
Oberfranken |
0.49 |
|
Oberbayern |
0.17 |
|
Oberpfalz |
0.47 |
|
Köln |
0.19 |
|
Freiburg |
0.46 |
|
Berlin |
0.20 |
28