

Report - How Robots Change the World_watermark
.pdfvk.com/id446425943
A vision of human-free production in Italy.
vk.com/id446425943

vk.com/id446425943
How Robots Change the World
INTRODUCTION
Over the past decade, the global stock of industrial robots has risen dramatically, and is projected to grow even faster in the next 10 years, led by China’s record pace
of installation. The robotics industry has experienced exponential investment growth, upending decades-long
trends of gradual and steady expansion. A convergence of innovations in digital technologies (e.g., artificial intelligence and machine
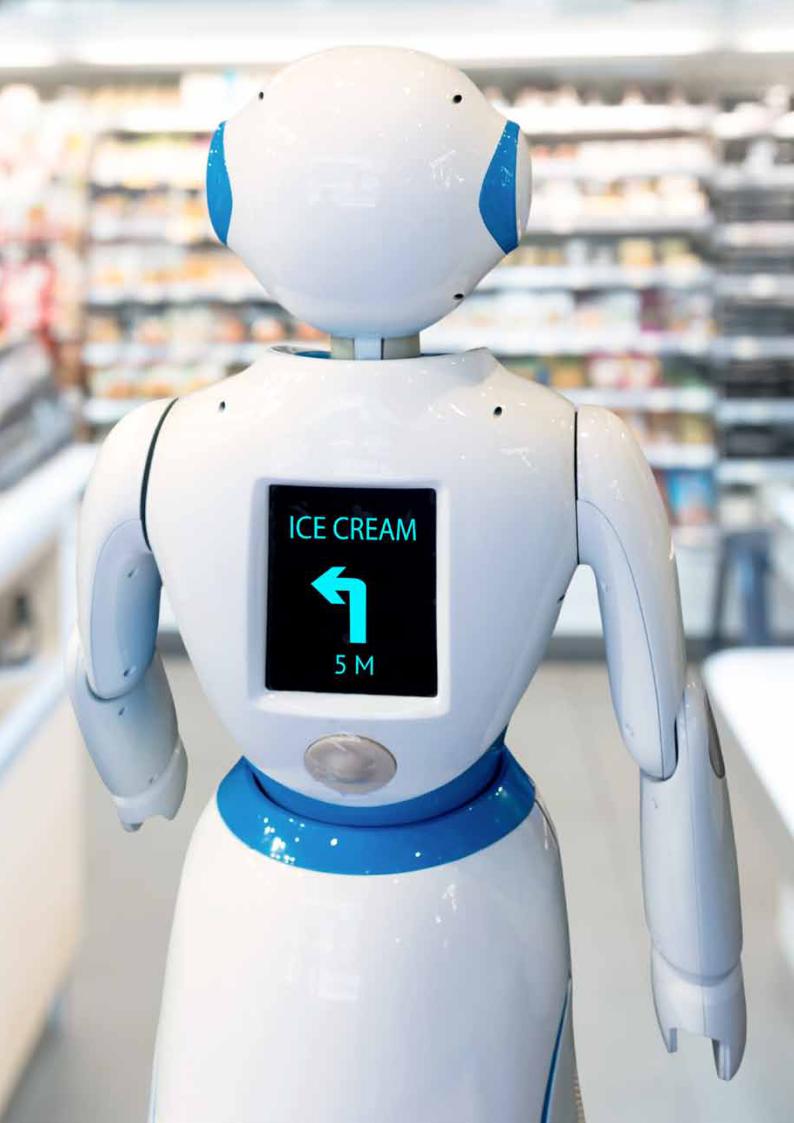
learning) along with advances in robotics engineering and energy storage, is dramatically transforming the capabilities of robots. New breeds of “cobots”—small, highly mobile, and dextrous machines that can readily collaborate with humans—are entering the manufacturing and logistics arenas, and can be easily “trained” to work with humans to optimise productivity.
This era of automation presents significant opportunities
for businesses to boost productivity. But there will be winners and losers in the labour market as these opportunities are seized.
Millions of workers around the world, across all sectors of the economy, will see many of the functions they were once paid to perform handled instead by new technology. Millions more will see the nature of their jobs altered significantly as they are required to master new skills to collaborate with intelligent machines. In autumn 2018, Andy Haldane, the Bank of England’s chief economist,
warned the disruption caused by the automation of cognitive skills could have “as wrenching and lengthy [an] impact on the jobs market” as Britain’s industrial revolution.5 He urged policy-makers to learn the “lessons of history,” with governments stepping up to train workers for the new world of work while providing a welfare state
to cushion the blow from technological change.
This era of automation presents significant opportunities for businesses to boost productivity. But there will be winners and losers in the labour market.
To shed new light on the future impacts of automation, Oxford Economics combined the expertise of its economists, econometricians, modellers, and other subject-matter experts around the world. Our analysis begins by modelling the latest and best data for industrial robot installations
in all manufacturing sectors around the world. These are credible, longitudinal datasets from which we draw fresh insights regarding the impact of robots on employment and productivity in different
countries, and in the higherand lower-income regions within those countries.
Building on these insights, we then assess the future impact of increased robotization on global service sectors—an area where rates of robot adoption have been much lower than
in manufacturing to date, but which employs a much
greater proportion of the global workforce. Around threequarters of workers across advanced economies earn their wages from service labour.
This multi-disciplinary approach enables us to construct a set of questions for policy-makers about the impact of increased
robotization—as well as other processes of automation— on economies and societies around the world. Greater understanding of these issues
will be key to making the most of robot-driven gains in the future while supporting and protecting those who stand to lose out from this era of
dramatic technological change.
5 Haldane warns AI threatens lengthy widespread unemployment’ (Financial Times, 20/08/2018). |
11 |

vk.com/id446425943
How Robots Change the World
WHAT IS OUR DEFINITION OF A ROBOT?
The quantitative modelling aspects of this study are focused on industrial robots used in all types of manufacturing around the world. These automatically controlled, reprogrammable machines are typically used for a host of physical activities in production,
such as processing materials (laser cutting, mechanical grinding), assembling and disassembling, precision welding, painting, and handling a wide range of operations for measurement, inspection, packaging, bending, and casting.
These robots can be fixed installations or mobile, and the latest versions are increasingly powered by
artificial intelligence, so they are “smart” and responsive to their surroundings.
Manufacturing accounted for more than 86% of the world’s operational stock of
industrial robots at the end of 2016, according to the International Federation of
Robotics.6 Automation has long been a critical component of manufacturing, particularly
in the automotive industry, which in 2016 accounted for more than 43% of the total operational stock of industrial robots in global manufacturing. The industry is at the leading edge of robotic applications.
The quantitative analysis in this report is focused on physical machines for which rich, longitudinal data exists. We do not incorporate into this aspect of the analysis the growing role of disembodied software applications sometimes referred to as robots or bots, including programmes used in call centres and in RPA.
Based on robust data, our analysis of the manufacturing sector offers the best perspective to date on
the impact of robots on employment and productivity levels. But the story will continue to unfold as manufacturing itself undergoes rapid technological change. In recent years, new, collaborative categories of AIand cloudenabled robots have emerged that seamlessly bridge the gap between skilled manual assembly and automated production. These “cobots” create new opportunities for automation—even on short, mixed production runs that require both high levels of precision (at which robots excel), and sophisticated vision, handling, and creativity (where human workers continue to add great value).
12 |
6 International Federation of Robotics (2017) “World Robotics: Industrial robots” |

vk.com/id446425943
How Robots Change the World
WHAT DRIVES THE ROBOT RISE?
Since 2010, the global stock of robots in industry has more than doubled: as many robots were installed in the past four years as over the eight previous. During this period, the centre of gravity in the
world’s robot stock has shifted towards new manufacturers, mainly in China, Korea, and Taiwan but also India, Brazil, and Poland.
Approximately every third robot worldwide is now installed in China, which accounts for around onefifth of the world’s total stock of robots—up from just 0.1% in 2000 (see Fig. 2). In 2017, China expanded its lead as the world’s largest market for industrial robots, accounting for 36% of global sales, up from 30% in 2016. If this trajectory of investment continues, by 2030 China
could have as many as 14 million industrial robots in use, dwarfing the rest of the world’s stock of industrial robots as it reinforces its position as the world’s primary manufacturing hub.
In contrast, though it has grown by around 370,000 units since 2000, the combined robot inventory of the US and Europe has fallen to under 40% of the global share from its peak of close to 50% in 2009. And Japan— formerly the world leader in automation—has reduced
its active stock of robots by around 100,000 units since the start of the millennium, in line with a rebalancing of its economy away from manufacturing and the
migration of many production facilities offshore, especially to China.
20%
Proportion of the world’s robot stock located in China. Approximately every third robot is now installed there.
Fig. 2: Robot installations by country, 2000 to 20167
New robot installations
350,000
300,000
250,000
 Rest of World
200,000
 China
China
150,000 |
|
|
|
|
|
|
|
|
|
South Korea |
|
|
|
|
|
|
|
|
|
100,000 |
US |
|
Rest of Europe |
||
|
50,000 |
Germany |
|
|
0 |
Japan |
|
|
|
0 |
|
|
1 |
|
|
2 |
|
|
3 |
|
4 |
|
|
5 |
|
|
6 |
|
|
7 |
|
|
8 |
|
|
9 |
10 |
11 |
|
12 |
|
13 |
|
14 |
|
15 |
|
16 |
||||||||
|
|
|
0 |
|
|
|
|
|
|
|
|
|
|
|
|
|
|
|
|
|
|
|
|
|||||||||||||||||||||||||
|
0 |
0 |
|
|
0 |
|
|
0 |
|
0 |
|
|
0 |
|
|
0 |
|
|
0 |
|
|
0 |
|
|
0 |
0 |
20 |
0 |
0 |
|
0 |
0 |
0 |
|||||||||||||||
0 |
|
2 |
|
|
0 |
|
|
0 |
|
0 |
|
|
0 |
|
|
0 |
|
|
0 |
|
|
0 |
|
|
0 |
|
2 |
|
2 |
|
2 |
|
2 |
|
2 |
|
2 |
|
||||||||||
2 |
|
|
|
|
2 |
|
|
2 |
|
|
2 |
|
|
2 |
|
|
2 |
|
|
2 |
|
|
2 |
|
|
2 |
|
|
|
|
|
|
|
|
|
|
|
|
|
|
|
|||||||
Source: IFR
7 Note: US data include immaterial robot installation numbers for Mexico and Canada prior to 2010 |
13 |
vk.com/id446425943

vk.com/id446425943
How Robots Change the World
The automotive sector has long been the predominant user of robots: innovations in autonomous and electric
vehicle manufacturing requires increasingly sophisticated production chains, and this has sparked demand for new, more powerful, and intelligent machines to build them. However, other manufacturing industries are now taking a more prominent role in robot use. For example, the share
of new robot installations in high tech manufacturing8 grew to 31% in 2016, from 21% in 2000, reflecting rapid growth both in the sector and in the integration of robots into production. Robots have also been increasingly introduced into the production of rubber and plastics, and are slowly finding their way into the food and beverage manufacturing industry (see Fig. 3).
Fig. 3: New industrial robot installations across the world by usage, 2000 vs. 2016
Rubber & |
Other |
plastic products |
|
0 53,000
16,000
84,000
25,000 |
21,000 |
103,000 |
91,000 |
Automotive |
High tech |
Inner circle—2000
Outer circle—2016
Numbers refer to global robot installations in each sector for that year. Source: Oxford Economics
8 High tech manufacturing is defined as electronic devices, semiconductors, LCDs, LEDs, computer equipment, telecommunication equipment, medical |
15 |
equipment, and electrical appliances |
|

vk.com/id446425943
How Robots Change the World
THREE REASONS FOR THE ROBOT SURGE
Our analysis of the use of industrial robots across the manufacturing sector identifies three main drivers behind this new pace of adoption: price, innovative applications, and consumer demand.
Trend #1: Robots are becoming cheaper than humans
The rapid expansion in robot installations is driven in part by the plummeting real costs of the machines. As with other advanced technologies, exponential growth in
the processing power of microchips, extended battery lives, and the benefits of ever-larger, smarter networks have all dramatically increased the per-unit value of many technological components, while the average unit price
of a robot fell by 11% between 2011 and 2016.9
Rising labour costs in major manufacturing economies also contribute to increasingly attractive pricing dynamics. In China, for example, unit labour costs in manufacturing have increased by more than 65% since 2008. Wage rates have also been rising consistently in Korea, Japan, the US, and Germany, in part due to the ageing of the population in these countries.
Trend #2: Robots are rapidly becoming more capable
As robot technologies improve, they are being used in evermore sophisticated processes, in more varied contexts, and can be installed more rapidly.
Innovations have made today’s robots smaller, more sensitive to their environments, and more collaborative. Thanks to AI, they can learn from their experiences and make decisions informed by data from a network of other robots. These developments have helped propel robot adoption in sectors beyond the automotive industry (see Fig. 4).
Fig. 4: Robot adoption growing faster outside the automotive sector
Percentage change in robot densification between 2011 and 2016
United States |
|
|
|
|
14% |
|
|
|
|
|
|
|
|
|
|
|
|
||||
|
|
|
|
|
|
|
|
|
|
|
|
|
|
||||||||
|
|
|
40% |
|
|
|
|
|
|
|
|
|
|
|
|
|
|||||
|
|
|
|
|
|
|
|
|
|
|
|
|
|
|
|
|
|||||
|
|
|
|
|
|
|
|
|
|
|
|
|
|
|
|
|
|
|
|
|
|
China |
199% |
|
|
|
|
|
|
||||||||||||||
|
|
|
267% |
|
|
||||||||||||||||
|
|
|
|
|
|
||||||||||||||||
Japan |
-22%- |
|
|
7% |
|
|
|
|
|
|
|
|
|
|
|
|
|
||||
|
|
|
|
|
|
|
|
|
|
|
|
|
|
|
|||||||
|
|
|
|
|
|
|
|
|
|
|
|
|
|
|
|||||||
|
|
|
|
|
|
|
|
|
|
|
|
|
|
|
|
|
|
||||
|
|
|
|
|
|
|
|
|
|
|
|
|
|
|
|
|
|
|
|
|
|
South Korea |
51% |
|
|
|
|
|
|
|
|
|
|
|
|
||||||||
|
|
|
83% |
|
|
|
|
|
|
|
|
|
|
|
|||||||
|
|
|
|
|
|
|
|
|
|
|
|
|
|
|
|||||||
Germany |
- -1% |
|
|
|
|
|
|
|
|
|
|
|
|
|
|
|
|
|
|||
|
|
|
|
|
|
|
|
|
|
|
|
|
|
|
|
|
|||||
|
|
|
27% |
|
|
|
|
|
|
|
|
|
|
|
|
|
|
||||
|
|
|
|
|
|
|
|
|
|
|
|
|
|
|
|
|
|
||||
|
|
|
|
|
|
|
|
|
|
|
|
|
|
|
|
|
|
|
|
|
|
-50% 0% 50% 100% 150% 200% 250% 300%
Source: IFR, Oxford Economics
Dark bar=Automotive sector Light bar=Other sectors
16 |
9 Figures may be subject to upward bias by a trend in robot sales toward smaller installations |

vk.com/id446425943
How Robots Change the World
Trend #3: Demand for manufactured goods is rising, and China is investing in robots to position itself as the global manufacturing leader
Much of the growth in robot stock over the past decade can be attributed to rising demand for manufactured goods. China is at the heart of this change: it has become the world’s largest automotive manufacturing site, and a major producer of consumer electronic devices, batteries, and semi-conductors—
all highly robot-intensive manufacturing sectors.
This trend is set to continue, as China is still only at the beginning of its automation
journey. Despite its rapidly growing inventory, China only uses 68 robots per 10,000 workers in general manufacturing, compared with 303 per 10,000 in Japan, and 631 per 10,000 in South Korea. The imbalance between stock and density is shown in Fig 5. Large sections of China’s workforce are still engaged in manual processes, meaning vast potential remains for further robotization of its manufacturing sector—moreso than in any other country.
With government policies aimed at expanding the use of electric vehicles (which will require largescale battery production),
and the establishment of high-tech manufacturing, we expect China will likely continue its acceleration in robot investments for the next decade. By 2030, if the
investment in industrial robots continues to grow at its current trajectory, China will have close to eight million industrial robots in use, as its robot density approaches levels comparable with the average across the European Union.10
Fig. 5: Chinese scope for catch-up in robot density (2016)
Column=Robots per 10,000 workers (LHS)
Stock of robots in manufacturing (RHS)
1,000 |
|
|
|
|
|
300,000 |
|
900 |
|
|
|
|
|
250,000 |
|
800 |
|
|
|
|
|
||
|
|
|
|
|
|
||
700 |
|
|
|
|
|
200,000 |
|
600 |
|
|
|
|
|
||
|
|
|
|
|
|
||
500 |
|
|
|
|
|
150,000 |
|
400 |
631 |
|
|
|
|
100,000 |
|
300 |
|
|
|
|
|||
200 |
|
309 |
|
303 |
|
50,000 |
|
100 |
|
189 |
|
||||
|
|
|
68 |
|
|||
0 |
|
|
|
|
0 |
||
South Korea |
Germany |
United States |
Japan |
China |
|||
|
|
Source: IFR, Oxford Economics
10 2030 projections based on short-term International Federation of Robotics forecasts, controlling for longer-term stock depreciation. |
17 |
vk.com/id446425943