

JPM_Global Asset Allocation_watermark
.pdfvk.com/id446425943
Nikolaos Panigirtzoglou |
John Normand |
(44-20) 7134-7815 |
(44-20) 7134-1816 |
nikolaos panigirtzoglou@jpmorgan.com john.normand@jpmorgan.com
Marko Kolanovic, PhD (1-212) 272-1438
marko.kolanovic@jpmorgan.com
Equities Trading Themes
Open long in Brazil vs. South Africa
Brazil: Change of macro policy direction after four consecutive terms of the same party in power paves the way to solid earnings expansion of at least 20% (coming from a high base). The new liberal guideline should provide opportunity for faster growth, driven especially by investments. A still relatively low interest rate environment and a lower cost of doing business provide ample room for pick-up in investments. Progress on the reform agenda that seeks fiscal consolidation – despite noisy implementation – should allow for re-rating. Consistent growth important to face off higher interest rates (225bp in 2019). Overlooking the fiscal consolidation agenda could be FX disruptive on a risk-off global scenario. We see Brazilian companies as lean, facing less competition and having more cash ready to be deployed.
South Africa: Structurally low economic growth with no forecast of a sharp cyclical rebound is a key factor in our UW call. Valuations are low across most of EM, so low South African valuations do not make a compelling relative case. Revisions continue to run negative, further undermining the valuation story. Likely further hikes from the SARB and the Fed imply PE multiples broadly de-rating. Roughly a third of the MSCI South Africa index is dependent on the Chinese internet, where the outlook remains bearish. The bull case for domestic stocks today is that 2019 elections drive reform legislation, which pushes up GDP and earnings growth only in 2020, too long and uncertain a time for us to wait. While weak growth hits nominal ZAR earnings, our forecast of a weaker ZAR makes them look worse in USD terms.
Pedro Martins Jr., CFAAC
(55-11)4950-4121 Banco J.P. Morgan S.A.
Long EM vs DM
We entered the year with a non-consensus cautious EM view, but believe EM will outperform in 2019. EM equities have performed poorly in 2018, down 25% from January highs, and are trading cheap again in the historical context, with lower P/E than even at the worst point in ‘15-’16 episode. EM equities tended to have a very strong inverse correlation to USD, which could be peaking out – speculative positions have gone from outright short USD at the start of the year to top of the range long. At the same time, we see limited risk of a hawkish Fed surprise. If the Fed were to open the doors to
Global Cross-Asset Strategy
07 December 2018
skipping some quarterly hikes, this would be a major positive for the EM. Trade escalation remains a concern, but we do not believe it should be seen as the inevitable outcome, especially if the US growth and equity performance are not diverging from the RoW anymore. Chinese policy response is stepping up, and provides a natural offset. (Matejka et al., Equity Strategy: Year Ahead 2019 - Countering the bears, Dec 2).
Given the binary nature of the outcome from trade negotiations (and inexpensive EM volatility), we continue to recommend positioning for the outperformance of EM and convergence between US and EM equities via limited-loss option structures. In particular, we recommend buying calls on the outperformance of EEM over the S&P 500 to play this theme (see 2019 Equity Derivatives Outlook, Dec 7)
Mislav MatejkaAC (44-207) 134-9741
J.P. Morgan Securities plc
Marko KolanovicAC (1-212) 272-1438
J.P. Morgan Securities LLC
Bram KaplanAC (1-212) 272-1215
J.P. Morgan Securities LLC
Stay long Euro area vs. UK equities
UK is a defensive, high-dividend yielding market which might have a problem if bond yields move sustainably higher, and if global equities advance, as we expect. We look for stronger GBP, which would weigh on the performance of FTSE100. In fact, we believe GBP could end up as a “lose-lose” proposition, as in the case of GBP gapping lower due to political tail risks materialising, the traditional inverse correlation with equities might break down. In contrast, Eurozone equities are supported by the above-average operating leverage and weak positioning. Our economists are looking for Eurozone growth to pick up in 2019. We think Italian political considerations are a problem; however, the resulting weakness in the Euro should help mitigate some of the negative impact. (Matejka et al., Equity Strategy: Year Ahead 2019 - Countering the bears, Dec 2).
Mislav MatejkaAC (44-207) 134-9741
J.P. Morgan Securities plc
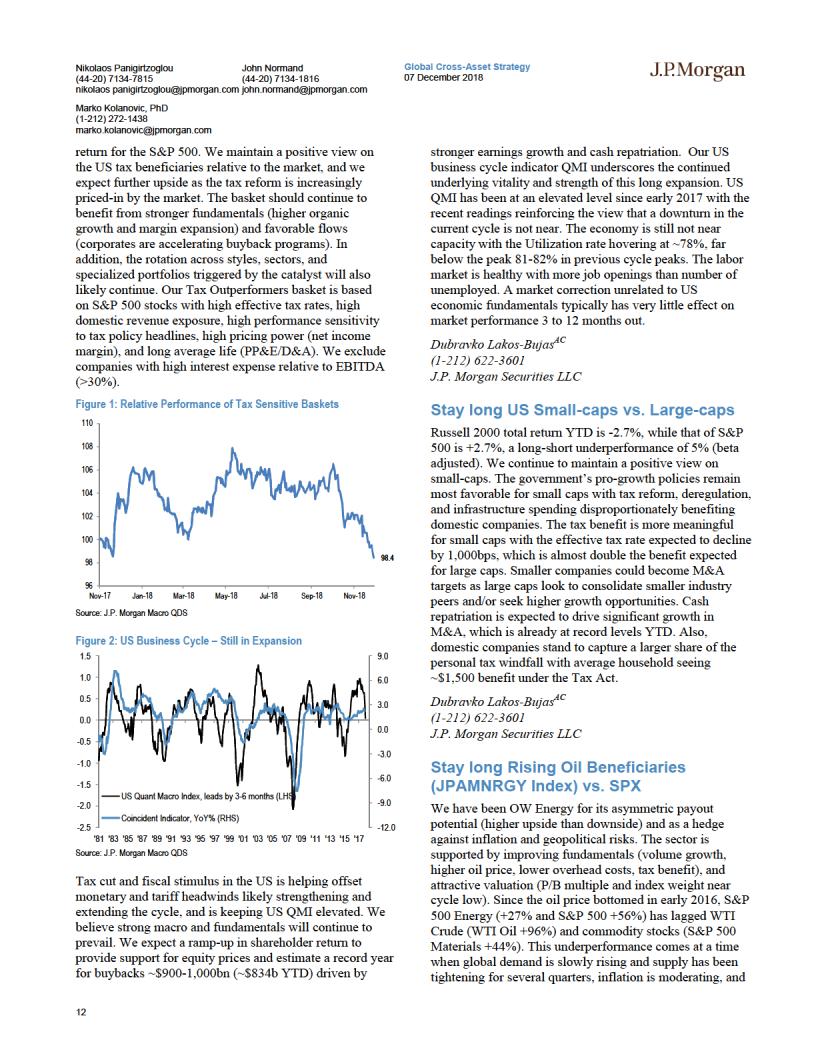
Stay long US Tax Outperformers vs. SPX
The Tax Outperformer basket (JPAMTXO3) is up 4.5% since launch (Nov 8, 2017) compared with 6.2% total
11
vk.com/id446425943
vk.com/id446425943
vk.com/id446425943

vk.com/id446425943
Nikolaos Panigirtzoglou |
John Normand |
Global Cross-Asset Strategy |
(44-20) 7134-7815 |
(44-20) 7134-1816 |
07 December 2018 |
nikolaos panigirtzoglou@jpmorgan.com john.normand@jpmorgan.com
Marko Kolanovic, PhD (1-212) 272-1438
marko.kolanovic@jpmorgan.com
Fixed Income Trading
Themes
Slowing callable supply is bullish for USD vega; a pullback in HFT activity could accelerate a regime shift
One potential accelerant for interest rate volatility is the risk of a pullback in liquidity provided by principal trading firms via high frequency trading (HFTs). In a recent publication our colleagues find evidence that these participants make up the majority of trading in interdealer Treasury markets (see Fast and Furious, M. Salem et al.). Further, they show that their activity is a significant determinant of the price impact of an imbalanced flow, even after adjusting for the proportion of buyers versus sellers and depth of the market. In this way, HFT activity tends to reinforce the current volatility regime: stabilizing markets in times of plenty, and contributing to disorder when vol spikes. To the extent the latter continues, a pullback in liquidity provision by these firms could reinforce a vicious-cycle dynamic, bullish for vol.
In U.S. rates vol, we believe longer expiries offer the best relative value, and should outperform in a vol spike for a number of reasons. First, pricing in this sector is determined largely by supply owing to callable bond issuance, particularly to Taiwanese investors. Given regulatory changes in the region, their appetite is likely to be much smaller going forward. Second, the risk dynamics of exposures warehoused by the dealer community should make them a forced buyer of longer expiries in the event of a material move in rates. Finally, in addition to trading near the cheap end of their historical range, given the shape of the U.S. rates volatility surface, these structures exhibit much less punitive carry than longs in shorter expiries. In particular, we like 5Yx30Y straddles as an attractive way to add long volatility risk that should outperform in the even markets remain disorderly. For more details, please see the 2019 Interest Rate Derivatives Outlook.
Joshua YoungerAC (+1) 212 270-1323
J.P. Morgan Securities LLC
Munier SalemAC (+1) 212 270-0317
J.P. Morgan Securities LLC
Buy Bund straddles
We recommend long Mar19 Bund straddles as a positive convex hedge against further escalation of risk sentiment
in the Euro area. As discussed in our 2019 Outlook, we expect Euro area implieds to be driven by Yields and Peripheral spreads (primarily by the BTP/Bund spread). We have a short duration bias on the German curve and a widening bias on the 10Y BTP/Bund spread. Bund implieds exhibit positive correlation to both these factors and we therefore expect a pick-up in implieds. Exhibit V5 shows our forecast for Bund implied volatility for various combinations of Bund invoice yield and 10Y BTP/Bund spread. Our forecast for Bund implieds at the end of 1Q19 is highlighted in the grey box. In addition, over the short term, we note any rise in risk aversion will also support a rise in implieds and delivered volatility.
Figure 1: Over the medium term, we expect Bund implieds to rise on the back of rising Bund yields and widening BTP/Bund spread
Fair value estimate for Bund implied volatility under various scenarios for Bund invoice yield* and 10Y BTP/Bund spread**; bp/day
|
|
|
|
Bund invoice yield*; % |
|
|
|||
|
|
|
|
|
|
|
|
|
|
|
|
0.1 |
0.2 |
0.3 |
0.4 |
0.5 |
0.6 |
0.7 |
|
|
|
|
|
|
|
|
|
|
|
|
200 |
2.1 |
2.4 |
2.6 |
2.9 |
3.1 |
3.4 |
3.6 |
|
bp |
225 |
2.3 |
2.5 |
2.8 |
3.0 |
3.2 |
3.5 |
3.7 |
|
|
|
|
|
|
|
|
|
||
spread; |
250 |
2.4 |
2.7 |
2.9 |
3.1 |
3.4 |
3.6 |
3.9 |
|
275 |
2.6 |
2.8 |
3.1 |
3.3 |
3.6 |
3.8 |
4.1 |
||
BTP/Bund |
300 |
2.8 |
3.0 |
3.3 |
3.5 |
3.8 |
4.0 |
4.2 |
|
|
|||||||||
|
325 |
3.0 |
3.2 |
3.5 |
3.7 |
4.0 |
4.2 |
4.5 |
|
10Y |
350 |
3.2 |
3.5 |
3.7 |
3.9 |
4.2 |
4.4 |
4.7 |
|
375 |
3.5 |
3.7 |
4.0 |
4.2 |
4.4 |
4.7 |
4.9 |
||
|
|||||||||
|
400 |
3.7 |
4.0 |
4.2 |
4.5 |
4.7 |
5.0 |
5.2 |
|
|
|
|
|
|
|
|
|
|
|
Source: J.P. Morgan. The projections use the following model: Y = 2 5*(Bund yield) - 0.0016*(10Y BTP/Bund spread) + 1.6e-5 (10Y BTP/Bund spread) - 0.007*(Bund market depth) + 2.3; R2 = 65%; SE = 0.2bp/day. * Using Bund invoice yield (the CTD forward yield corresponding to futures price) which is around 5bp lower versus 10Y German b/m bond yield. ** We assume that market depth will remain around €100mn equivalent.
Khagendra GuptaAC (44-207) 134-0486
J.P. Morgan Securities plc
Add tactical longs in GBI-EM Brazil and Indonesia
The more dovish tone taken by the Fed reduces pressure on EM economies from dollar rates and currency appreciation, and the decline in oil prices since early October has reduced inflationary pressures and reduced pressure on EM central banks to tighten policy rates. This means that in the near term we see a tactical opportunity to hold OW exposure to higher yielding EM countries. Brazil local market bonds are supported by a better external environment and improving domestic sentiment, and the incoming administration has laid out market-friendly policies thus far (Brazil: The case for staying long BRL, Carranza et al, Dec 3). In Indonesia,
15

vk.com/id446425943
Nikolaos Panigirtzoglou |
John Normand |
Global Cross-Asset Strategy |
(44-20) 7134-7815 |
(44-20) 7134-1816 |
07 December 2018 |
nikolaos panigirtzoglou@jpmorgan.com john.normand@jpmorgan.com
Marko Kolanovic, PhD (1-212) 272-1438
marko.kolanovic@jpmorgan.com
inflation remains firmly anchored and our EM team’s sovereign health score is supportive, and domestic insurers are a stabilising force for local bonds (EM Asia Local Markets Compass, Shridharan et al, Dec 6).
That said, we note that we see this as more of a near-term opportunity for 1Q19, as beyond that cyclical headwinds on EM economies in the form of rising US real yields and continued liquidity withdrawal from G3 central banks should reassert themselves. Moreover, given higher EM leverage, there appears less scope for fiscal and credit stimulus to offset an eventual turning in the US cycle (EM’s debt burden is back in focus, Goulden et al, Nov 15).
Mika InkinenAC (44-207) 742-6565
J.P. Morgan Securities plc
Stay short 30y Germany, and keep Schatz-swap spread widener as a hedge
The tone in the euro area economic data flow has undoubtedly been on the softer side in recent months, though the weakness in activity indicators has occurred against a backdrop of stronger labor market data (Euro area: wage growth is ‘vigorous’, Fuzesi, Dec 6). We still see growth picking up in coming quarters to an average 2% or above pace, and retain a bearish outlook on duration expressed via 30y Germany to minimize the negative carry and slide.
That said, the shifting headlines on Italian political risks over the last few months warrant some ongoing hedges. We do not see a significant change to the Italian government’s fiscal approach in the very near term, and see its conflict with the European Commission to be a low-intensity one but with periodic flare-ups (Italy: GDP contracted in 3Q18 as all data point to a prolonged confidence shock from political uncertainty, Protopapa, Nov 8). As a result, we recommend keeping Schatz-OIS swap spread wideners as a hedge against further flare-ups of Italian political risk.
P&L: Short 30Y; -13bp since Oct GAA, -21bp since Jun18. Schatz swap spread widener; +6bp since Oct GAA; -1bp since Jun18.
Mika InkinenAC (44-207) 742-6565
J.P. Morgan Securities plc
Stay short 2y USTs, keep 10s/30s flatteners
Our duration outlook over the medium-term remains bearish given an economic growth backdrop that remains supportive. We see growth moderating somewhat over
coming quarters, but to still-above trend levels. This in turn means that there should be continued tightening pressure on a labor market already at full employment.
That said, the recent data flow has been somewhat softer, and the rise in jobless claims is suggestive of some loss of growth momentum. In addition, the tone adopted by Fed Chair Powell last week appeared more dovish, with a shift in emphasis in the language around how close policy rates are to neutral. In terms of substance, however, the shift from “well below neutral” to “just below a range of estimates of neutral” is less meaningful (Powell Pianissimo, Feroli, Nov 28). We see the rally in recent weeks also driven partly by position unwinds ahead of a seasonally weak period for risk appetite and liquidity into year-end.
But while the shift in tone, combined with the somewhat softer recent inflation prints, means risks are skewed to the downside on our call for four hikes in 2019, after the rally over the past week Fed funds futures now appear to be pricing in less than one hike for 2019. In addition, the waning of foreign demand for USTs would tend to disproportionately affect the front-end of the curve as around two-thirds of foreign UST holdings are at maturities less than 5 years (Things ain’t what they used to be, Barry et al, Oct 22).
Even as we see front-end yields rising by more than forwards, we see the longer-end of the curve supported traditional Fed tightening dynamics as well as by more benign expectations about long-run neutral rates and term premia and LDI-related demand from pension funds.
P&L: Short 2Y -7bp since Oct GAA, +86bp since Dec17; 10s/30s flatteners: -11bp since Oct GAA, -12bp since Sep18.
Jay BarryAC (1-212) 834-4951
J.P. Morgan Securities LLC
Mika InkinenAC (44-207) 742-6565
J.P. Morgan Securities plc
Keep longs in 3y Australia
We recommend keeping outright bullish duration exposure to the front-end of the ACGB curve. While the RBA’s economic outlook has remained optimistic, the recent domestic data flow has been on the softer side and risks to the global growth outlook have shifted to the downside. In addition, there are a number of ongoing factors that are exerting tightening pressure on credit conditions: 1) the ongoing Banking Royal Commission has seen an increased scrutiny on mortgage applicants’ incomes and expenses as a result of revelations over past
16

vk.com/id446425943
Nikolaos Panigirtzoglou |
John Normand |
(44-20) 7134-7815 |
(44-20) 7134-1816 |
nikolaos panigirtzoglou@jpmorgan.com john.normand@jpmorgan.com
Marko Kolanovic, PhD (1-212) 272-1438
marko.kolanovic@jpmorgan.com
lending practices; 2) ongoing pressure on bank margins is putting upward pressure on mortgage rates independent of monetary policy; and 3) APRA has shifted its attention to limits on debt-to-income ratios, which could be a powerful tool to anchor credit growth to income growth. Regional growth dynamics are also looking less positive, given the weakness in the PMI suggest growth momentum in China has remained on the soft side and the fiscal policy response to trade tensions looks set to focus more on tax cuts than infrastructure investment (November NBS manufacturing PMI eased further, Ng et al, Nov 29). While the recent G20 meeting saw a ‘truce’ reached on the US-China trade conflict, but we this truce as temporary rather than a first step in easing tensions (Another temporary truce, Zhu et al, Dec 2).
This means that we are confident in our view that the RBA will be on hold for the foreseeable future, and while the hurdle for further easing remains high the risk bias on policy rates has shifted more to the downside.
P&L on long 3Y ACGBs: +7bp since Oct GAA, +26bp since May18.
Sally AuldAC (61-2) 9003-7904
J.P. Morgan Securities Australia Limited
Mika InkinenAC (44-207) 742-6565
J.P. Morgan Securities plc
Cross-market rule-based signals: long 10y SEK and EUR vs. CAD and GBP swaps
We update our regular suite of rule-based signals for outright and cross-market fixed income trading in the Appendix.
The changes in our cross-market signals were relatively modest this month. The outperformance of USD and CAD swaps, and relative underperformance of NZD swaps, meant that NZD swaps are again one of the highest ranking markets. Similarly, the relative AUD underperformance meant that it is no longer one of the lowest carrying markets.
We still exercise a degree of discretion on our signals by excluding JPY swaps given the BoJ’s explicit 10y yield target. This means we replace JPY swaps with the next lowest carrying market (USD swaps this month). As the real yield signal has produced flattish returns thus far this year, we focus on the carry-based signals, leaving our signals pointing to longs in 10y SEK and EUR swaps vs. CAD and GBP swaps.
Global Cross-Asset Strategy
07 December 2018
P&L since October: -0.2%; cumulative return since Feb18: +2.8%.
Mika InkinenAC (44-207) 742-6565
J.P. Morgan Securities plc
17

vk.com/id446425943
Nikolaos Panigirtzoglou |
John Normand |
Global Cross-Asset Strategy |
(44-20) 7134-7815 |
(44-20) 7134-1816 |
07 December 2018 |
nikolaos panigirtzoglou@jpmorgan.com john.normand@jpmorgan.com
Marko Kolanovic, PhD (1-212) 272-1438
marko.kolanovic@jpmorgan.com
Credit Trading Themes
Stay long US HY vs. US HG bonds
We expect high yield to outperform high grade bonds in 2019, despite a second year of below-coupon performance as we see an increase in both HY spreads and in UST yields, as the continued supportive growth backdrop and expectations of well below average default rates are supportive for HY. By contrast, we see very low returns in HG corporates, as carry returns are offset by the rise in UST yields and HG spreads. In terms of fundamentals, we see positives for credit from solid economic growth and corporate revenues, and rising yields supporting long-end demand from asset managers, largely offset by negatives in the form of greater UST supply (both from increased deficits and Fed balance sheet normalization), modest demand from foreign investors given rising hedging costs, and concerns over the potential for margin pressure going forward.
Lixin BaoAC (1-212) 834-4565
J.P. Morgan Securities LLC
Stay long US HY Loans vs. Cash
We see the floating rate loan asset class as an attractive allocation within fixed income in an environment of rising rates, and expect continued retail and institutional demand. Moreover, we see default rates remaining modest in 2019 at around 1.5%, well below long-term averages at 3-3.5%. The low correlation of loans to other asset classes also means loans are attractive for portfolio diversification purposes, despite the lack of price appreciation potential given the inability to price much above par due to issuers’ ability to prepay loans and a lack of call protection. In addition, the high yield on loans provides a hefty cushion against a rise in spreads.
Lixin BaoAC (1-212) 834-4565
J.P. Morgan Securities LLC
Stay OW Short Duration within US HG
Short duration US HG credit continues to offer attractive yield, which is an attractive low credit risk alternative compared to the longer-dated and higher-duration US HG bond benchmark. Riskand duration-adjusted carry for 1- 3yr tenor are comparably much more attractive. Flattening yield curve has pushed up FX hedging costs for foreign investors who are not compensated for equally higher longend yields, so foreign demand on long-duration HG bonds has declined as FX-hedged yield pickups remain low. We
thus expect continued stronger demand at short-end for US HG investors.
Lixin BaoAC (1-212) 834-4565
J.P. Morgan Securities LLC
Close Euro HY vs. EM Sovereign Credit
We close the trade as the prospect of a delay in further escalation in the US-China trade conflict, as well as the more dovish tone by the Fed that removes some near-term pressure on EM external financial conditions, provides a more supportive backdrop for EM assets.
Lixin BaoAC (1-212) 834-4565
J.P. Morgan Securities LLC
18

vk.com/id446425943
Nikolaos Panigirtzoglou |
John Normand |
Global Cross-Asset Strategy |
(44-20) 7134-7815 |
(44-20) 7134-1816 |
07 December 2018 |
nikolaos panigirtzoglou@jpmorgan.com john.normand@jpmorgan.com
Marko Kolanovic, PhD (1-212) 272-1438
marko.kolanovic@jpmorgan.com
FX Trading Themes
Hedge European political risks via EUR/USD 6M6M FVAs
The busy calendar of elections and political events in Europe for next year should ensure politics remains at least an intermittent, negative focus for EUR in 2019 (see EUR: A narrow path from mediocrity to equality in the Global FX Strategy 2019 Outlook). In addition to continuing skirmishes between Rome and Brussels, the proximate market focus will be the elections to the European parliament in May where indications are that the region’s populists could do considerably better than the last elections in 2014, with a decent possibility that Macron’s REM party could cede to the rechristened RN party under Le Pen.
Sub-8.0 1Y Euro vols and flat vol curves (1Y – 6M 0.1) appear apathetic to the prospect of pricing in any political risk premium however given the narrow ranges for spot in recent months (6-mo realized vols ~ 6.4). Buying 6M6M FVAs along the flat curve is in our view the cleanest, least management heavy way of guarding against a sudden spike in European political risk.
The forward volatility structure handsomely outperforms long straddles in the long-run primarily by avoiding time decay costs by virtue of its calendar set-up (short 6M vs. long 1Y, ~gamma-neutral). The trade would naturally benefit from a structural rise of FX volatilities from current benign levels, a theme we explore in the FX Volatility: Late-cycle anxiety is not in the price section of the 2019 FX Outlook. We recommend buying a EUR/USD 6M6M FVA at 8.2% vols.
Arindam SandilyaAC (65-6) 882-7759
JPMorgan Chase Bank, N.A., Singapore Branch
Lorenzo RavagliAC (44-207) 882-7759
J.P. Morgan Securities PLC
EUR/CNH risk-reversals as US/China conflict hedge
To protect against further Chinese currency depreciation, in October we recommended EUR/CNH risk-reversals, carry-neutral, long delta construct: long 6M 8.41 vs. 7.89 strike risk-reversal (indic vols. 6.53/6.94 vs 6.61 choice) in €100mio/leg vs. short €35mn notional of 6M forward. The current MTM shows the construct to be at -29bps EUR. In our mind, EUR/CNH risk-reversals were a
better-value alternative to USD/CNH as a hedge against an intensification of trade tensions. As an underlying, EUR/CNH is a credible stand-in for the CNY TWI given the Euro’s 16% direct weight in the CFETS basket as well as its positive correlation to other basket constituents. How useful is EUR/CNH as a RMB weakness play? Using the sell-off in the currency since the first batch of tariffs in June as a guide, EUR/CNH rose ~6% alongside the ~9% trough-to peak rally in USD/CNH, so a beta of ~0.7x. 1Y 25D EUR/CNH risk-reversals however priced at a paltry 0.35, much narrower than corresponding USD/CNH riskies around 1.35. We suspect that much of the non-responsiveness of EUR/CNH skews this year owes to the above-average bid for EUR puts in general, reflecting the option market’s nervousness around the Italian budget. Such skittishness explains why other EUR/Asia risk-reversals are also priced near 5-yr tights (e.g. EUR/KRW).
Levels aside, there is a strong case to be made for EUR/CNH skews being too low relative to the substantial carry in forward points. The net static bleed of deltahedged 1Y 25D EUR/CNH risk-reversals is strongly positive since the large positive carry of the short EUR/CNH forward delta hedge (due to both EUR and CNH points) far outstrips the small premium decay on the risk-reversal. This carry RV can be exploited in a number of ways. Vol investors not inclined to assume delta risks at inception but only exposure to pure convexity can buy the fully delta-hedged risk reversal and earn positive carry for doing so. Directional investors desiring outright short CNH exposure need only dial down the notional of the delta hedge to an acceptable ratio such that time decay on naked risk-reversals are partly or wholly neutralized by the carry on the forward.
Arindam SandilyaAC (65-6) 882-7759
JPMorgan Chase Bank, N.A., Singapore Branch
Ladislav JankovicAC (1-212) 834-9618
J.P. Morgan Securities LLC
Long USD/JPY and USD/SEK; Short NZD/USD, AUD/JPY and EUR/GBP
This section combines our pre-existing tactical trades together with indicative strategic trades for some of the substantive and more durable global macro issues that we expect to play out through 2019.
There are fewer strategic trades than is typical for an annual outlook because we are not convinced that current timing is ideal to for some of the more significant strategic opportunities that we see for 2019, in particular, the end-of-cycle stress in high-beta currencies more broadly
19

vk.com/id446425943
Nikolaos Panigirtzoglou |
John Normand |
Global Cross-Asset Strategy |
(44-20) 7134-7815 |
(44-20) 7134-1816 |
07 December 2018 |
nikolaos panigirtzoglou@jpmorgan.com john.normand@jpmorgan.com
Marko Kolanovic, PhD (1-212) 272-1438
marko.kolanovic@jpmorgan.com
and a selective reversal of dollar strength against reserve currencies. High-beta currencies could recover a little further through year-end, especially if the December G20 meeting validates hopes for a truce if not yet an end to USChina trade conflict, while there is insufficient justification for a Fed pause or evidence of a bounce in growth outside the US to suggest that a multi-month downtrend in the dollar against reserve currencies is yet at hand. We therefore await better levels to initiate late-cycle defensive trades more broadly and better global data to initiate a broader range of strategic dollar shorts. The new trades that we do include in this outlook are structured to earn static carry (short AUD/JPY through a calendar spread of one-touches) or mitigate time decay (short USD/SEK through a ratio put spread) to reflect the lack of tactical momentum in these key strategic themes. Details are available in our year-ahead global FX outlook (Global FX Strategy 2019: Late-cycle Dollar Divergence, Meggyesi et al).
1) A restrictive Fed will fuel end-of-cycle neurosis
The portfolio has been modestly long USD in recent months, most recently though a barbell against high and low-beta currencies to isolate the central issue of strong US growth and rising yields and to insulate against the swings in equities. We acknowledge that momentum in US macro data has waned, but then again the economy continues to grow above 3.5%, which seems inconsistent with an end to the Fed cycle at 2.75% next year as is now priced. The Fed will naturally become more data dependent as it approaches neutral, but that's not synonymous with pausing at neutral, certainly not if growth remains above trend. We are thus not convinced that the broad dollar is yet at an inflexion point and so hold our existing USD longs, albeit both are currently in the red and the NZD option too far out of the money to be able to make a comeback.
We add a new defensive trade through a calendar spread in bearish AUD/JPY one-touches (short 3M, long 6M) with premium rebate if the strike is hit within 3M. The yen is quite a sluggish recession hedge historically, appreciating only once a US recession gets underway. We nevertheless view JPY as viable hedge to late-cycle stress as it’s never been this cheap at the tail-end of an expansion (REER is 21% below its 20Y average). The calendar spread provides attractive stand-still carry as the market is likely to remain USD-centric through coming months and the yen will likely continue to struggle with the pull from higher
US rates (the structure rolls up to 58.4% in 3-months’ time).
Long USD/JPY from 113.60 on September 28th.
Short NZD/USD though a AED digital put (strike of 0.6195, expiry 24th January, 2019).
AUD/JPY: Short 3M 78.50 strike OTs in AUD 1mio payout vs. Bought 6M 78.50 strike OTs in AUD 1.4085 mio payout for net premium 40.85% on November 21.
2) Planning for the eventual Fed pause - the dollar after the Fed’s cycle ends
The big dollar turn is not, in our view, imminent. Nevertheless, the base case for 2019 does envisage a handover from US to Euro area growth and meanreversion in undervalued European FX. SEK screens as the cheapest European currency (REER 14% below 20Y average) and also has a central bank that is poised to slowly reverse its multi-year experiment with super easy monetary policy. We consequently add a medium-term put spread in USD/SEK, but structure it as a 1-1.5x to reflect the lack of immediate tactical conviction in the view.
Buy a 6M 8.55-8.15 USD/SEK ratio put spread in 1x1.5 notional for net premium of 76bp (spot ref: 9.0150) on November 21.
3) The era of globally relevant political risks does not fade, just evolves
Brexit is the most extreme source of idiosyncratic FX risk. We stay short EUR/GBP through a ratio put spread, albeit the trade may expire before parliament approves the
withdrawal treaty, which may only occur at the second time of asking in early January. In addition, the recent ECJ opinion allows for the UK to unilaterally revoke its Article 50 negotiation reduces the tail risk around a cliff-edge scenario and raises the probability of the ‘no Brexit’ scenario. Expiry on the trade is quite tight at 3rd January, but we feel the trade is worth holding onto following the unexpected boost to No-Brexit probabilities from the ECJ opinion (A Brexit volte-face for markets?, Diamond, Meggyesi et al).
Stay short EUR/GBP through a 1x2 put spread (0.87- 0.8550 with an RKI of 0.84 on the lower strike. Expiry 3rd January 2019).
4)Bullish CHF closed out in beginning of October, refer to FX weekly for more details.
Paul Meggyesi AC (44-207)134-2714
J.P. Morgan Securities plc
Meera Chandan AC (44-207) 134-2924
J.P. Morgan Securities plc
20