

JPM_Global Asset Allocation_watermark
.pdfvk.com/id446425943
vk.com/id446425943
vk.com/id446425943
vk.com/id446425943

vk.com/id446425943
Nikolaos Panigirtzoglou |
John Normand |
Global Cross-Asset Strategy |
(44-20) 7134-7815 |
(44-20) 7134-1816 |
07 December 2018 |
nikolaos panigirtzoglou@jpmorgan.com john.normand@jpmorgan.com
Marko Kolanovic, PhD (1-212) 272-1438
marko.kolanovic@jpmorgan.com
Optimized Portfolio
We update here our portfolio optimization analysis, which uses as an input the 12-month ahead return expectations of J.P. Morgan strategists across different asset classes. These expected returns, shown in Table 1, reflect our medium-term views, incorporating the economic outlook, value and other fundamentals. We then use this portfolio optimization exercise as a guidance and cross-check to our discretionary model portfolio.
In order to avoid extreme allocations (corner solutions) that simple mean-variance optimization techniques are vulnerable to, we focus on only ten asset classes and use the Black-Litterman approach1. We look at four equity markets (US, Europe, Japan and EM), two government bond markets (DM currency-hedged to USD and EM local bonds in USD), two corporate bond markets (global high-grade and global high-yield), DXY vs. USD and commodities. FX returns show up in equities, DXY returns and EM local bonds, which are unhedged in USD. Our benchmark neutral weights in Table 1 reflect our assessments of market outstanding in round numbers. Table 2 shows the correlation matrix based on the past five years of returns.
Table 1: Inputs into our reference portfolios
Total returns based on the expected 12m returns which reflect our views, and volatility based on monthly returns since 2013.
|
neutral |
Ex pected 12m |
Annualised |
|
w eights |
Total return |
Historical v ol. |
|
|
|
|
US equities |
30% |
17% |
12% |
EM equities |
5% |
16% |
18% |
Europe equities |
10% |
16% |
15% |
Japan equities |
5% |
2% |
15% |
Gov t |
20% |
-2% |
4% |
HG |
18% |
-1% |
5% |
HY |
5% |
3% |
8% |
GBI EM |
3% |
1% |
10% |
DM FX |
3% |
1% |
7% |
Commodities |
3% |
1% |
17% |
|
|
|
|
Source: J.P. Morgan
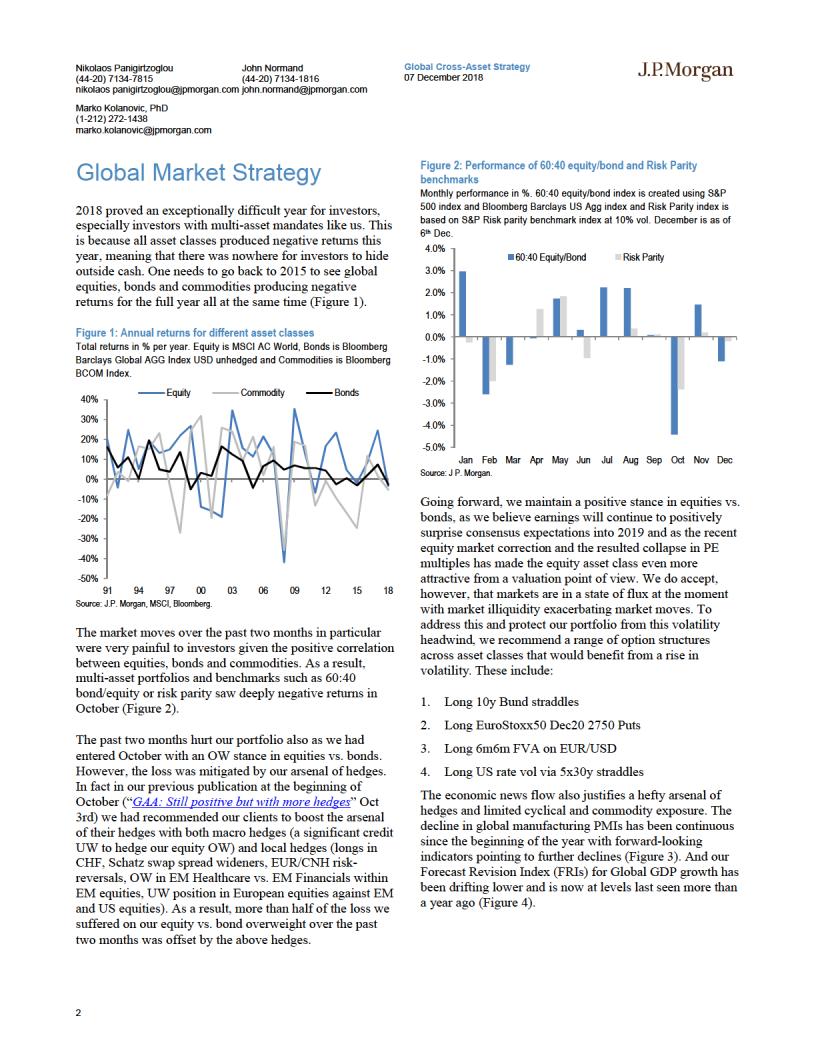
Corrections in equities in early February and since the start of October have seen global equities decline by around 2.3% YTD. This combined with strong earnings,
particularly in the US, means valuations are looking less challenging for the year ahead, and we expect global equities to deliver around 13-16% total returns with the exception of Japan, where we see low-single-digit returns. For DM government bonds, we expect negative total returns on a combination of continued above-trend growth and tightening in labor markets. For EM local market bonds, we expect modestly positive returns on a currencyunhedged basis, with positive carry returns offset by negative currency returns. For HG corporate bonds, we expect modestly negative returns given higher government bond yields and a widening in corporate bond spreads, while for HY corporates, the higher carry should more than offset rises in yields. For commodities, we see modestly positive returns, while for DM FX vs. USD we expect flattish returns as currency appreciation will be largely offset by negative carry based on our 12-month ahead FX forecasts and cash yields for DXY-constituent currencies.
Table 2: Correlation matrix
Monthly correlation of excess returns across asset classes since 2013
|
US eq |
EM eq |
EU eq |
Jap eq |
Govt |
HG |
HY |
GBI EM |
DXY |
Commod |
US eq |
1.0 |
0.7 |
0.7 |
0.5 |
-0.1 |
0.0 |
0.3 |
0.3 |
-0.1 |
0.3 |
EM eq |
0.7 |
1.0 |
0.7 |
0.5 |
0.0 |
0.0 |
0.2 |
0.7 |
0.1 |
0.4 |
EU eq |
0.7 |
0.7 |
1.0 |
0.5 |
0.0 |
0.0 |
0.3 |
0.5 |
0.2 |
0.3 |
Jap eq |
0.5 |
0.5 |
0.5 |
1.0 |
0.0 |
0.0 |
0.3 |
0.3 |
0.0 |
0.2 |
Govt |
-0.1 |
0.0 |
0.0 |
0.0 |
1.0 |
0.9 |
0.2 |
0.2 |
0.1 |
-0.1 |
HG |
0.0 |
0.0 |
0.0 |
0.0 |
0.9 |
1.0 |
0.4 |
0.2 |
0.2 |
-0.1 |
HY |
0.3 |
0.2 |
0.3 |
0.3 |
0.2 |
0.4 |
1.0 |
0.3 |
0.1 |
0.2 |
GBI EM |
0.3 |
0.7 |
0.5 |
0.3 |
0.2 |
0.2 |
0.3 |
1.0 |
0.5 |
0.3 |
DXY |
-0.1 |
0.1 |
0.2 |
0.0 |
0.1 |
0.2 |
0.1 |
0.5 |
1.0 |
0.2 |
Commod |
0.3 |
0.4 |
0.3 |
0.2 |
-0.1 |
-0.1 |
0.2 |
0.3 |
0.2 |
1.0 |
Source: Bloomberg, Datastream, J.P. Morgan
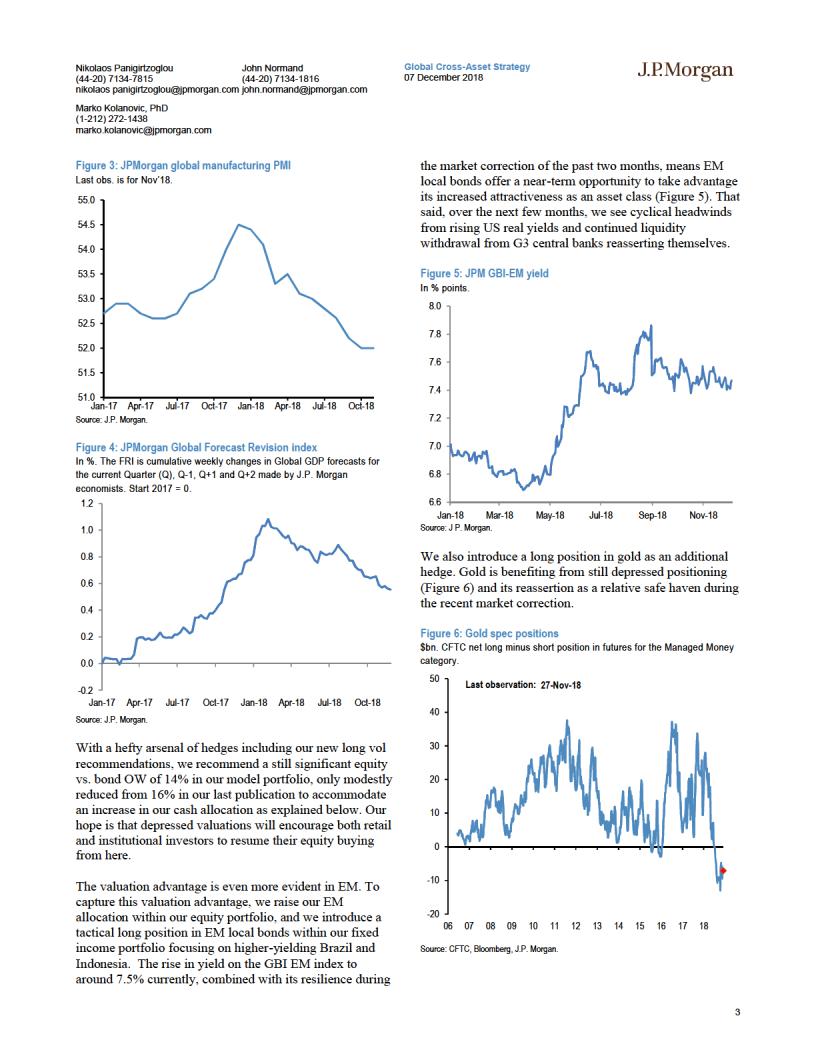
What are we learning from these reference portfolios? The risk/return trade-off is now very flat, with the Sharpe ratio across different volatility points between 0.30 and 0.36.
The allocation with the highest Sharpe ratio with a 5% vol target consists of around 50% government bonds, around one third equities and the remainder a mix of commodities, HY and DM FX. Unsurprisingly, the forward-looking recommendations stay rather defensive at lower target volatilities, and it is only allowing for a higher volatility target that the model recommends diversifying in equities vs. bonds.
1 In a nutshell, BL calculate the market neutral expected returns that the optimization needs to make the benchmark the optimal portfolio also It then uses a weighted average of neutral and investors' active expected returns and confidence in them to generate an active optimal portfolio where deviations are a function of the difference between neutral and active expected returns and the confidence in the latter
5
vk.com/id446425943

vk.com/id446425943
Nikolaos Panigirtzoglou |
John Normand |
Global Cross-Asset Strategy |
(44-20) 7134-7815 |
(44-20) 7134-1816 |
07 December 2018 |
nikolaos panigirtzoglou@jpmorgan.com john.normand@jpmorgan.com
Marko Kolanovic, PhD (1-212) 272-1438
marko.kolanovic@jpmorgan.com
Long-Only Asset Allocation
Major Asset Classes |
|
Active Weights |
Prior Month |
UW | OW |
|
|
|
|
||||
Equities |
|
|
7% |
9% |
|
|
|
|
|
|
|
|
Govt. Bonds |
|
|
1% |
1% |
|
|
|
|
|
|
|
|
Corp. Bonds |
|
|
-8% |
-8% |
|
|
|
|
|
|
|
|
Commodities |
|
|
0% |
3% |
|
|
|
|
|
|
|
|
Cash |
|
|
0% |
-5% |
|
|
|
|
|
vs. US Benchmark |
|
|
Major Sectors within each Asset Class |
Active Weights |
Prior Month |
UW | OW |
|
|
|||||||
Equities |
Countries |
US |
1.0% |
1.0% |
|
|
|
|
|
Note |
Tracking Error (%) |
1.77% |
|
|
EMU |
-1.0% |
-1.0% |
|
|
|
|
|
|
Energy |
2% |
|
|
Japan |
0.0% |
0.0% |
|
|
|
|
|
|
Technology |
2% |
|
|
UK |
-2.0% |
-2.0% |
|
|
|
|
|
|
Utilities |
-2% |
|
|
EM |
3.0% |
3.0% |
|
|
|
|
|
|
Real Estate |
-2% |
|
|
Other |
-1.0% |
-1.0% |
|
|
|
|
|
vs. Benchmark |
|
|
Govt. Bonds |
Countries |
US Nominal |
-2.0% |
-2.0% |
|
|
|
|
|
Note |
Yield (bp) |
-4.0 |
|
|
US TIPs |
0.0% |
0.0% |
|
|
|
|
|
|
Dur (months) |
-3.15 |
|
|
Europe Core |
0.0% |
0.0% |
|
|
|
|
|
|
Tracking Error (%) |
0.19% |
|
|
Europe Periphery |
0.0% |
0.0% |
|
|
|
|
|
|
|
|
|
|
Japan |
0.0% |
0.0% |
|
|
|
|
|
|
|
|
|
|
UK |
0.0% |
0.0% |
|
|
|
|
|
|
|
|
|
|
EM Local |
0.0% |
0.0% |
|
|
|
|
|
|
|
|
|
|
Australia |
2.0% |
2.0% |
|
|
|
|
|
|
|
|
|
|
Other |
0.0% |
0.0% |
|
|
|
|
|
vs. Benchmark |
|
|
Corp. Bonds |
HG |
US |
-2.0% |
-2.0% |
|
|
|
|
|
Note |
Yield (bp) |
0.4 |
|
|
Europe |
0.0% |
0.0% |
|
|
|
|
|
|
Duration (months) |
-0.8 |
|
|
UK |
0.0% |
0.0% |
|
|
|
|
|
|
Tracking Error (%) |
0.81% |
|
HY |
US |
0.0% |
0.0% |
|
|
|
|
|
|
|
|
|
|
Europe |
1.0% |
1.0% |
|
|
|
|
|
|
|
|
|
|
US Loans |
2.0% |
2.0% |
|
|
|
|
|
|
|
|
|
EM |
Sovereigns |
-1.0% |
-1.0% |
|
|
|
|
|
|
|
|
|
|
Corporates |
0.0% |
0.0% |
|
|
|
|
|
vs. Benchmark |
|
|
Commodities |
|
Energy |
-1.0% |
2.0% |
|
|
|
|
|
Note |
Tracking Error (%) |
1.53% |
|
|
Industrial metals |
-2.0% |
1.0% |
|
|
|
|
|
|
|
|
|
|
Agriculture |
1.0% |
0.0% |
|
|
|
|
|
|
|
|
|
|
Precious metals |
2.0% |
-3.0% |
|
|
|
|
|
|
|
|
|
|
Livestock |
0.0% |
0.0% |
|
|
|
|
|
|
|
|
Source: J.P. Morgan.
7
vk.com/id446425943
Nikolaos Panigirtzoglou |
John Normand |
Global Cross-Asset Strategy |
(44-20) 7134-7815 |
(44-20) 7134-1816 |
07 December 2018 |
nikolaos panigirtzoglou@jpmorgan.com john.normand@jpmorgan.com
Marko Kolanovic, PhD (1-212) 272-1438
marko.kolanovic@jpmorgan.com
Long-Only Portfolio Performance
Performance for 3rd Oct 2018 GAA Long-only portfolio
In bps.
|
|
|
Benchmark (bps) |
|
|
|
EQ |
1D |
WTD |
MTD |
|
returns |
-103 |
-235 |
-814 |
||
Govt Bonds |
8 |
17 |
-102 |
||
|
|||||
Asset |
Corp Bonds |
8 |
34 |
-153 |
|
CO |
-134 |
20 |
-961 |
||
|
|||||
|
FX |
|
|
` |
|
|
Portfolio |
|
|
||
(1) |
-49 |
-94 |
-472 |
||
(2) |
|
|
|
|
|
Cross asset class allocation |
-63 |
-118 |
-564 |
||
(3) |
|
|
|
|
|
Within asset class allocation |
-48 |
-87 |
-440 |
|
GMOS portfolio |
|
1D |
WTD |
MTD |
-95 |
-214 |
-756 |
7 |
13 |
-118 |
-4 |
29 |
-110 |
-140 |
14 |
-959 |
0 |
0 |
0 |
-61 |
-108 |
-528 |
|
Active (bps) |
|
1D |
WTD |
MTD |
7 |
21 |
59 |
-1 |
-4 |
-16 |
-12 |
-5 |
44 |
-6 |
-7 |
1 |
0 |
0 |
0 |
|
|
|
-12 |
-13 |
-57 |
|
|
|
-14 |
-23 |
-92 |
|
|
|
1 |
7 |
32 |
Note: (1) the leftmost columns are the absolute returns of the benchmark portfolio. The center columns are the absolute returns of the GMOS portfolio. The rightmost columns are the relativ e performance of the GMOS portfolio v ersus the benchmark. If these are positiv e then the GMOS portfolio outperformed the benchmark. (2) The leftmost columns are the absolute returns of the benchmark asset classes w ith activ e asset allocation w eights. The rightmost columns are the relativ e performance of the activ e asset allocation v ersus the benchmark. If these are positiv e then activ e allocation outperformed the passiv e index . (3) The leftmost columns are the absolute returns of the activ e asset classes w ith benchmark asset w eights. The rightmost columns are the relativ e performance of this portfolio v ersus the benchmark. If these are positiv e then activ e asset classes w ith benchmark w eights outperformed the passiv e index .
Source: J.P. Morgan
8
vk.com/id446425943

vk.com/id446425943
Nikolaos Panigirtzoglou |
John Normand |
Global Cross-Asset Strategy |
(44-20) 7134-7815 |
(44-20) 7134-1816 |
07 December 2018 |
nikolaos panigirtzoglou@jpmorgan.com john.normand@jpmorgan.com
Marko Kolanovic, PhD (1-212) 272-1438
marko.kolanovic@jpmorgan.com
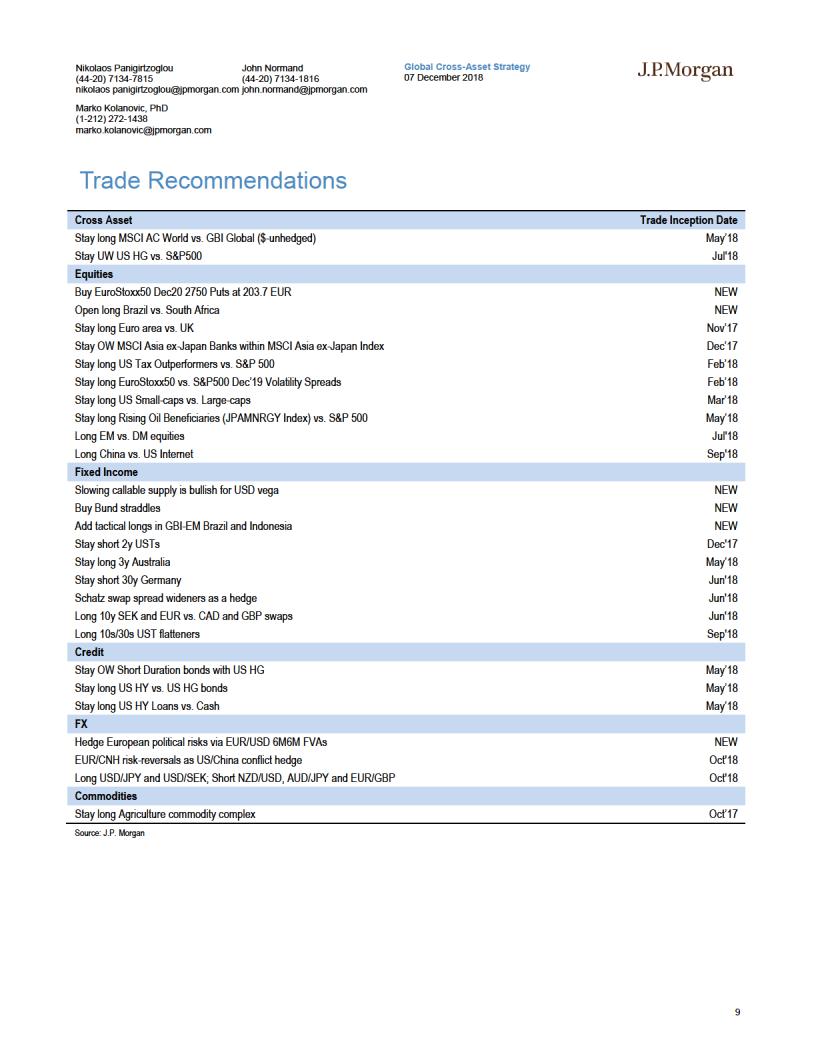
Cross-Asset Trading Themes
Stay long Global Equities vs. DM Government Bonds, currency unhedged
Sustained above-trend global growth, our expectation for continued earnings surprises keeps us OW global stocks vs. DM bonds. The major risk of our pro-cyclical and OW equities position is an escalating trade war and a restrictive Fed that trigger end-of-cycle next year as fiscal benefits wear off and trade tariffs and Fed hikes start to erode macro and earnings fundamentals, which can be exacerbated by liquidity distortion and leverage. This is why we combine this position with hedges, as outlined in the overview section.
Lixin BaoAC (1-212) 834-4565
J.P. Morgan Securities LLC
Stay UW US HG vs. S&P500
We UW credit vs equities in the US. On a late-US business cycle, we expect investors demand a higher credit spread premium on continued liquidity tightening and higher macro volatility on trade/geopolitics. US HG spreads tightened in Q3 on lower supply (issuance down 50%yoy), increased foreign demand (stable/lower FX hedging costs) and higher UST yields. But we expect spreads to widen into 2019 as most of these favorable conditions are behind us and are replaced by heavier supply and higher FX hedging costs, which would likely pressure US HG spreads even higher into Q1 2019. The balance sheet shrinkage of the Fed is an additional headwind for US HG credit (see recent F&L “How much tightening? Nov 2018).
In contrast, we expect the strength of US corporate earnings to continue into the 4Q reporting season that kicks off in January. Strong earnings should be more beneficial to equities than credit. Earnings growth may be peaking as benefits from tax reform would taper off next year, but we still expect ~10% US EPS growth in 2019, which remains strong compared to 2017 earnings delivery (2018 is exceptional due to fiscal boost). We also believe Equity valuations remain attractive across both DM and EM. Technical positioning is crowded in the US but not in ROW.
Lixin BaoAC (1-212) 834-4565
J.P. Morgan Securities LLC
10