


vk.com/id446425943
Goldman Sachs
Power Shift 2019: Nextgen Power
Technology could accelerate the “solar takeover”
Technological improvements such as bifacial solar cells and trackers are starting to take share and can improve solar panel yields and reduce LCOE by up to 30%, we estimate. We believe this could push LCOE below our forecasts and lead to faster ramp-up of installations in Europe.
Bifacial panels generate energy from both sides
A bifacial solar panel can produce energy from both the front and the back. Light reaches the back of the panel from reflection from the ground or a neighbouring row of PV modules. Bifacial panels are starting to gain share and ITRPV expects the technology to represent 30% of the market in 2025.
Exhibit 34: Bifacial cells can generate power from the back |
|
|
Exhibit 35: The ITRPV expects bifacial solar to start to gain share |
|
|||||||||||||||
|
|
100% |
|
|
4% |
8% |
12% |
15% |
18% |
|
|
|
|
|
|
|
|
||
|
|
|
|
|
|
|
|
|
|
|
|||||||||
|
|
|
|
|
|
|
|
|
|
|
|
|
|
|
|||||
|
|
90% |
|
|
|
20% |
|
|
|
|
|
|
|
||||||
|
|
|
|
|
|
23% |
27% |
30% |
32% |
35% |
|
|
|||||||
|
|
80% |
|
|
|
|
|
|
|
|
|
38% |
|
||||||
|
|
70% |
|
|
|
|
|
|
|
|
|
|
|
|
|
|
|
||
|
|
60% |
|
|
|
|
|
|
|
|
|
|
|
|
|
|
|
||
|
|
50% |
|
|
|
|
|
|
|
|
|
|
|
|
|
|
|
||
|
|
40% |
|
|
|
|
|
|
|
|
|
|
|
|
|
|
|
||
|
|
30% |
|
|
|
|
|
|
|
|
|
|
|
|
|
|
|
||
|
|
20% |
|
|
|
|
|
|
|
|
|
|
|
|
|
|
|
||
|
|
10% |
|
|
|
|
|
|
|
|
|
|
|
|
|
|
|
||
|
|
0% |
|
|
|
|
|
|
|
|
|
|
|
|
|
|
|
||
|
|
|
|
|
|
|
|
|
|
|
|
|
|
|
|
|
|||
|
|
|
|
|
|
2017 |
2018 |
2019 |
2020 |
2021 |
2022 |
2023 |
2024 |
2025 |
2026 |
2027 |
2028 |
|
|
|
|
|
|
|
|
|
|
|
|
|
Monofacial |
Bifacial |
|
|
|
|
|
|
|
|
|
|
|
|
|
|
|
|
|
|
|
|
|||||||
|
|
|
|
|
|
|
|
|
|
||||||||||
Source: Goldman Sachs Global Investment Research |
|
|
Source: International Technology Roadmap for Photovoltaic |
|
|
|
|
|
|
||||||||||
Bifacial: 5%-25% higher output
The load factor improvement of a bifacial cell depends on the light reflectance of the ground surface and the height of the panel as shown in the charts below. The lighter the ground surface and the higher the panel, the higher the benefit from a bifacial panel. According to LG, the output could increase 5%-25% depending on installation conditions.
3 December 2018 |
27 |

vk.com/id446425943
Goldman Sachs
Power Shift 2019: Nextgen Power
Exhibit 36: Bifacial panels can lead to a 5%-25% increase in output depending on the surface
Bifacial gain by surface type, % vs monofacial
30%
25% |
|
|
|
|
|
|
25% |
|
|
|
|
|
|
23% |
|
||
|
|
|
|
|
|
|
||
20% |
|
|
|
|
20% |
|
|
|
|
|
|
|
|
|
|
||
15% |
|
|
|
14% |
|
|
|
|
10% |
7% |
9% |
9% |
|
|
|
|
|
|
|
|
|
|
|
|
||
5% |
4% |
|
|
|
|
|
|
|
|
|
|
|
|
|
|
||
0% |
|
|
|
|
|
|
|
|
Asphalt Bare soil |
Grass |
Concrete |
Sand |
White |
White |
White |
||
|
||||||||
|
|
|
|
|
roofing |
painted |
roofing |
|
|
|
|
|
|
metal |
concrete |
membrane |
Source: LG, Solarworld, Goldman Sachs Global Investment Research
Exhibit 37: The higher the module, the higher the gain
Bifacial gain by module elevation, module height in cm (x axis), output gain (y axis).
25% |
|
|
|
|
|
|
|
19% |
20% |
20% |
|
17% |
|
|
|
|
|
|
|
15% |
14% |
|
|
13% |
|
|
12% |
||
11% |
|
|
||
|
10% |
|
||
|
9% |
|
|
|
10% |
|
|
|
|
|
|
|
|
|
7% |
|
|
|
|
5% |
|
|
|
|
0% |
|
|
|
|
10 |
30 |
50 |
70 |
90 |
Albedo of 0.3 |
|
Albedo of 0.5 |
|
An albedo of 0.3 slighly higher than grass/concrete. An albedo of 0.5 is between sand and white roofing metal.
Source: LG
Trackers: 5%-25% higher output
Trackers are used to adjust panel orientation throughout the day and increase power output. They follow the sun’s path and maximise output by making sure the panel is facing the sun as shown below. According to the Lawrence Berkeley National Laboratory, panels using single axis trackers in the US generate c.5%-25% more power than fixed panels.
Exhibit 38: Trackers maximise solar output by adjusting the angle |
Exhibit 39: Panels with trackers generate c.5%-25% more output |
||||||||
of the panel |
Load factors by region and panel mounting type |
|
|
||||||
Illustration of a single axis solar tracker |
|
|
|
|
|
|
|
|
|
|
35% |
|
|
|
|
|
|
29% |
30% |
|
|
|
|
|
|
||||
|
30% |
|
|
|
|
|
|
||
|
|
|
|
|
|
|
|
||
|
|
|
|
|
|
|
26% |
|
|
|
|
|
|
|
|
|
25% |
25% |
|
|
25% |
|
|
|
|
23% |
|
||
|
|
|
|
|
|
|
|
||
|
|
|
|
|
21% |
21% |
20% |
|
|
|
20% |
|
|
18%19% |
19% |
|
|
|
|
|
|
|
|
|
|
|
|||
|
15% |
|
|
|
|
|
|
|
|
|
10% |
|
|
|
|
|
|
|
|
|
5% |
|
|
|
|
|
|
|
|
|
0% |
|
|
|
|
|
|
|
|
|
|
|
Northeast |
Midwest |
Southeast |
Texas |
Southwest |
California |
|
|
|
|
|
||||||
 Fixed-Tilt
  Tracking
Source: Goldman Sachs Global Investment Research |
Source: Lawrence Berkeley National Laboratory |
3 December 2018 |
28 |

vk.com/id446425943
Goldman Sachs
Power Shift 2019: Nextgen Power
What are industry experts saying?
“Bifacial modules are the future of the industry,” said Hongbin Fang, technical director of LONGi Solar.
“Next year [2019] there will be explosive growth in bifacial tracker installations,” predicts Guy Rong,
CEO of Arctech Solar.
“The bifacial tracker is one of most exciting untapped opportunities in the solar industry; there will be a huge drive toward this,” said Dan Shugar, founder of NEXTracker.
Source: PV Magazine
Bifacial + Tracker benefit: capex +5%, output +10%-50%
According to the Lawrence Berkeley National Laboratory, in 2017 for the first time the investment cost of projects with trackers was broadly on par with fixed projects in the US (we assume 2% extra on the full capital cost). Regarding bifacial panel, PV-magazine suggests the additional cost vs monofacial is 3%. All in all we believe capex would increase 5% for a bifacial + tracker project while output would increase by 10%-50% which implies a more competitive project (=lower LCOE).
Exhibit 40: Capex increases only 5% for a bifacial + tracker plant
Capex $/kW in Europe in 2018
703
603 |
580 |
592 |
597 |
609 |
|
||||
|
|
|
||
|
|
|
|
503
403
303
203
103
3
Monofacial |
Tracker |
Bifacial |
Bifacial + Tracker |
Exhibit 41: Load factors could increase 50%
Load factors for different installation types
50%
45%
45%
40% |
37% |
37% |
35%
30%
30%
25%
20%
15%
10%
5%
0%
Monofacial |
Tracker |
Bifacial |
Bifacial + Tracker |
Source: Lawrence Berkeley National Laboratory, PV-Magazine, Goldman Sachs Global |
Source: LG, Goldman Sachs Global Investment Research |
Investment Research |
|
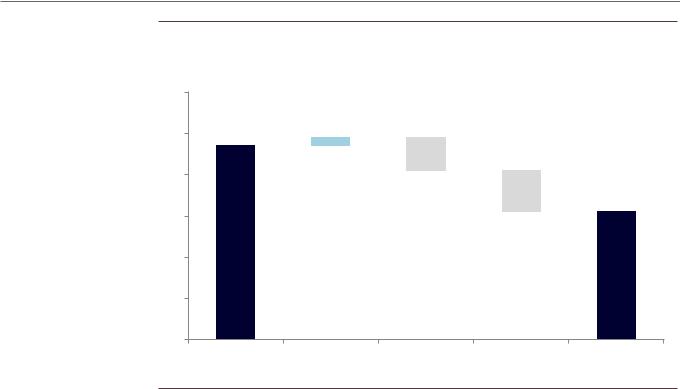
LCOE benefit from Bifacial + Tracker: Lowers LCOE by up to 30%
Combining bifacial and trackers in an optimal location could lead to up to 50% higher energy production. This could be reached with limited extra capex. Assuming a capex premium of 5%, we estimate LCOE could fall 30% for the best location.
3 December 2018 |
29 |
vk.com/id446425943
Goldman Sachs
Power Shift 2019: Nextgen Power
Exhibit 42: Bifacial + tracker could lower LCOE by up to 30%
LCOE bridge for Spain in 2019 from a standard fixed monofacial to bifacial with single axis tracker, €/MWh
30
25 24
+1
-5
20
-4 16
15
10
5
0
Fixed monofacial |
Extra capex |
Bifacial |
Tracker |
Bifacial and tracker |
Source: Goldman Sachs Global Investment Research
3 December 2018 |
30 |