

GS Metals Monitor_watermark
.pdfvk.com/id446425943
Goldman Sachs
Metals Monitor
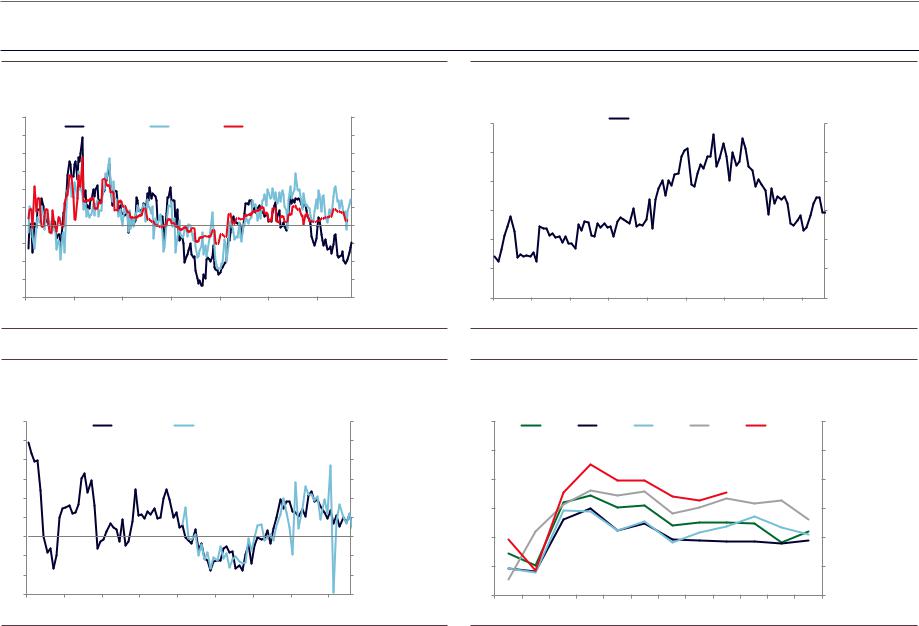
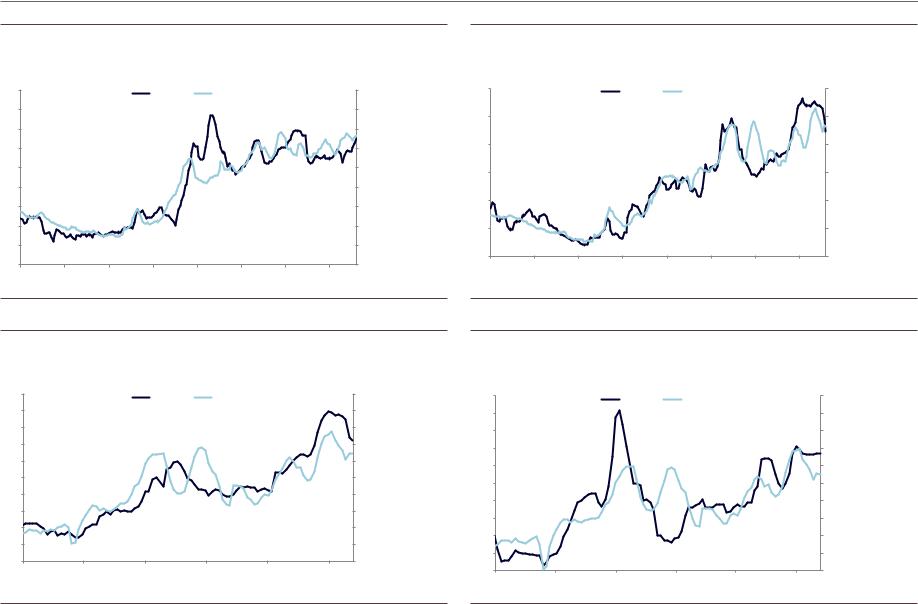
Exhibit 70: China refined copper net imports
Kt |
China Refined Copper Imports (3mma) |
% |
|
6,000 |
Annualized Level |
|
60 |
|
YoY Percent Change (right) |
||
5,500 |
|
|
40 |
|
|
|
|
5,000 |
|
|
|
4,500 |
|
|
20 |
|
|
|
|
4,000 |
|
|
0 |
3,500 |
|
|
-20 |
|
|
|
|
3,000 |
|
|
|
2,500 |
|
|
-40 |
|
|
|
|
2,000 |
|
|
-60 |
2015 |
2016 |
2017 |
2018 |
Source: Haver Analytics, Goldman Sachs Global Investment Research
Exhibit 72: China aluminum net exports
Kt |
China Aluminum Exports (3mma) |
% |
6,000 |
Annualized Level |
YoY Percent Change (right) |
70 |
|
5,500 |
|
|
|
60 |
|
|
|
|
|
5,000 |
|
|
|
50 |
|
|
|
40 |
|
|
|
|
|
|
4,500 |
|
|
|
30 |
|
|
|
|
|
4,000 |
|
|
|
20 |
3,500 |
|
|
|
10 |
|
|
|
|
|
3,000 |
|
|
|
0 |
|
|
|
-10 |
|
|
|
|
|
|
2,500 |
|
|
|
-20 |
|
|
|
|
|
2,000 |
|
|
|
-30 |
2015 |
2016 |
2017 |
2018 |
|
Exhibit 71: China copper scrap imports
% |
YoY Percent Change in China Copper Scrap Imports (3mma) |
% |
80 |
Gross Weight |
|
Import Value |
80 |
70 |
|
70 |
||
|
|
|
||
60 |
|
|
|
60 |
50 |
|
|
|
50 |
40 |
|
|
|
40 |
30 |
|
|
|
30 |
20 |
|
|
|
20 |
10 |
|
|
|
10 |
0 |
|
|
|
0 |
-10 |
|
|
|
-10 |
-20 |
|
|
|
-20 |
-30 |
|
|
|
-30 |
-40 |
|
|
|
-40 |
-50 |
|
|
|
-50 |
2015 |
2016 |
2017 |
2018 |
|
Source: Haver Analytics, Goldman Sachs Global Investment Research
Exhibit 73: China alumina net export
Kt |
China Alumina Exports (3mma) |
Kt |
|
2,000 |
|
Annualized Level |
2,000 |
|
|
|
|
1,000 |
|
|
1,000 |
0 |
|
|
0 |
-1,000 |
|
|
-1,000 |
-2,000 |
|
|
-2,000 |
-3,000 |
|
|
-3,000 |
-4,000 |
|
|
-4,000 |
-5,000 |
|
|
-5,000 |
-6,000 |
|
|
-6,000 |
-7,000 |
|
|
-7,000 |
2015 |
2016 |
2017 |
2018 |
Source: Haver Analytics, Goldman Sachs Global Investment Research |
Source: Haver Analytics, Goldman Sachs Global Investment Research |
5 November 2018 |
2< |
vk.com/id446425943
Goldman Sachs
Iron Ore Charts
Metals Monitor
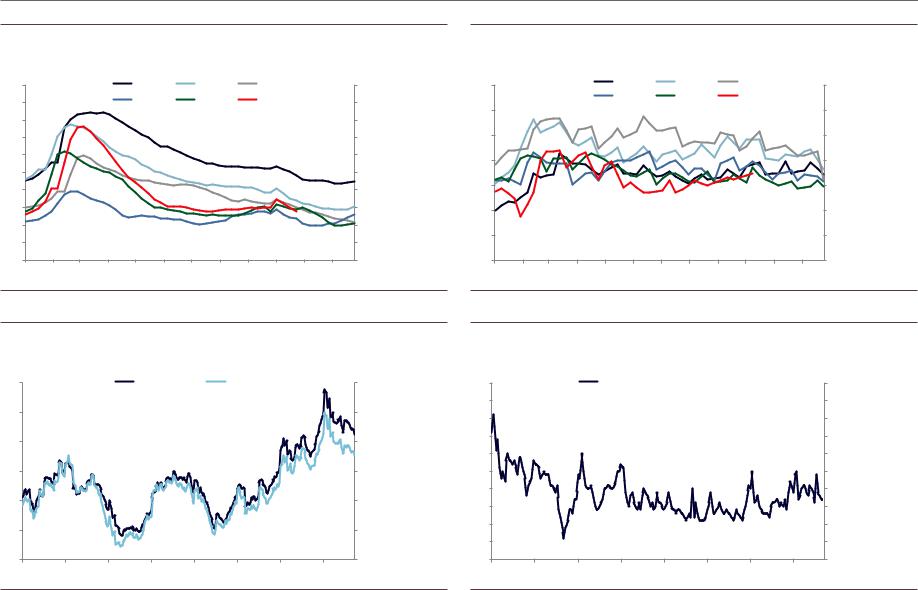
Exhibit 74: China steel production growth
% |
|
YoY growth in crude steel production |
% |
|||
30 |
|
30 |
||||
|
Mysteel |
CISA |
|
|
||
25 |
|
|
NBS (adjusted) |
|||
|
|
|
|
|
25 |
|
20 |
|
|
|
|
|
20 |
15 |
|
|
|
|
|
15 |
10 |
|
|
|
|
|
10 |
5 |
|
|
|
|
|
5 |
0 |
|
|
|
|
|
0 |
-5 |
|
|
|
|
|
-5 |
-10 |
|
|
|
|
|
-10 |
-15 |
|
|
|
|
|
-15 |
-20 |
|
|
|
|
|
-20 |
2012 |
2013 |
2014 |
2015 |
2016 |
2017 |
2018 |
Source: Mysteel, CISA, Haver Analytics, Goldman Sachs Global Investment Research
Exhibit 76: China steel consumption growth
% |
|
|
YoY Steel Consumption Growth |
|
% |
|||
30 |
|
|
|
30 |
||||
|
Apparent |
|
Real (Inventory Adjusted) |
|||||
|
|
|
|
|||||
25 |
|
|
|
|
|
|
|
25 |
20 |
|
|
|
|
|
|
|
20 |
15 |
|
|
|
|
|
|
|
15 |
10 |
|
|
|
|
|
|
|
10 |
5 |
|
|
|
|
|
|
|
5 |
0 |
|
|
|
|
|
|
|
0 |
-5 |
|
|
|
|
|
|
|
-5 |
-10 |
|
|
|
|
|
|
|
-10 |
-15 |
|
|
|
|
|
|
|
-15 |
2010 |
2011 |
2012 |
2013 |
2014 |
2015 |
2016 |
2017 |
2018 |
Exhibit 75: China steel exports
Mt |
|
|
|
|
|
|
|
Mt |
12 |
|
|
|
China Steel Exports |
|
|
12 |
|
|
|
|
|
|
|
|
||
10 |
|
|
|
|
|
|
|
10 |
8 |
|
|
|
|
|
|
|
8 |
6 |
|
|
|
|
|
|
|
6 |
4 |
|
|
|
|
|
|
|
4 |
2 |
|
|
|
|
|
|
|
2 |
0 |
|
|
|
|
|
|
|
0 |
2010 |
2011 |
2012 |
2013 |
2014 |
2015 |
2016 |
2017 |
2018 |
Source: Haver Analytics
Exhibit 77: China steel consumption seasonal pattern
Mt |
|
China crude steel daily real consumption (NBS) |
Mt |
||||||||
|
|
|
|||||||||
2.6 |
2014 |
|
2015 |
|
2016 |
|
2017 |
|
2018 |
2.6 |
|
|
|
|
|
|
|
||||||
2.4 |
|
|
|
|
|
|
|
|
|
|
2.4 |
2.2 |
|
|
|
|
|
|
|
|
|
|
2.2 |
2.0 |
|
|
|
|
|
|
|
|
|
|
2.0 |
1.8 |
|
|
|
|
|
|
|
|
|
|
1.8 |
1.6 |
|
|
|
|
|
|
|
|
|
|
1.6 |
1.4 |
|
|
|
|
|
|
|
|
|
|
1.4 |
Jan |
Feb |
Mar |
Apr |
May |
Jun |
Jul |
Aug |
Sep |
Oct |
Nov |
Dec |
Source: Haver Analytics, Bloomberg, Mysteel, Goldman Sachs Global Investment Research |
Source: Haver Analytics, Bloomberg, Mysteel, Goldman Sachs Global Investment Research |
5 November 2018 |
22 |
vk.com/id446425943
Goldman Sachs
Metals Monitor
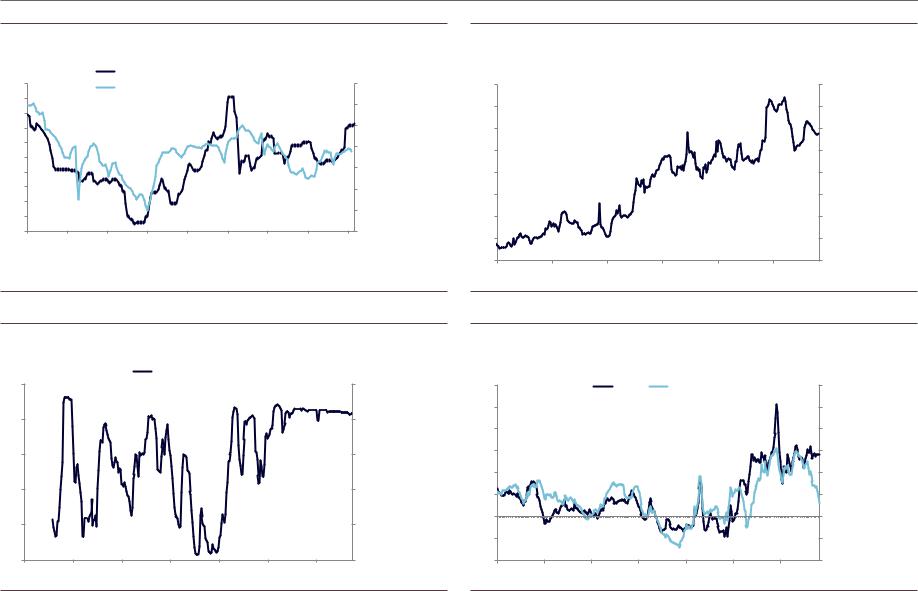
Exhibit 78: Steel trader inventory |
|
Exhibit 79: Steel inventory at mills |
|
||
Mt |
Steel trader inventories |
Mt |
Mt |
Steel mill inventories |
Mt |
24 |
|
|
|
2013 |
|
2014 |
|
2015 |
|
24 |
|
22 |
|
|
|
2016 |
|
2017 |
|
2018 |
|
22 |
|
20 |
|
|
|
|
|
|
|
|
|
|
20 |
18 |
|
|
|
|
|
|
|
|
|
|
18 |
16 |
|
|
|
|
|
|
|
|
|
|
16 |
14 |
|
|
|
|
|
|
|
|
|
|
14 |
12 |
|
|
|
|
|
|
|
|
|
|
12 |
10 |
|
|
|
|
|
|
|
|
|
|
10 |
8 |
|
|
|
|
|
|
|
|
|
|
8 |
6 |
|
|
|
|
|
|
|
|
|
|
6 |
4 |
|
|
|
|
|
|
|
|
|
|
4 |
Jan |
Feb |
Mar |
Apr |
May |
Jun |
Jul |
Aug |
Sep |
Oct |
Nov |
Dec |
20 |
|
|
|
2013 |
|
2014 |
|
2015 |
|
20 |
|
|
|
|
2016 |
|
2017 |
|
2018 |
|
|||
|
|
|
|
|
|
|
|
||||
18 |
|
|
|
|
|
|
|
|
|
|
18 |
16 |
|
|
|
|
|
|
|
|
|
|
16 |
14 |
|
|
|
|
|
|
|
|
|
|
14 |
12 |
|
|
|
|
|
|
|
|
|
|
12 |
10 |
|
|
|
|
|
|
|
|
|
|
10 |
8 |
|
|
|
|
|
|
|
|
|
|
8 |
6 |
|
|
|
|
|
|
|
|
|
|
6 |
Jan |
Feb |
Mar |
Apr |
May |
Jun |
Jul |
Aug |
Sep |
Oct |
Nov |
Dec |
Source: Bloomberg, Goldman Sachs Global Investment Research |
Source: Mysteel, Goldman Sachs Global Investment Research |
Exhibit 80: Iron ore port inventory in days of use
Days |
|
Iron Ore Port Inventory in Days of Use |
Days |
||||
45 |
|
|
Steelhome |
|
Mysteel |
|
45 |
40 |
|
|
|
|
|
|
40 |
35 |
|
|
|
|
|
|
35 |
30 |
|
|
|
|
|
|
30 |
25 |
|
|
|
|
|
|
25 |
20 |
|
|
|
|
|
|
20 |
15 |
|
|
|
|
|
|
15 |
2011 |
2012 |
2013 |
2014 |
2015 |
2016 |
2017 |
2018 |
Exhibit 81: Inventory of imported iron ore at Chinese steel mills
Days |
|
|
|
|
|
|
Days |
60 |
|
|
Imported Iron Ore Inventory at Mills |
60 |
|||
55 |
|
|
|
|
|
|
55 |
50 |
|
|
|
|
|
|
50 |
45 |
|
|
|
|
|
|
45 |
40 |
|
|
|
|
|
|
40 |
35 |
|
|
|
|
|
|
35 |
30 |
|
|
|
|
|
|
30 |
25 |
|
|
|
|
|
|
25 |
20 |
|
|
|
|
|
|
20 |
15 |
|
|
|
|
|
|
15 |
10 |
|
|
|
|
|
|
10 |
2011 |
2012 |
2013 |
2014 |
2015 |
2016 |
2017 |
2018 |
Source: Mysteel, Bloomberg, Haver Analytics, Goldman Sachs Global Investment Research |
Source: Mysteel |
5 November 2018 |
23 |
vk.com/id446425943
Goldman Sachs
Metals Monitor
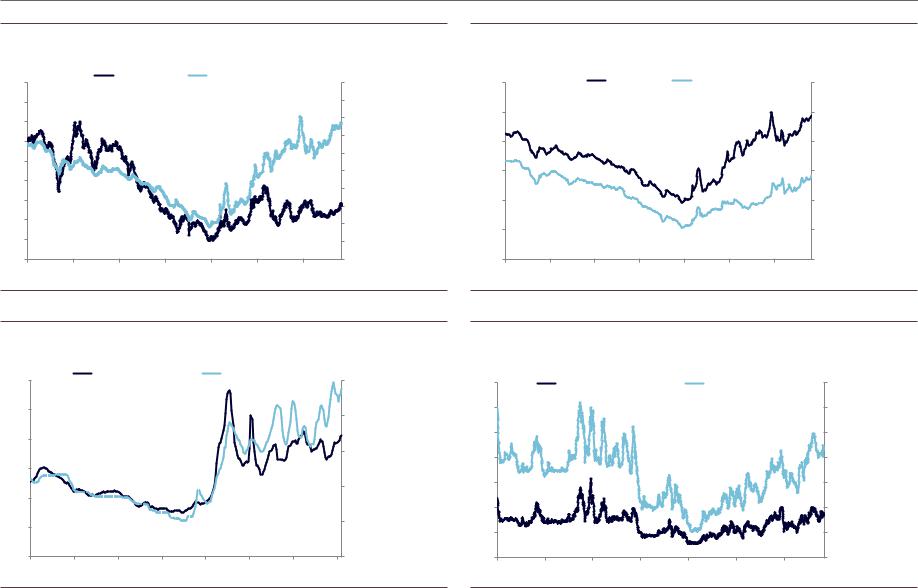
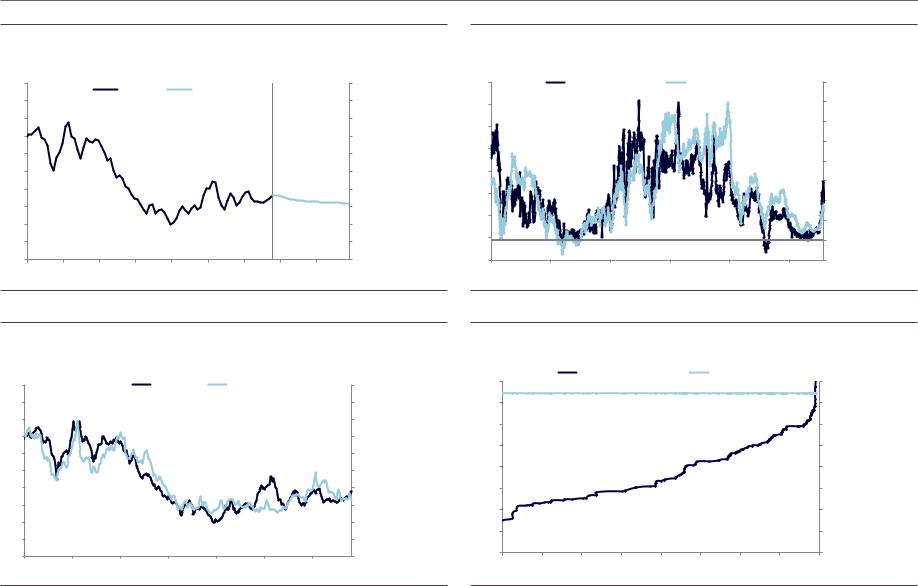
Exhibit 82: Iron ore price and Chinese domestic iron ore mine utilization rate
Rmb/t |
|
|
Iron Ore Price in Tangshan (left) |
|
|
% |
||
900 |
|
|
|
|
80 |
|||
|
|
Domestic Mine Utilisation Rate (right) |
|
|||||
850 |
|
|
|
|
||||
|
|
|
|
|
|
|
75 |
|
800 |
|
|
|
|
|
|
|
|
|
|
|
|
|
|
|
70 |
|
750 |
|
|
|
|
|
|
|
|
700 |
|
|
|
|
|
|
|
65 |
650 |
|
|
|
|
|
|
|
|
|
|
|
|
|
|
|
60 |
|
600 |
|
|
|
|
|
|
|
|
|
|
|
|
|
|
|
|
|
550 |
|
|
|
|
|
|
|
55 |
500 |
|
|
|
|
|
|
|
50 |
450 |
|
|
|
|
|
|
|
|
|
|
|
|
|
|
|
|
|
400 |
Feb-15 |
|
Feb-16 |
|
Feb-17 |
|
Feb-18 |
45 |
Aug-14 |
Aug-15 |
Aug-16 |
Aug-17 |
Aug-18 |
||||
Source: Mysteel
Exhibit 84: Share of profitable steel mills in China
Share |
|
|
Share of Profitable Mills |
|
Share |
|
1.0 |
|
|
|
1.0 |
||
|
|
|
|
|
||
0.8 |
|
|
|
|
|
0.8 |
0.6 |
|
|
|
|
|
0.6 |
0.4 |
|
|
|
|
|
0.4 |
0.2 |
|
|
|
|
|
0.2 |
0.0 |
|
|
|
|
|
0.0 |
2012 |
2013 |
2014 |
2015 |
2016 |
2017 |
2018 |
Exhibit 83: Reduction of liquid iron ore from cuts and halts
Kt/d |
|
Reduction of Liquid Iron Output from Cuts and Halts |
Kt/d |
|
|
|
800 |
|
|
|
|
800 |
700 |
|
|
|
|
700 |
600 |
|
|
|
|
600 |
500 |
|
|
|
|
500 |
400 |
|
|
|
|
400 |
300 |
|
|
|
|
300 |
200 |
|
|
|
|
200 |
100 |
|
|
|
|
100 |
0 |
|
|
|
|
0 |
2013 |
2014 |
2015 |
2016 |
2017 |
2018 |
Source: Mysteel
Exhibit 85: Margins of Chinese steel mills
US$/t |
|
|
Steel Margins |
|
US$/t |
|
|
|
|
|
|
||
240 |
|
|
Rebar |
Hot Rolled Steel |
240 |
|
200 |
|
|
|
|
|
200 |
160 |
|
|
|
|
|
160 |
120 |
|
|
|
|
|
120 |
80 |
|
|
|
|
|
80 |
40 |
|
|
|
|
|
40 |
0 |
|
|
|
|
|
0 |
-40 |
|
|
|
|
|
-40 |
-80 |
|
|
|
|
|
-80 |
2012 |
2013 |
2014 |
2015 |
2016 |
2017 |
2018 |
Source: Mysteel |
Source: Bloomberg, Goldman Sachs Global Investment Research |
5 November 2018 |
24 |
vk.com/id446425943
Goldman Sachs
Metals Monitor
Exhibit 86: Iron ore and China rebar steel price
US$/t |
|
Iron Ore (left) |
Rebar Steel (right) |
RMB/t |
||
200 |
|
6,000 |
||||
|
|
|
|
|
||
180 |
|
|
|
|
|
5,500 |
160 |
|
|
|
|
|
5,000 |
|
|
|
|
|
|
|
140 |
|
|
|
|
|
4,500 |
|
|
|
|
|
4,000 |
|
120 |
|
|
|
|
|
|
|
|
|
|
|
3,500 |
|
100 |
|
|
|
|
|
|
|
|
|
|
|
3,000 |
|
80 |
|
|
|
|
|
|
|
|
|
|
|
2,500 |
|
|
|
|
|
|
|
|
60 |
|
|
|
|
|
2,000 |
|
|
|
|
|
|
|
40 |
|
|
|
|
|
1,500 |
20 |
|
|
|
|
|
1,000 |
2012 |
2013 |
2014 |
2015 |
2016 |
2017 |
2018 |
Source: Bloomberg
Exhibit 88: Hard coking coal and coke price
US$/t |
|
Hard Coking Coal (left) |
|
Taiyuan Coke (right) |
RMB/t |
||
300 |
|
|
2,500 |
||||
|
|
|
|
|
|
||
250 |
|
|
|
|
|
|
2,000 |
|
|
|
|
|
|
|
|
200 |
|
|
|
|
|
|
1,500 |
|
|
|
|
|
|
|
|
150 |
|
|
|
|
|
|
|
100 |
|
|
|
|
|
|
1,000 |
|
|
|
|
|
|
|
|
50 |
|
|
|
|
|
|
500 |
|
|
|
|
|
|
|
|
0 |
|
|
|
|
|
|
0 |
Jul-13 |
Apr-14 |
Jan-15 |
Oct-15 |
Jul-16 |
Apr-17 |
Jan-18 |
Oct-18 |
Exhibit 87: Rebar and Scrap
RMB/t |
|
|
|
|
|
RMB/t |
6,000 |
|
|
Rebar Steel |
Scrap Jinan |
6,000 |
|
5,000 |
|
|
|
|
|
5,000 |
4,000 |
|
|
|
|
|
4,000 |
3,000 |
|
|
|
|
|
3,000 |
2,000 |
|
|
|
|
|
2,000 |
1,000 |
|
|
|
|
|
1,000 |
0 |
|
|
|
|
|
0 |
2012 |
2013 |
2014 |
2015 |
2016 |
2017 |
2018 |
Source: Bloomberg
Exhibit 89: Freight from Australia and Brazil to China
US$/wmt |
|
|
|
|
|
|
US$/wmt |
35 |
|
Australia-China Freight |
|
Brazil-China Freight |
35 |
||
30 |
|
|
|
|
|
|
30 |
25 |
|
|
|
|
|
|
25 |
20 |
|
|
|
|
|
|
20 |
15 |
|
|
|
|
|
|
15 |
10 |
|
|
|
|
|
|
10 |
5 |
|
|
|
|
|
|
5 |
0 |
|
|
|
|
|
|
0 |
2012 |
2013 |
2014 |
2015 |
2016 |
2017 |
2018 |
|
Source: Bloomberg |
Source: Platts |
5 November 2018 |
25 |
vk.com/id446425943
Goldman Sachs
Metals Monitor
Exhibit 90: Iron ore grade premium 62 vs 58 |
|
Exhibit 91: Iron Ore grade premium 65 vs 62 |
|
||
$/t |
Iron Ore Grade Premium: 62% vs. 58% Fe |
$/t |
$/t |
Iron Ore Grade Premium: 65% vs. 62% Fe |
$/t |
45 |
|
|
Actual |
|
Model Fitted |
|
45 |
|
|
|
|
|
|
||
40 |
|
|
|
|
|
|
40 |
35 |
|
|
|
|
|
|
35 |
30 |
|
|
|
|
|
|
30 |
25 |
|
|
|
|
|
|
25 |
20 |
|
|
|
|
|
|
20 |
15 |
|
|
|
|
|
|
15 |
10 |
|
|
|
|
|
|
10 |
5 |
|
|
|
|
|
|
5 |
0 |
|
|
|
|
|
|
0 |
Jan-15 |
Jul-15 |
Jan-16 |
Jul-16 |
Jan-17 |
Jul-17 |
Jan-18 |
Jul-18 |
30 |
|
|
Actual |
|
Model Fitted |
|
30 |
|
|
|
|
|
|
||
25 |
|
|
|
|
|
|
25 |
20 |
|
|
|
|
|
|
20 |
15 |
|
|
|
|
|
|
15 |
10 |
|
|
|
|
|
|
10 |
5 |
|
|
|
|
|
|
5 |
0 |
|
|
|
|
|
|
0 |
Jan-15 |
Jul-15 |
Jan-16 |
Jul-16 |
Jan-17 |
Jul-17 |
Jan-18 |
Jul-18 |
Source: Bloomberg
Exhibit 92: Iron ore pellet premium
$/t |
Iron Ore Pellet Premium |
$/t |
100 |
|
Actual |
Model Fitted |
100 |
|
|
|
|
|||
90 |
|
|
|
|
90 |
80 |
|
|
|
|
80 |
70 |
|
|
|
|
70 |
60 |
|
|
|
|
60 |
50 |
|
|
|
|
50 |
40 |
|
|
|
|
40 |
30 |
|
|
|
|
30 |
20 |
|
|
|
|
20 |
10 |
|
|
|
|
10 |
0 |
|
|
|
|
0 |
Jan-17 |
May-17 |
Sep-17 |
Jan-18 |
May-18 |
Sep-18 |
Source: Bloomberg
Exhibit 93: Iron ore lump premium
$/t |
|
Iron Ore Lump Premium |
|
$/t |
|
0.50 |
|
Actual |
Model Fitted |
0.50 |
|
|
|
|
|||
0.45 |
|
|
|
|
0.45 |
0.40 |
|
|
|
|
0.40 |
0.35 |
|
|
|
|
0.35 |
0.30 |
|
|
|
|
0.30 |
0.25 |
|
|
|
|
0.25 |
0.20 |
|
|
|
|
0.20 |
0.15 |
|
|
|
|
0.15 |
0.10 |
|
|
|
|
0.10 |
0.05 |
|
|
|
|
0.05 |
0.00 |
|
|
|
|
0.00 |
Jan-17 |
May-17 |
Sep-17 |
Jan-18 |
May-18 |
Sep-18 |
Source: Bloomberg |
Source: Bloomberg |
5 November 2018 |
26 |
vk.com/id446425943
Goldman Sachs
Metals Monitor
Exhibit 94: Iron ore historical price and futures curve
US$/t |
|
|
Iron Ore Price (62% Fe) |
|
|
US$/t |
||
200 |
|
|
|
|
200 |
|||
|
|
Actual |
|
Futures Curve |
|
|||
180 |
|
|
|
|
180 |
|||
|
|
|
|
|
|
|
||
160 |
|
|
|
|
|
|
|
160 |
140 |
|
|
|
|
|
|
|
140 |
120 |
|
|
|
|
|
|
|
120 |
100 |
|
|
|
|
|
|
|
100 |
80 |
|
|
|
|
|
|
|
80 |
60 |
|
|
|
|
|
|
|
60 |
40 |
|
|
|
|
|
|
|
40 |
20 |
|
|
|
|
|
|
|
20 |
0 |
|
|
|
|
|
|
|
0 |
2012 |
2013 |
2014 |
2015 |
2016 |
2017 |
2018 |
2019 |
2020 |
Source: Bloomberg
Exhibit 96: Model iron ore price vs actual
US$/t |
Iron Ore Price |
US$/t |
|
|
200 |
|
|
Actual |
|
Model Fitted |
200 |
180 |
|
|
|
|
|
180 |
160 |
|
|
|
|
|
160 |
140 |
|
|
|
|
|
140 |
120 |
|
|
|
|
|
120 |
100 |
|
|
|
|
|
100 |
80 |
|
|
|
|
|
80 |
60 |
|
|
|
|
|
60 |
40 |
|
|
|
|
|
40 |
20 |
|
|
|
|
|
20 |
0 |
|
|
|
|
|
0 |
2012 |
2013 |
2014 |
2015 |
2016 |
2017 |
2018 |
Exhibit 95: Iron ore timespreads
% |
|
Iron Ore Timespreads |
% |
||
7 |
|
2 to 3 month (left) |
|
3 to 15 month (right) |
40 |
6 |
|
|
|
|
35 |
5 |
|
|
|
|
30 |
|
|
|
|
|
|
4 |
|
|
|
|
25 |
|
|
|
|
20 |
|
3 |
|
|
|
|
|
|
|
|
|
15 |
|
2 |
|
|
|
|
|
|
|
|
|
10 |
|
|
|
|
|
|
|
1 |
|
|
|
|
5 |
|
|
|
|
|
|
0 |
|
|
|
|
0 |
-1 |
|
|
|
|
-5 |
2013 |
2014 |
2015 |
2016 |
2017 |
2018 |
Source: Bloomberg
Exhibit 97: Iron Ore cost curve and current price
$/t |
|
IO total cash cost |
|
|
IO spot price |
|
$/t |
|
80 |
|
|
|
|
80 |
|||
|
|
|
|
|
|
|
||
70 |
|
|
|
|
|
|
|
70 |
60 |
|
|
|
|
|
|
|
60 |
50 |
|
|
|
|
|
|
|
50 |
40 |
|
|
|
|
|
|
|
40 |
30 |
|
|
|
|
|
|
|
30 |
20 |
|
|
|
|
|
|
|
20 |
10 |
|
|
|
|
|
|
|
10 |
0 |
|
|
|
|
|
|
|
0 |
0 |
200 |
400 |
600 |
800 |
1000 |
1200 |
1400 |
1600 |
Source: Bloomberg, Goldman Sachs Global Investment Research |
Source: AME, Bloomberg, Goldman Sachs Global Investment Research |
5 November 2018 |
27 |

vk.com/id446425943
Goldman Sachs
Metals Monitor
GS Forecasts
Exhibit 98: GS aluminum supply and demand balance
|
(’000t) |
2016 |
2017 |
2018E |
2019E |
2020E |
|
|
Refined Production |
58734 |
62778 |
65497 |
68536 |
71032 |
|
|
% Change YoY |
3.2 |
6.9 |
4.3 |
4.6 |
3.6 |
|
|
Of which China |
31938 |
36007 |
37523 |
39558 |
41141 |
|
|
% change |
4.0 |
12.7 |
4.2 |
5.4 |
4.0 |
|
|
Refined Consumption |
59214 |
62823 |
65648 |
68010 |
70097 |
|
|
% change |
5.4 |
6.1 |
4.5 |
3.6 |
3.1 |
|
|
Of which China |
31667 |
34295 |
36010 |
37450 |
38761 |
|
|
% change |
8.2 |
8.3 |
5.0 |
4.0 |
3.5 |
|
|
Of which ex-China |
27547 |
28528 |
29638 |
30560 |
31335 |
|
|
% change |
2.3 |
3.6 |
3.9 |
3.1 |
2.5 |
|
|
Balance |
-480 |
-45 |
-151 |
526 |
936 |
|
|
LME Price ($/t) |
1605 |
1968 |
2196 |
2075 |
2000 |
|
|
|
|
|
|
|
|
|
Exhibit 99: GS copper supply and demand balance
|
(’000t) |
2016 |
2017 |
2018E |
2019E |
2020E |
|
|
Mine Supply |
20169 |
20086 |
20272 |
20743 |
21504 |
|
|
% change |
5.1 |
-0.4 |
0.9 |
2.3 |
3.7 |
|
|
|
|
|
|
|
|
|
|
Refined Supply |
22743 |
23094 |
23449 |
23977 |
24537 |
|
|
% change |
3.4 |
1.5 |
1.5 |
2.3 |
2.3 |
|
|
|
|
|
|
|
|
|
|
Refined Consumption |
22569 |
23040 |
23576 |
23978 |
24430 |
|
|
% change |
2.9 |
2.1 |
2.3 |
1.7 |
1.9 |
|
|
Of which China |
10706 |
11030 |
11262 |
11481 |
11654 |
|
|
% change |
5.0 |
3.0 |
2.1 |
1.9 |
1.5 |
|
|
Of which ex-China |
11741 |
11891 |
11986 |
12050 |
12239 |
|
|
% change |
-0.4 |
1.3 |
0.8 |
0.5 |
1.6 |
|
|
Balance |
174 |
54 |
-126 |
-1 |
107 |
|
|
LME Price ($/t) |
4862 |
6166 |
6550 |
6885 |
7023 |
|
|
|
|
|
|
|
|
|
Source: Goldman Sachs Global Investment Research |
Source: Goldman Sachs Global Investment Research |
Exhibit 100: GS nickel supply and demand balance
|
(’000t) |
2016 |
2017 |
2018E |
2019E |
2020E |
|
|
Refined Production |
2000 |
2072 |
2136 |
2255 |
2346 |
|
|
% change |
0.6 |
3.6 |
3.1 |
5.6 |
4.0 |
|
|
Of which China NPI |
374 |
400 |
450 |
500 |
550 |
|
|
Of which Indonesia NPI |
97 |
180 |
223 |
241 |
249 |
|
|
Refined Consumption |
1956 |
2139 |
2287 |
2360 |
2405 |
|
|
% change |
6.6 |
9.3 |
6.9 |
3.2 |
1.9 |
|
|
Of which China+Indonesia |
1050 |
1206 |
1330 |
1389 |
1417 |
|
|
% change |
8.5 |
14.8 |
10.3 |
4.4 |
2.0 |
|
|
Of which ROW |
906 |
933 |
957 |
971 |
988 |
|
|
% change |
4.5 |
3.0 |
2.6 |
1.4 |
1.7 |
|
|
Balance |
44 |
-67 |
-152 |
-105 |
-59 |
|
|
LME Price ($/t) |
9606 |
10405 |
14065 |
17250 |
17250 |
|
|
|
|
|
|
|
|
|
Exhibit 101: GS zinc supply and demand balance
|
(’000t) |
2016 |
2017 |
2018E |
2019E |
2020E |
|
|
Mine Supply |
12445 |
12991 |
13467 |
14341 |
15131 |
|
|
% change |
-5.4 |
4.4 |
3.7 |
6.5 |
5.5 |
|
|
|
|
|
|
|
|
|
|
Refined Supply |
13900 |
13700 |
14100 |
14750 |
15300 |
|
|
% change |
0.6 |
-1.4 |
2.9 |
4.6 |
3.7 |
|
|
|
|
|
|
|
|
|
|
Refined Consumption |
14038 |
14344 |
14622 |
14870 |
15114 |
|
|
% change |
1.9 |
2.2 |
1.9 |
1.7 |
1.6 |
|
|
Of which China |
6624 |
6823 |
6959 |
7064 |
7170 |
|
|
% change |
3.0 |
3.0 |
2.0 |
1.5 |
1.5 |
|
|
Of which ex-China |
7414 |
7521 |
7662 |
7807 |
7944 |
|
|
% change |
0.9 |
1.4 |
1.9 |
1.9 |
1.8 |
|
|
Balance |
-138 |
-644 |
-522 |
-120 |
186 |
|
|
LME Price ($/t) |
2094 |
2893 |
3024 |
2975 |
2700 |
|
|
|
|
|
|
|
|
|
Source: Goldman Sachs Global Investment Research |
Source: Goldman Sachs Global Investment Research |
5 November 2018 |
28 |