

GS Metals Monitor_watermark
.pdfvk.com/id446425943
Goldman Sachs
Metals Monitor
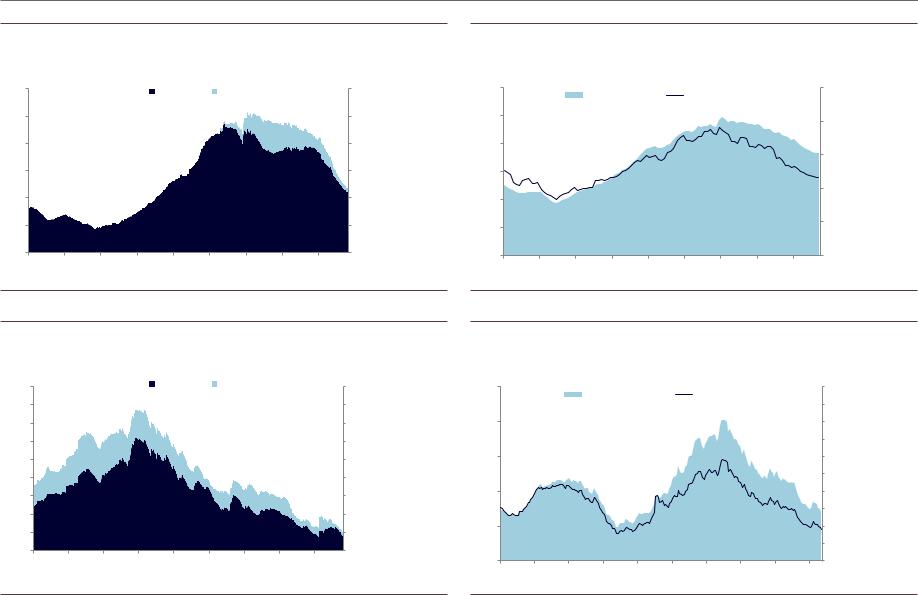
Exhibit 30: Aluminum exchange inventory
kt |
Aluminum Exchange Inventory |
kt |
7,000 |
|
|
|
LME |
SHFE |
|
7,000 |
|
6,000 |
|
|
|
|
|
|
|
6,000 |
5,000 |
|
|
|
|
|
|
|
5,000 |
4,000 |
|
|
|
|
|
|
|
4,000 |
3,000 |
|
|
|
|
|
|
|
3,000 |
2,000 |
|
|
|
|
|
|
|
2,000 |
1,000 |
|
|
|
|
|
|
|
1,000 |
0 |
|
|
|
|
|
|
|
0 |
2010 |
2011 |
2012 |
2013 |
2014 |
2015 |
2016 |
2017 |
2018 |
Source: Bloomberg, Goldman Sachs Global Investment Research
Exhibit 32: Copper exchange inventory
kt |
Copper Exchange Inventory |
kt |
1,000 |
|
|
LME |
|
SHFE |
COMEX |
1,000 |
|
900 |
|
|
|
|
|
|
|
900 |
800 |
|
|
|
|
|
|
|
800 |
700 |
|
|
|
|
|
|
|
700 |
600 |
|
|
|
|
|
|
|
600 |
500 |
|
|
|
|
|
|
|
500 |
400 |
|
|
|
|
|
|
|
400 |
300 |
|
|
|
|
|
|
|
300 |
200 |
|
|
|
|
|
|
|
200 |
100 |
|
|
|
|
|
|
|
100 |
0 |
|
|
|
|
|
|
|
0 |
2010 |
2011 |
2012 |
2013 |
2014 |
2015 |
2016 |
2017 |
2018 |
Exhibit 31: Aluminum total inventory
kt |
|
|
Global Aluminum Inventory |
|
|
Days |
|||
16,000 |
|
|
Level |
|
Days of Use (RHS) |
|
140 |
||
|
|
|
|
|
|
||||
14,000 |
|
|
|
|
|
|
|
|
120 |
|
|
|
|
|
|
|
|
|
|
12,000 |
|
|
|
|
|
|
|
|
100 |
|
|
|
|
|
|
|
|
|
|
10,000 |
|
|
|
|
|
|
|
|
80 |
|
|
|
|
|
|
|
|
|
|
8,000 |
|
|
|
|
|
|
|
|
|
6,000 |
|
|
|
|
|
|
|
|
60 |
|
|
|
|
|
|
|
|
|
|
4,000 |
|
|
|
|
|
|
|
|
40 |
|
|
|
|
|
|
|
|
|
|
2,000 |
|
|
|
|
|
|
|
|
20 |
|
|
|
|
|
|
|
|
|
|
0 |
|
|
|
|
|
|
|
|
0 |
2000 |
2002 |
2004 |
2006 |
2008 |
2010 |
2012 |
2014 |
2016 |
2018 |
Source: CRU, Goldman Sachs Global Investment Research
Exhibit 33: Copper total inventory
kt |
|
|
Refined Copper Inventory |
|
|
Days |
|||
2,500 |
|
|
|
|
60 |
||||
|
|
Global Total |
|
Days of Use (right) |
|
||||
2,300 |
|
|
|
|
|
||||
|
|
|
|
|
|
|
|
|
|
2,100 |
|
|
|
|
|
|
|
|
50 |
|
|
|
|
|
|
|
|
|
|
1,900 |
|
|
|
|
|
|
|
|
40 |
|
|
|
|
|
|
|
|
|
|
1,700 |
|
|
|
|
|
|
|
|
|
1,500 |
|
|
|
|
|
|
|
|
30 |
1,300 |
|
|
|
|
|
|
|
|
|
1,100 |
|
|
|
|
|
|
|
|
20 |
|
|
|
|
|
|
|
|
|
|
900 |
|
|
|
|
|
|
|
|
10 |
|
|
|
|
|
|
|
|
|
|
700 |
|
|
|
|
|
|
|
|
|
500 |
|
|
|
|
|
|
|
|
0 |
2000 |
2002 |
2004 |
2006 |
2008 |
2010 |
2012 |
2014 |
2016 |
2018 |
Source: Bloomberg, Goldman Sachs Global Investment Research |
Source: CRU, Goldman Sachs Global Investment Research |
5 November 2018 |
<< |
vk.com/id446425943
Goldman Sachs
Metals Monitor
Exhibit 34: Nickel exchange inventory
kt |
Nickel Exchange Inventory |
kt |
600 |
|
|
|
LME |
SHFE |
|
600 |
|
500 |
|
|
|
|
|
|
|
500 |
400 |
|
|
|
|
|
|
|
400 |
300 |
|
|
|
|
|
|
|
300 |
200 |
|
|
|
|
|
|
|
200 |
100 |
|
|
|
|
|
|
|
100 |
0 |
|
|
|
|
|
|
|
0 |
2010 |
2011 |
2012 |
2013 |
2014 |
2015 |
2016 |
2017 |
2018 |
Exhibit 35: Nickel total inventory
kt |
Days |
Refined Nickel Inventory
1,200 |
|
Global Total |
|
Days of Use (right) |
250 |
|||
|
|
|
|
|||||
1,000 |
|
|
|
|
|
|
|
200 |
|
|
|
|
|
|
|
|
|
800 |
|
|
|
|
|
|
|
150 |
|
|
|
|
|
|
|
|
|
600 |
|
|
|
|
|
|
|
|
400 |
|
|
|
|
|
|
|
100 |
|
|
|
|
|
|
|
|
|
200 |
|
|
|
|
|
|
|
50 |
|
|
|
|
|
|
|
|
|
0 |
|
|
|
|
|
|
|
0 |
2010 |
2011 |
2012 |
2013 |
2014 |
2015 |
2016 |
2017 |
2018 |
Source: Bloomberg, Goldman Sachs Global Investment Research
Exhibit 36: Zinc exchange inventory
kt |
Zinc Exchange Inventory |
kt |
1,800 |
|
|
|
LME |
SHFE |
|
1,800 |
|
1,600 |
|
|
|
|
|
|
|
1,600 |
1,400 |
|
|
|
|
|
|
|
1,400 |
1,200 |
|
|
|
|
|
|
|
1,200 |
1,000 |
|
|
|
|
|
|
|
1,000 |
800 |
|
|
|
|
|
|
|
800 |
600 |
|
|
|
|
|
|
|
600 |
400 |
|
|
|
|
|
|
|
400 |
200 |
|
|
|
|
|
|
|
200 |
0 |
|
|
|
|
|
|
|
0 |
2010 |
2011 |
2012 |
2013 |
2014 |
2015 |
2016 |
2017 |
2018 |
Source: CRU, Goldman Sachs Global Investment Research
Exhibit 37: Zinc total inventory
kt |
Refined Zinc Inventory |
Days |
2,500 |
|
|
Global Reported |
|
Days of Use (right) |
|
100 |
||
|
|
|
|
|
90 |
||||
|
|
|
|
|
|
|
|
|
|
2,000 |
|
|
|
|
|
|
|
|
80 |
|
|
|
|
|
|
|
|
|
70 |
1,500 |
|
|
|
|
|
|
|
|
60 |
|
|
|
|
|
|
|
|
|
50 |
1,000 |
|
|
|
|
|
|
|
|
40 |
|
|
|
|
|
|
|
|
|
30 |
500 |
|
|
|
|
|
|
|
|
20 |
|
|
|
|
|
|
|
|
|
10 |
0 |
|
|
|
|
|
|
|
|
0 |
2000 |
2002 |
2004 |
2006 |
2008 |
2010 |
2012 |
2014 |
2016 |
2018 |
Source: Bloomberg, Goldman Sachs Global Investment Research |
Source: CRU , Goldman Sachs Global Investment Research |
5 November 2018 |
<2 |
vk.com/id446425943
Goldman Sachs
Metals Monitor
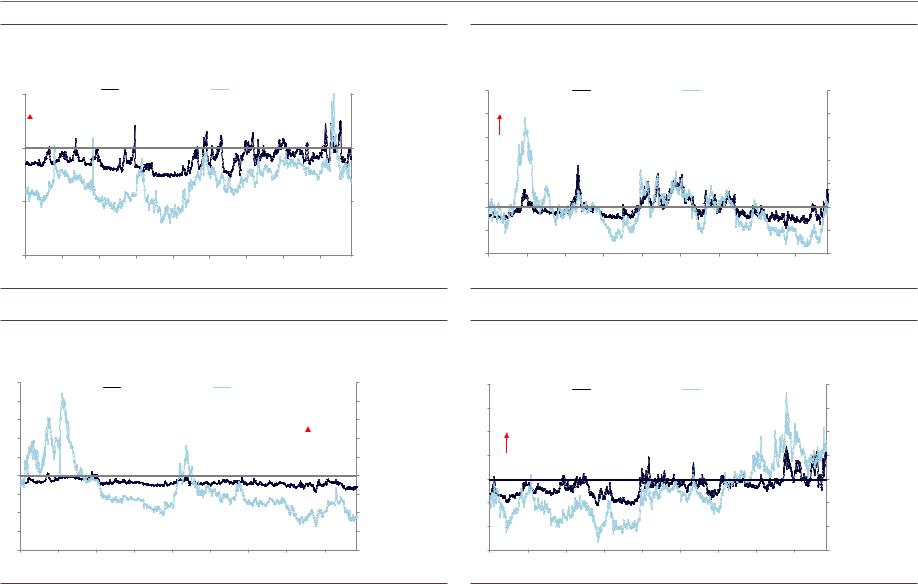
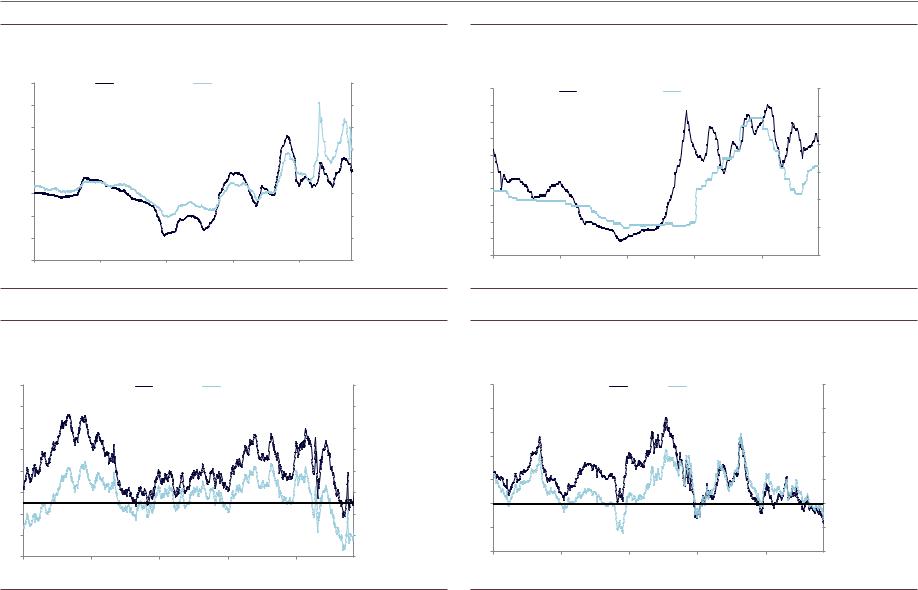
Exhibit 38: Aluminum timespreads
% |
|
|
Aluminum Timespreads |
|
% |
|||
|
|
|
|
|
||||
5 |
|
|
Spot to 3-month |
|
3 to 15-month |
5 |
||
|
|
|
|
|
|
|
||
Backwardation |
|
|
|
|
|
|
|
|
0 |
|
|
|
|
|
|
|
0 |
-5 |
|
|
|
|
|
|
|
-5 |
-10 |
|
|
|
|
|
|
|
-10 |
2010 |
2011 |
2012 |
2013 |
2014 |
2015 |
2016 |
2017 |
2018 |
Source: Bloomberg, Goldman Sachs Global Investment Research
Exhibit 40: Nickel timespreads
% |
|
|
|
Nickel Timespreads |
|
|
|
% |
|
5 |
|
|
|
|
|
|
5 |
||
|
|
Spot to 3-month |
|
3 to 15-month |
|
||||
|
|
|
|
|
|
||||
4 |
|
|
|
|
|
|
|
|
4 |
3 |
|
|
|
|
|
|
Backwardation |
3 |
|
2 |
|
|
|
|
|
|
|
|
2 |
1 |
|
|
|
|
|
|
|
|
1 |
0 |
|
|
|
|
|
|
|
|
0 |
-1 |
|
|
|
|
|
|
|
|
-1 |
-2 |
|
|
|
|
|
|
|
|
-2 |
-3 |
|
|
|
|
|
|
|
|
-3 |
-4 |
|
|
|
|
|
|
|
|
-4 |
2010 |
2011 |
2012 |
2013 |
2014 |
2015 |
2016 |
2017 |
2018 |
|
Exhibit 39: Copper timespreads
% |
|
|
|
Copper Timespreads |
|
% |
|||
|
|
|
|
|
|
||||
5 |
|
|
|
Spot to 3-month |
|
3 to 15-month |
5 |
||
4 |
Backwardation |
|
|
|
|
|
4 |
||
|
|
|
|
|
|
|
|
||
3 |
|
|
|
|
|
|
|
|
3 |
2 |
|
|
|
|
|
|
|
|
2 |
1 |
|
|
|
|
|
|
|
|
1 |
0 |
|
|
|
|
|
|
|
|
0 |
-1 |
|
|
|
|
|
|
|
|
-1 |
-2 |
|
|
|
|
|
|
|
|
-2 |
2010 |
2011 |
2012 |
2013 |
2014 |
2015 |
2016 |
2017 |
2018 |
|
Source: Bloomberg, Goldman Sachs Global Investment Research
Exhibit 41: Zinc timespreads
% |
|
|
|
Zinc Timespreads |
|
|
% |
|
|
|
|
|
|
|
|
||
8 |
|
|
Spot to 3-month |
|
3 to 15-month |
8 |
||
|
|
|
|
|
||||
6 |
|
|
|
|
|
|
|
6 |
4 |
Backwardation |
|
|
|
|
|
4 |
|
|
|
|
|
|
|
|
||
2 |
|
|
|
|
|
|
|
2 |
0 |
|
|
|
|
|
|
|
0 |
-2 |
|
|
|
|
|
|
|
-2 |
-4 |
|
|
|
|
|
|
|
-4 |
-6 |
|
|
|
|
|
|
|
-6 |
2010 |
2011 |
2012 |
2013 |
2014 |
2015 |
2016 |
2017 |
2018 |
Source: Bloomberg, Goldman Sachs Global Investment Research |
Source: Bloomberg, Goldman Sachs Global Investment Research |
5 November 2018 |
<3 |
vk.com/id446425943
Goldman Sachs
Metals Monitor
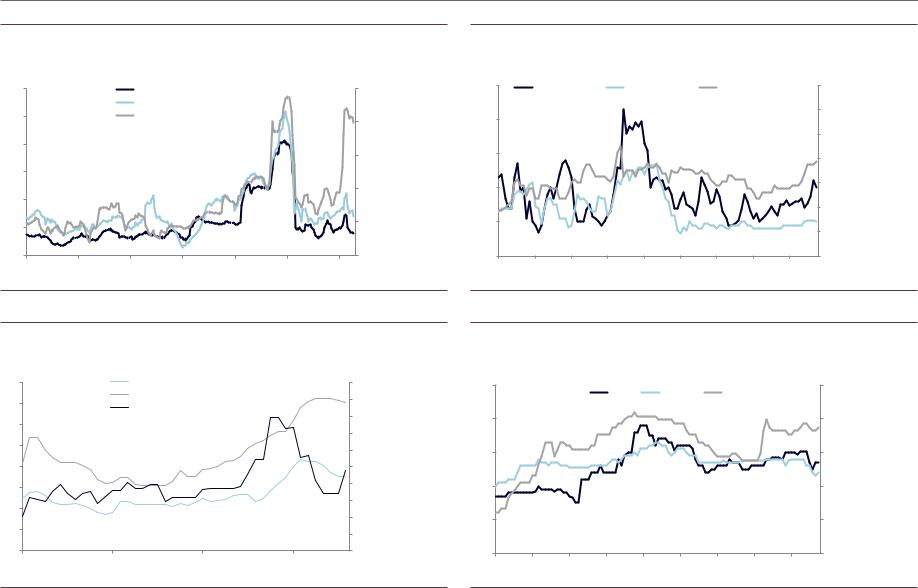
Exhibit 42: Aluminum physical premium
US$/t |
Aluminum Physical Premium |
c/lb |
|
|
600 |
|
Japan Ingot Western (Spot) CIF |
|
25 |
||
|
|
Rotterdam Ingot Duty Paid |
|
|
||
500 |
|
US Midwest Ingot P1020 (right) |
|
20 |
||
|
|
|
|
|
|
|
400 |
|
|
|
|
|
15 |
|
|
|
|
|
|
|
300 |
|
|
|
|
|
|
200 |
|
|
|
|
|
10 |
|
|
|
|
|
|
|
100 |
|
|
|
|
|
5 |
|
|
|
|
|
|
|
0 |
|
|
|
|
|
0 |
2000 |
2003 |
2006 |
2009 |
2012 |
2015 |
2018 |
Exhibit 43: Copper physical premium
USD/t |
Refined Copper Physical Premium |
USDc/lb |
250 |
Shanghai CIF |
|
Rotterdam CIF |
US East Coast (right) |
14 |
||||
200 |
|
|
|
|
|
|
|
|
12 |
|
|
|
|
|
|
|
|
|
|
|
|
|
|
|
|
|
|
|
10 |
150 |
|
|
|
|
|
|
|
|
8 |
|
|
|
|
|
|
|
|
|
|
100 |
|
|
|
|
|
|
|
|
6 |
|
|
|
|
|
|
|
|
|
|
|
|
|
|
|
|
|
|
|
4 |
50 |
|
|
|
|
|
|
|
|
2 |
|
|
|
|
|
|
|
|
|
|
0 |
|
|
|
|
|
|
|
|
0 |
2010 |
2011 |
2012 |
2013 |
2014 |
2015 |
2016 |
2017 |
2018 |
|
Source: CRU
Exhibit 44: Nickel physical premium
c/lb |
Nickel Physical Premium |
$/tonne |
40 |
|
Rotterdam Melting Grade |
20 |
35 |
|
US Midwest Melting Grade |
18 |
|
China Full Plate Cathode CIF (right) |
||
|
|
||
|
|
16 |
|
30 |
|
|
|
|
|
14 |
|
|
|
|
|
25 |
|
|
12 |
|
|
|
|
20 |
|
|
10 |
15 |
|
|
8 |
|
|
|
|
10 |
|
|
6 |
|
|
4 |
|
|
|
|
|
5 |
|
|
2 |
|
|
|
|
0 |
|
|
0 |
2015 |
2016 |
2017 |
2018 |
Source: CRU
Exhibit 45: Zinc physical premium
USD/t |
|
|
Refined Zinc Physical Premium |
|
USD/t |
|||
250 |
|
|
|
250 |
||||
|
|
Asia |
|
Europe |
US |
|
||
|
|
|
|
|
|
|||
200 |
|
|
|
|
|
|
|
200 |
150 |
|
|
|
|
|
|
|
150 |
100 |
|
|
|
|
|
|
|
100 |
50 |
|
|
|
|
|
|
|
50 |
0 |
|
|
|
|
|
|
|
0 |
2010 |
2011 |
2012 |
2013 |
2014 |
2015 |
2016 |
2017 |
2018 |
Source: CRU |
Source: CRU |
5 November 2018 |
<4 |

vk.com/id446425943
Goldman Sachs
Metals Monitor
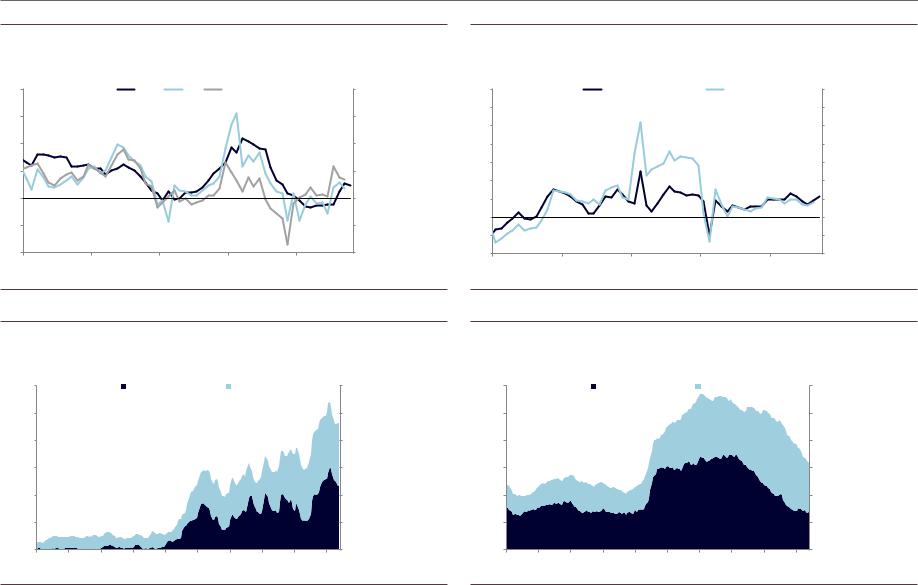
Exhibit 46: Aluminum money manager positioning
$Bn |
Aluminum Money Manager Positioning |
$Bn |
||
|
|
|||
20 |
Long |
Short |
Net |
20 |
15 |
|
|
|
15 |
10 |
|
|
|
10 |
5 |
|
|
|
5 |
0 |
|
|
|
0 |
-5 |
|
|
|
-5 |
-10 |
|
|
|
-10 |
-15 |
|
|
|
-15 |
*data break on 2/22/2018 due to LME reporting changes.
-20 |
|
|
|
|
|
|
-20 |
|
|
|
|
|
|
||
Aug-14 |
May-15 |
Feb-16 |
Nov-16 |
Aug-17 |
May-18 |
||
Exhibit 47: Copper money manager positioning
$Bn |
|
Copper Money Manager Positioning |
$Bn |
||
|
|
|
|||
40 |
|
Long |
Short |
Net |
40 |
30 |
|
|
|
|
30 |
20 |
|
|
|
|
20 |
10 |
|
|
|
|
10 |
0 |
|
|
|
|
0 |
-10 |
|
|
|
|
-10 |
-20 |
|
|
|
|
-20 |
-30 *data break on 2/22/2018 due to LME reporting changes. |
|
-30 |
|||
Aug-14 |
May-15 |
Feb-16 |
Nov-16 |
Aug-17 |
May-18 |
Source: Bloomberg, Goldman Sachs Global Investment Research |
Source: Bloomberg, Goldman Sachs Global Investment Research |
Exhibit 48: Nickel money manager positioning
$Bn |
|
|
Nickel Money Manager Positioning |
$Bn |
||
50 |
|
|
50 |
|||
|
|
Long |
Short |
Net |
||
|
|
|
|
|||
40 |
|
|
|
|
|
40 |
30 |
|
|
|
|
|
30 |
20 |
|
|
|
|
|
20 |
10 |
|
|
|
|
|
10 |
0 |
|
|
|
|
|
0 |
-10 |
|
|
|
|
|
-10 |
-20 |
|
|
|
|
|
-20 |
-30 |
*data break on 2/22/2018 due to LME reporting changes. |
|
-30 |
|||
|
|
|
|
|
||
Aug-14 |
May-15 |
Feb-16 |
Nov-16 |
Aug-17 |
May-18 |
|
Exhibit 49: Zinc money manager positioning
$Bn |
|
Zinc Money Manager Positioning |
$Bn |
||
16 |
|
16 |
|||
|
Long |
Short |
Net |
||
|
|
|
|||
12 |
|
|
|
|
12 |
8 |
|
|
|
|
8 |
4 |
|
|
|
|
4 |
0 |
|
|
|
|
0 |
-4 |
|
|
|
|
-4 |
*data break on 2/22/2018 due to LME reporting changes. |
|
-8 |
|||
-8 |
|
|
|
|
|
Aug-14 |
May-15 |
Feb-16 |
Nov-16 |
Aug-17 |
May-18 |
Source: Bloomberg, Goldman Sachs Global Investment Research |
Source: Bloomberg, Goldman Sachs Global Investment Research |
5 November 2018 |
<5 |

vk.com/id446425943
Goldman Sachs
Metals Monitor
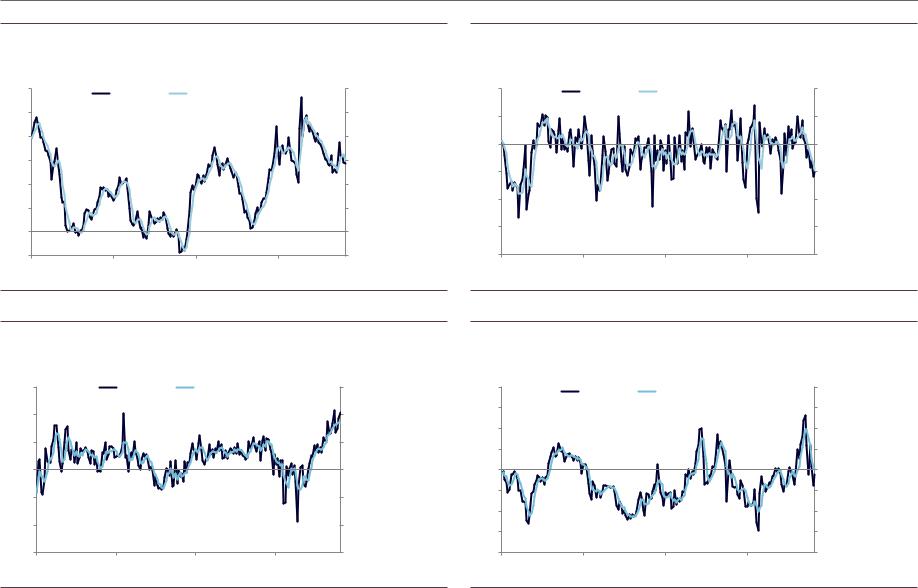
Exhibit 50: Aluminum realized and implied volatility
% |
Aluminum Price Volatility |
Index |
|
|
40 |
|
VIX (right) |
|
3m Implied Vol |
3m Realized Vol |
50 |
||
35 |
|
|
45 |
|||||
|
|
|
|
|
|
|
||
|
|
|
|
|
|
|
|
|
30 |
|
|
|
|
|
|
|
40 |
|
|
|
|
|
|
|
35 |
|
|
|
|
|
|
|
|
|
|
25 |
|
|
|
|
|
|
|
30 |
|
|
|
|
|
|
|
|
|
20 |
|
|
|
|
|
|
|
25 |
15 |
|
|
|
|
|
|
|
20 |
|
|
|
|
|
|
|
|
|
10 |
|
|
|
|
|
|
|
15 |
|
|
|
|
|
|
|
10 |
|
|
|
|
|
|
|
|
|
|
5 |
|
|
|
|
|
|
|
5 |
|
|
|
|
|
|
|
|
|
0 |
|
|
|
|
|
|
|
0 |
2010 |
2011 |
2012 |
2013 |
2014 |
2015 |
2016 |
2017 |
2018 |
Source: Goldman Sachs Global Investment Research
Exhibit 52: Nickel realized and implied price volatility
% |
|
|
Nickel Price Volatility |
|
|
Index |
||
60 |
|
|
|
|
50 |
|||
|
VIX (right) |
|
3m Implied Vol |
3m Realized Vol |
||||
|
|
|
45 |
|||||
50 |
|
|
|
|
|
|
|
|
|
|
|
|
|
|
|
40 |
|
|
|
|
|
|
|
|
|
|
40 |
|
|
|
|
|
|
|
35 |
|
|
|
|
|
|
|
30 |
|
|
|
|
|
|
|
|
|
|
30 |
|
|
|
|
|
|
|
25 |
20 |
|
|
|
|
|
|
|
20 |
|
|
|
|
|
|
|
15 |
|
|
|
|
|
|
|
|
|
|
10 |
|
|
|
|
|
|
|
10 |
|
|
|
|
|
|
|
5 |
|
|
|
|
|
|
|
|
|
|
0 |
|
|
|
|
|
|
|
0 |
2010 |
2011 |
2012 |
2013 |
2014 |
2015 |
2016 |
2017 |
2018 |
Exhibit 51: Copper realized and implied volatility
% |
|
|
Copper Price Volatility |
|
|
Index |
||
60 |
|
|
|
|
50 |
|||
|
VIX (right) |
|
3m Implied Vol |
3m Realized Vol |
||||
|
|
|
45 |
|||||
50 |
|
|
|
|
|
|
|
|
|
|
|
|
|
|
|
40 |
|
|
|
|
|
|
|
|
|
|
40 |
|
|
|
|
|
|
|
35 |
|
|
|
|
|
|
|
30 |
|
|
|
|
|
|
|
|
|
|
30 |
|
|
|
|
|
|
|
25 |
20 |
|
|
|
|
|
|
|
20 |
|
|
|
|
|
|
|
15 |
|
|
|
|
|
|
|
|
|
|
10 |
|
|
|
|
|
|
|
10 |
|
|
|
|
|
|
|
5 |
|
|
|
|
|
|
|
|
|
|
0 |
|
|
|
|
|
|
|
0 |
2010 |
2011 |
2012 |
2013 |
2014 |
2015 |
2016 |
2017 |
2018 |
Source: Goldman Sachs Global Investment Research
Exhibit 53: Zinc realized and implied price volatility
% |
|
|
|
Zinc Price Volatility |
|
|
Index |
|
60 |
|
|
|
|
|
50 |
||
|
VIX (right) |
|
3m Implied Vol |
3m Realized Vol |
||||
|
|
|
45 |
|||||
50 |
|
|
|
|
|
|
|
|
|
|
|
|
|
|
|
40 |
|
|
|
|
|
|
|
|
|
|
40 |
|
|
|
|
|
|
|
35 |
|
|
|
|
|
|
|
30 |
|
|
|
|
|
|
|
|
|
|
30 |
|
|
|
|
|
|
|
25 |
20 |
|
|
|
|
|
|
|
20 |
|
|
|
|
|
|
|
15 |
|
|
|
|
|
|
|
|
|
|
10 |
|
|
|
|
|
|
|
10 |
|
|
|
|
|
|
|
5 |
|
|
|
|
|
|
|
|
|
|
0 |
|
|
|
|
|
|
|
0 |
2010 |
2011 |
2012 |
2013 |
2014 |
2015 |
2016 |
2017 |
2018 |
Source: Goldman Sachs Global Investment Research |
Source: Goldman Sachs Global Investment Research |
5 November 2018 |
<6 |
vk.com/id446425943
Goldman Sachs
Metals Monitor
Exhibit 54: Aluminum SHFE/LME arbitrage
$/t |
Profits of Exporting Aluminum Semis from China to LME |
$/t |
|||
600 |
600 |
||||
Weekly |
4-Week Moving Average |
||||
|
|
||||
500 |
|
|
|
500 |
|
400 |
|
|
|
400 |
|
300 |
|
|
|
300 |
|
200 |
|
|
|
200 |
|
100 |
|
|
|
100 |
|
0 |
|
|
|
0 |
|
-100 |
|
|
|
-100 |
|
2015 |
2016 |
2017 |
2018 |
|
|
Source: Bloomberg, CRU, Goldman Sachs Global Investment Research
Exhibit 56: Nickel LME/SHFE arbitrage
$/t |
Profits of Importing LME Nickel into China |
$/t |
||
|
|
|||
1,500 |
Weekly |
4-Week Moving Average |
1,500 |
|
1,000 |
|
|
|
1,000 |
500 |
|
|
|
500 |
0 |
|
|
|
0 |
-500 |
|
|
|
-500 |
-1,000 |
|
|
|
-1,000 |
-1,500 |
|
|
|
-1,500 |
2015 |
2016 |
2017 |
2018 |
|
Exhibit 55: Copper LME/SHFE arbitrage
$/t |
Profits of Importing LME Copper into China |
$/t |
|
|
200 |
Weekly |
4-Week Moving Average |
200 |
|
100 |
|
|
|
100 |
0 |
|
|
|
0 |
-100 |
|
|
|
-100 |
-200 |
|
|
|
-200 |
-300 |
|
|
|
-300 |
-400 |
|
|
|
-400 |
2015 |
2016 |
2017 |
2018 |
|
Source: Bloomberg, CRU, Goldman Sachs Global Investment Research
Exhibit 57: Zinc LME/SHFE arbitrage
$/t |
$/t |
Profits of Importing LME Zinc into China
400 |
Weekly |
4-Week Moving Average |
400 |
|
|
|
|||
300 |
|
|
|
300 |
200 |
|
|
|
200 |
100 |
|
|
|
100 |
0 |
|
|
|
0 |
-100 |
|
|
|
-100 |
-200 |
|
|
|
-200 |
-300 |
|
|
|
-300 |
-400 |
|
|
|
-400 |
2015 |
2016 |
2017 |
2018 |
|
Source: Bloomberg, CRU, Goldman Sachs Global Investment Research |
Source: Bloomberg, CRU, Goldman Sachs Global Investment Research |
5 November 2018 |
<7 |
vk.com/id446425943
Goldman Sachs
Metals Monitor
Exhibit 58: China and ex-China alumina price
Rmb/t |
|
China and Ex-China Alumina Price |
$/t |
|
5000 |
|
China Average |
Australia FOB (right) |
800 |
4500 |
|
|
|
700 |
4000 |
|
|
|
600 |
3500 |
|
|
|
500 |
3000 |
|
|
|
400 |
2500 |
|
|
|
300 |
2000 |
|
|
|
200 |
1500 |
|
|
|
100 |
1000 |
|
|
|
0 |
2014 |
2015 |
2016 |
2017 |
2018 |
Source: Bloomberg
Exhibit 60: Ex-China aluminum smelter margins
% |
|
Ex-China Smelter Profit Margins |
% |
|
55 |
|
US |
Germany |
55 |
45 |
|
|
|
45 |
35 |
|
|
|
35 |
25 |
|
|
|
25 |
15 |
|
|
|
15 |
5 |
|
|
|
5 |
-5 |
|
|
|
-5 |
-15 |
|
|
|
-15 |
-25 |
|
|
|
-25 |
2014 |
2015 |
2016 |
2017 |
2018 |
Exhibit 59: China coal and anode price
Rmb/t |
Coal and Anode Price in China |
Rmb/t |
800 |
|
Qinhuangdao 5500 |
Prebaked Anode (right) |
5000 |
|
750 |
|
|
|
|
|
700 |
|
|
|
|
4500 |
|
|
|
|
|
|
650 |
|
|
|
|
4000 |
|
|
|
|
|
|
600 |
|
|
|
|
|
550 |
|
|
|
|
3500 |
500 |
|
|
|
|
|
450 |
|
|
|
|
3000 |
|
|
|
|
|
|
400 |
|
|
|
|
2500 |
|
|
|
|
|
|
350 |
|
|
|
|
|
300 |
|
|
|
|
2000 |
2014 |
2015 |
2016 |
2017 |
2018 |
|
Source: Bloomberg
Exhibit 61: China aluminum smelter margins
% |
|
Chinese Smelter Profit Margins |
% |
|
50 |
|
Captive |
On-Grid |
50 |
40 |
|
|
|
40 |
30 |
|
|
|
30 |
20 |
|
|
|
20 |
10 |
|
|
|
10 |
0 |
|
|
|
0 |
-10 |
|
|
|
-10 |
-20 |
|
|
|
-20 |
2014 |
2015 |
2016 |
2017 |
2018 |
Source: Bloomberg, Wood Mackenzie, Goldman Sachs Global Investment Research |
Source: Bloomberg, Wood Mackenzie, CEIC, Goldman Sachs Global Investment Research |
5 November 2018 |
<8 |
vk.com/id446425943
Goldman Sachs
Metals Monitor
Exhibit 62: China aluminum production |
|
|
|||
% |
YoY Percent Change in China Aluminum Production |
% |
|||
40 |
|
CRU |
IAI |
NBS |
40 |
30 |
|
|
|
|
30 |
20 |
|
|
|
|
20 |
10 |
|
|
|
|
10 |
0 |
|
|
|
|
0 |
-10 |
|
|
|
|
-10 |
-20 |
|
|
|
|
-20 |
2014 |
2015 |
2016 |
|
2017 |
2018 |
Source: CRU, IAI, Haver Analytics, Goldman Sachs Global Investment Research
Exhibit 64: China aluminum inventory
kt |
|
|
|
China Aluminum Inventory |
|
|
kt |
||
6,000 |
|
|
Reported |
|
Unreported |
|
6,000 |
||
5,000 |
|
|
|
|
|
|
|
|
5,000 |
4,000 |
|
|
|
|
|
|
|
|
4,000 |
3,000 |
|
|
|
|
|
|
|
|
3,000 |
2,000 |
|
|
|
|
|
|
|
|
2,000 |
1,000 |
|
|
|
|
|
|
|
|
1,000 |
0 |
|
|
|
|
|
|
|
|
0 |
2000 |
2002 |
2004 |
2006 |
2008 |
2010 |
2012 |
2014 |
2016 |
2018 |
Exhibit 63: Ex-china aluminum production
% |
YoY Percent Change in Ex-China Aluminum Production |
% |
14 |
|
CRU |
IAI |
14 |
12 |
|
|
|
12 |
10 |
|
|
|
10 |
8 |
|
|
|
8 |
6 |
|
|
|
6 |
4 |
|
|
|
4 |
2 |
|
|
|
2 |
0 |
|
|
|
0 |
-2 |
|
|
|
-2 |
-4 |
|
|
|
-4 |
2014 |
2015 |
2016 |
2017 |
2018 |
Source: CRU, IAI, Goldman Sachs Global Investment Research
Exhibit 65: Ex-China aluminum inventory
kt |
|
|
Ex-China Aluminum Inventory |
|
kt |
||||
|
|
|
|
|
|||||
12,000 |
|
|
Reported |
|
Unreported |
|
12,000 |
||
10,000 |
|
|
|
|
|
|
|
|
10,000 |
8,000 |
|
|
|
|
|
|
|
|
8,000 |
6,000 |
|
|
|
|
|
|
|
|
6,000 |
4,000 |
|
|
|
|
|
|
|
|
4,000 |
2,000 |
|
|
|
|
|
|
|
|
2,000 |
0 |
|
|
|
|
|
|
|
|
0 |
2000 |
2002 |
2004 |
2006 |
2008 |
2010 |
2012 |
2014 |
2016 |
2018 |
Source: CRU, Goldman Sachs Global Investment Research |
Source: CRU, Goldman Sachs Global Investment Research |
5 November 2018 |
<9 |

vk.com/id446425943
Goldman Sachs
Metals Monitor
Exhibit 66: YoY growth in copper mine production in Chile and Peru
% |
Year-over-Year Growth in Copper Mine Production |
% |
|||
40 |
|
Chile |
Peru (right) |
|
80 |
30 |
|
|
|
|
70 |
|
|
|
|
60 |
|
|
|
|
|
|
|
20 |
|
|
|
|
50 |
10 |
|
|
|
|
40 |
|
|
|
|
30 |
|
0 |
|
|
|
|
|
|
|
|
|
20 |
|
|
|
|
|
|
|
-10 |
|
|
|
|
10 |
-20 |
|
|
|
|
0 |
|
|
|
|
-10 |
|
|
|
|
|
|
|
-30 |
|
|
|
|
-20 |
2014 |
2015 |
2016 |
2017 |
2018 |
|
Source: Haver Analytics, Goldman Sachs Global Investment Research
Exhibit 68: Copper TCRC
c/lb |
2003-11 Median |
|
2015 |
|
2016 |
2017 |
|
c/lb |
|||
|
|
|
2018 |
||||||||
30 |
|
|
|
|
|
|
|
|
|
|
30 |
25 |
|
|
|
|
|
|
|
|
|
|
25 |
20 |
|
|
|
|
|
|
|
|
|
|
20 |
15 |
|
|
|
|
|
|
|
|
|
|
15 |
10 |
|
|
|
|
|
|
|
|
|
|
10 |
5 |
|
|
|
|
|
|
|
|
|
|
5 |
0 |
|
|
|
|
|
|
|
|
|
|
0 |
Jan |
Feb |
Mar |
Apr |
May |
Jun |
Jul |
Aug |
Sep |
Oct |
Nov |
Dec |
Exhibit 67: Combined Chile and Peru copper mine production
kt |
Chile and Peru Copper Production |
% |
850 |
Monthly Production Level |
Year-over-Year Growth (right) |
25 |
||
800 |
|
|
|
|
20 |
750 |
|
|
|
|
15 |
700 |
|
|
|
|
10 |
650 |
|
|
|
|
5 |
600 |
|
|
|
|
0 |
550 |
|
|
|
|
-5 |
500 |
|
|
|
|
-10 |
450 |
|
|
|
|
-15 |
400 |
|
|
|
|
-20 |
2014 |
2015 |
2016 |
2017 |
2018 |
|
Source: Haver Analytics, Goldman Sachs Global Investment Research
Exhibit 69: Time-varying correlation between daily changes in copper and USD
Correlation |
|
60-Day Rolling Correlation between Copper and |
Correlation |
|||
0.4 |
|
USD Daily Changes |
|
|
0.4 |
|
0.2 |
|
|
|
|
|
0.2 |
0.0 |
|
|
|
|
|
0.0 |
-0.2 |
|
|
|
|
|
-0.2 |
-0.4 |
|
|
|
|
|
-0.4 |
-0.6 |
|
|
|
|
|
-0.6 |
-0.8 |
|
|
|
|
|
-0.8 |
-1.0 |
|
|
|
|
|
-1.0 |
2000 |
2003 |
2006 |
2009 |
2012 |
2015 |
2018 |
Source: Wood Mackenzie |
Source: Bloomberg, Goldman Sachs Global Investment Research |
5 November 2018 |
20 |