

GS Landing the Plane_watermark
.pdfvk.com/id446425943
14 November 2018 | 11:00AM EST
Global Economics Analyst
Landing the Plane
nThe global economy looks poised to slow moderately from 3.8% in 2018 to 3.5% in 2019, led by deceleration in the US and further softening in China. But with growth still above potential in most DM economies, we look for continued labor market tightening, gradually rising core inflation, and in many cases higher policy rates.
nOur Fed call remains hawkish relative to the market, with five more 25bp hikes to a terminal 3¼-3½% funds rate at the end of 2019. While higher rates and tighter financial conditions should help slow growth to its potential rate over the next year, we expect a decline in the unemployment rate to 3% and a rise in core inflation to 2¼% by early 2020.
nWe think concerns about the global impact of tighter Fed policy are overdone. Spillovers to EM are real, but the market has already priced 11 of the 13 hikes we expect for this cycle, so most of the adjustment to more normal US interest rates is probably behind us. The main risk to this view is a more substantial US overheating that eventually forces steeper rate hikes.
nChina has slowed quite sharply in 2018, on the back of slower credit growth and fears about a more damaging trade war. With monetary and fiscal policy now in easing mode, we expect only a modest further deceleration. The macro impact of increasing tariffs is also likely to remain manageable, even under our call for some further escalation in early 2019.
nAlthough growth in Europe and Japan has decelerated in the course of 2018, it remains above trend. This should put further downward pressure on the unemployment rate and keep the recent upward trend in wage growth intact. However, with core inflation still far below the target, the Italian budget crisis unresolved, and Brexit negotiations ongoing, the risks to our forecasts of a first hike in the ECB deposit rate in Q4 2019 are tilted to the later side.
nBeyond 2019, the risk of a global recession is likely to rise as more and more DM economies move beyond full employment. However, even in subsequent years recession is not our base case. Financial imbalances still look very limited, and the flatter and more anchored Phillips curve has reduced the need for central banks to reverse an overshooting of full employment quickly.
Jan Hatzius
+1(212)902-0394 | jan.hatzius@gs.com Goldman Sachs & Co. LLC
Sven Jari Stehn
+44(20)7774-8061 | jari.stehn@gs.com Goldman Sachs International
Nicholas Fawcett
+44(20)7051-8321 | nicholas.fawcett@gs.com Goldman Sachs International
Soeren Radde
+44(20)7774-1105 | soeren.radde@gs.com Goldman Sachs International
Manav Chaudhary
+44(20)7051-3063 | manav.chaudhary@gs.com Goldman Sachs International
Investors should consider this report as only a single factor in making their investment decision. For Reg AC certification and other important disclosures, see the Disclosure Appendix, or go to www.gs.com/research/hedge.html.

vk.com/id446425943
Goldman Sachs
Landing the Plane
Global Economics Analyst
When the books are closed on 2018, it should look like a pretty good year for the global economy. Real GDP growth is on track for 3.8%, which is above potential if not quite as firm as suggested by the high-frequency indicators early in the year. The laggard economies in Europe and Japan saw further progress in the labor market, with ongoing strength in employment and declines in the unemployment rate. And the renewed “lowflation” concerns of 2017 have subsided on the back of stronger wage growth across the advanced economies and a rebound in US core inflation.
But the high-water mark on growth is probably behind us. As shown in Exhibit 1, we now expect global GDP to grow by 3.5% in 2019, with softer numbers across most DM economies as well as China. In most places where we have reliable supply-side estimates, our forecasts remain above potential, although the annual average numbers overstate the strength in cases such as the US where we see growth slowing through the year.
Exhibit 1: Our Global Growth Outlook
|
Real GDP Growth |
|
|
|
2018 (f) |
|
2019 (f) |
|
2020 (f) |
|
|
Percent Change yoy |
2016 |
2017 |
|
|
|
||||
|
GS |
Cons* |
GS |
Cons* |
GS |
Cons* |
||||
|
|
|
|
|||||||
|
|
|
|
|
|
|
|
|
|
|
|
US |
1.6 |
2.2 |
2.9 |
2.9 |
2.5 |
2.6 |
1.6 |
1.9 |
|
|
Japan |
1.0 |
1.7 |
0.9 |
1.1 |
1.0 |
1.1 |
0.6 |
0.6 |
|
|
Euro Area |
1.9 |
2.5 |
1.9 |
2.0 |
1.6 |
1.7 |
1.6 |
1.5 |
|
|
Germany |
2.2 |
2.5 |
1.7 |
1.8 |
1.9 |
1.7 |
1.6 |
1.5 |
|
|
France |
1.1 |
2.3 |
1.6 |
1.6 |
1.7 |
1.7 |
1.6 |
1.6 |
|
|
Italy |
1.0 |
1.6 |
1.0 |
1.1 |
0.4 |
1.0 |
1.1 |
0.9 |
|
|
Spain |
3.3 |
3.0 |
2.5 |
2.6 |
2.3 |
2.3 |
2.1 |
1.9 |
|
|
UK |
1.8 |
1.7 |
1.3 |
1.3 |
1.5 |
1.5 |
1.4 |
1.6 |
|
|
China |
6.7 |
6.9 |
6.6 |
6.6 |
6.2 |
6.2 |
6.1 |
6.0 |
|
|
India** |
7.9 |
6.3 |
7.5 |
7.4 |
7.3 |
7.5 |
7.9 |
- |
|
|
Russia |
-0.2 |
1.5 |
1.7 |
1.8 |
1.8 |
1.5 |
2.8 |
1.7 |
|
|
Brazil |
-3.5 |
1.0 |
1.2 |
1.4 |
2.6 |
2.3 |
3.0 |
2.6 |
|
|
Developed Markets |
1.7 |
2.4 |
2.4 |
2.4 |
2.1 |
2.1 |
1.7 |
1.7 |
|
|
Emerging Markets |
4.5 |
5.1 |
5.1 |
5.1 |
4.7 |
4.9 |
5.3 |
5.1 |
|
|
World |
3.1 |
3.8 |
3.8 |
3.9 |
3.5 |
3.6 |
3.6 |
3.6 |
|
* Bloomberg consensus forecasts as of November. ** Bloomberg consensus fiscal year basis
Source: Bloomberg, Goldman Sachs Global Investment Research
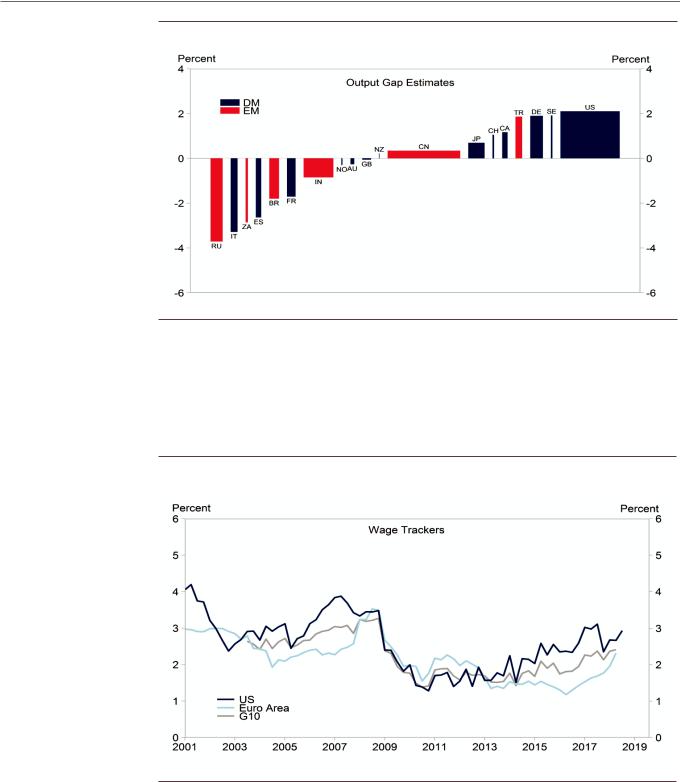
Part of the reason for slower growth is that a number of economies, especially in DM, are hitting capacity constraints. The estimates in Exhibit 2 imply that actual GDP is now 0.1% above potential at the global level, mainly because of early signs of overheating in the US, Germany, and a range of smaller DM economies.
14 November 2018 |
2 |
vk.com/id446425943
Goldman Sachs
Global Economics Analyst
Exhibit 2: A Number of DMs Are Running Hot
Note: Based on latest GDP data. Bar widths reflect GDP PPP weighting.
Source: Goldman Sachs Global Investment Research
One of the most notable recent developments has been the pickup in wage growth across most DM economies, illustrated in Exhibit 3. This is unsurprising in countries such as the US or Germany, where unemployment is already at historically low levels. But even the broader Euro area, as well as many of the smaller G10 economies, have seen a pickup of late.
Exhibit 3: A Notable Pickup in DM Wage Growth
Source: Goldman Sachs Global Investment Research
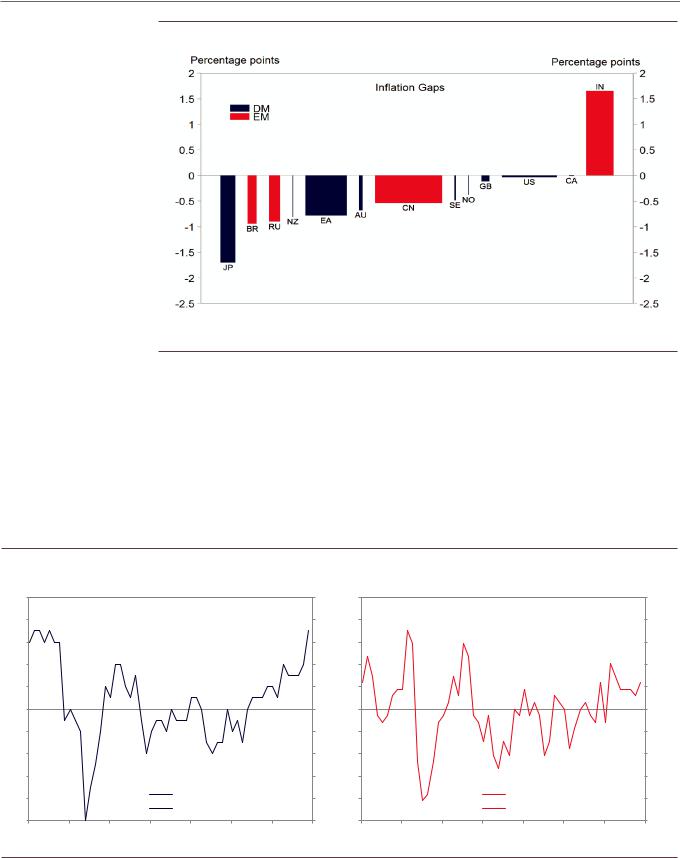
Core price inflation remains more disparate. Exhibit 4 shows that the US and a range of smaller DM economies are close to 2%, but both the Euro area and Japan are still quite far away from central bank goals—indicative of remaining slack (in Europe) and still-depressed inflation expectations (especially in Japan).
14 November 2018 |
3 |
vk.com/id446425943
Goldman Sachs
Global Economics Analyst
Exhibit 4: Divergence in Inflation Pressures
Note: Bar widths reflect GDP PPP weighting. We assume a 2% inflation target everywhere except in the Euro Area (1.9%),
Switzerland (1.9%), Australia (2.5%), China (2.25%), India (4%), Brazil (4.5%), and Russia (4%).
Source: Haver Analytics
The upturn in resource utilization and inflation has persuaded a number of central banks to start exiting from the very easy stance of monetary policy. As illustrated in Exhibit 5, our forecasts imply a fairly broad-based turn to higher rates across most DM economies, with Sweden, Australia, New Zealand, and (in our baseline forecast) the Euro area joining the US, UK, Canada, and Norway in lifting their policy rates. The EM monetary policy picture is likely to remain a bit more mixed. We expect hikes in countries such as India and Brazil but see cuts in countries such as Russia and South Africa.
Exhibit 5: A Broader Turn to Interest Rate Normalization in DM |
|
|
|
|
|
|
|
|
|
||||||
Index |
|
|
|
|
|
|
Index |
Index |
|
|
|
|
|
|
Index |
100 |
|
|
|
|
|
|
100 |
100 |
|
|
|
|
|
|
100 |
|
|
DM Central Bank Diffusion Index |
|
|
|
|
EM Central Bank Diffusion Index |
|
|
||||||
90 |
|
|
|
|
|
|
90 |
90 |
|
|
|
|
|
|
90 |
80 |
|
|
|
|
|
|
80 |
80 |
|
|
|
|
|
|
80 |
70 |
|
|
|
|
|
|
70 |
70 |
|
|
|
|
|
|
70 |
60 |
|
|
|
|
|
|
60 |
60 |
|
|
|
|
|
|
60 |
50 |
|
|
|
|
|
|
50 |
50 |
|
|
|
|
|
|
50 |
40 |
|
|
|
|
|
|
40 |
40 |
|
|
|
|
|
|
40 |
30 |
|
|
|
|
|
|
30 |
30 |
|
|
|
|
|
|
30 |
20 |
|
|
|
|
|
|
20 |
20 |
|
|
|
|
|
|
20 |
10 |
|
|
|
DM Central Bank Diffusion Index |
10 |
10 |
|
|
|
EM Central Bank Diffusion Index |
10 |
||||
|
|
|
GS Forecast |
|
|
|
|
|
GS Forecast |
|
|
||||
|
|
|
|
|
|
|
|
|
|
|
|
|
|
||
0 |
|
|
|
|
|
|
0 |
0 |
|
|
|
|
|
|
0 |
2006 |
2008 |
2010 |
2012 |
2014 |
2016 |
2018 |
|
2006 |
2008 |
2010 |
2012 |
2014 |
2016 |
2018 |
|
Note: Diffusion Index = 1 x percent of central banks hiking + 0.5 x percent of central banks on hold.
Source: Goldman Sachs Global Investment Research
14 November 2018 |
4 |
vk.com/id446425943
Goldman Sachs
Completing the Fed’s Job
Global Economics Analyst
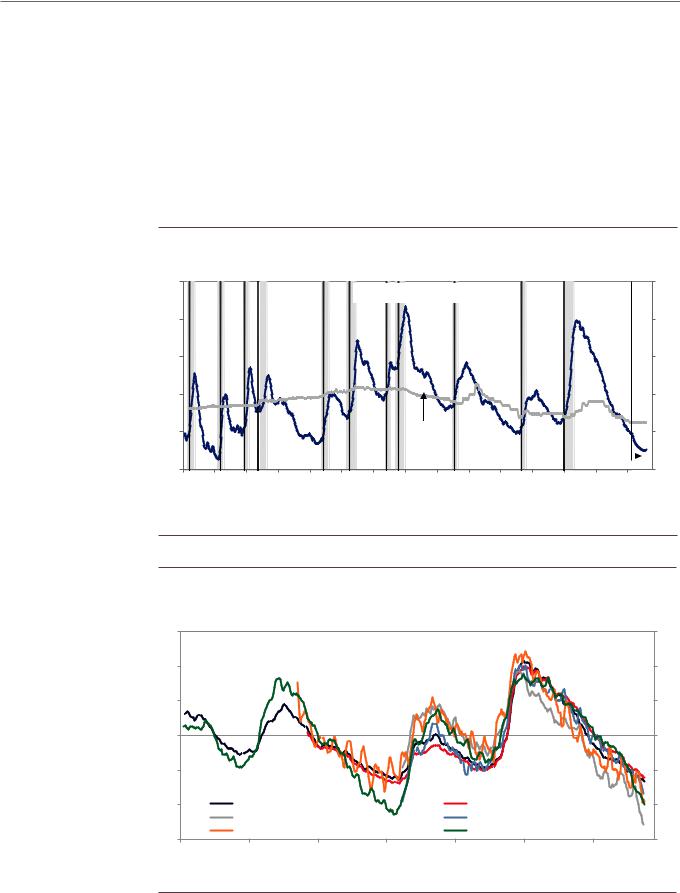
The United States is much further advanced in the cycle than most other DM economies. This is most clearly visible in the labor market, where Exhibit 6 shows that the unemployment rate now stands 0.8 percentage point (pp) below the Fed’s (and our) estimate of its full-employment level. This is a sizable gap by historical standards, comparable to that seen in 2000 and bigger than those seen at labor market peaks such as 2007 and 1989 (though not as extreme as in the Korean War boom of the early 1950s and the Vietnam War boom of the late 1960s). Moreover, Exhibit 7 shows that other labor market indicators—e.g., job openings, quits, reported skill shortages, and household labor market perceptions—show a similar message of near-record tightness.
Exhibit 6: The US Labor Market Has Started to Overheat…
Percent |
|
|
|
|
|
|
|
|
|
|
|
|
|
Percent |
|
12 |
|
|
|
|
|
Unemployment Rate* |
|
|
|
|
|
12 |
|||
|
|
|
|
|
|
|
|
|
|
|
|
||||
10 |
|
|
|
|
|
|
|
|
|
|
|
|
|
|
10 |
8 |
|
|
|
|
|
|
|
|
|
|
|
|
|
|
8 |
6 |
|
|
|
|
|
|
|
|
|
|
|
|
|
|
6 |
4 |
|
|
|
|
|
|
Structural |
|
|
|
GS |
4 |
|||
|
|
|
|
|
|
|
|
Rate |
|
|
|
|
|
||
|
|
|
|
|
|
|
|
|
|
|
|
Forecast |
|
||
|
|
|
|
|
|
|
|
|
|
|
|
|
|
||
2 |
|
|
|
|
|
|
|
|
|
|
|
|
|
|
2 |
1948 |
1953 |
1958 |
1963 |
1968 |
1973 |
1978 |
1983 |
1988 |
1993 |
1998 |
2003 |
2008 |
2013 |
2018 |
|
* 3-month moving average. Vertical lines denote months in which jobless rate rose more than 0.35 percentage points above the preceding low. Gray shading indicates NBER recession.
** We use estimates of the structural rate from the Fed since 1960 and the CBO before 1960.
Source: Department of Labor, NBER
Exhibit 7: ...Across a Broad Range of Measures
Z-scores, 3-month average |
|
|
|
|
Z-scores, 3-month average |
||
3 |
|
|
|
|
|
|
3 |
2 |
|
|
|
|
|
|
2 |
1 |
|
|
|
|
|
|
1 |
0 |
|
|
|
|
|
|
0 |
-1 |
|
|
|
|
|
|
-1 |
-2 |
Unemployment Rate U3 |
|
|
Expanded Unempl. Rate U6 |
-2 |
||
|
JOLTS Job Openings Rate* |
|
|
JOLTS Job Quits Rate* |
|
||
-3 |
NFIB Skill Shortages* |
|
|
Conference Board Job Availability* |
-3 |
||
|
|
|
|
|
|
||
1985 |
1990 |
1995 |
2000 |
2005 |
2010 |
2015 |
|
*Z-scores were inverted. Higher values denote more slack.
Source: Department of Labor, The Conference Board, JOLTS, NFIB, Goldman Sachs Global Investment Research
14 November 2018 |
5 |
vk.com/id446425943
Goldman Sachs
Global Economics Analyst
The tight labor market is increasingly translating into higher wages and prices. Wage growth is now up to about 3% year-on-year across a range of measures, with wage survey indicators pointing toward further gains. And while sequential core PCE price inflation has been a bit softer than expected recently, the year-on-year rate remains at 2.0% at a time when the tariff impact is probably just about to show up in higher goods pricing. We continue to expect a gradual move to about 2¼% by the end of 2019.
This implies that growth needs to slow to its estimated trend pace of 1¾% sooner rather than later, from a recent pace of around 3½%. Although the positive impact of fiscal policy—worth an estimated ¾pp at present—is likely to diminish in 2019, healthy household balance sheets, a relatively high personal saving rate, strong labor market momentum, and high business confidence all remain important near-term tailwinds. This means that we will probably need to see a significant negative impulse from financial conditions to slow growth down to a trend pace.
How big a negative US growth impulse can we expect from the recent FCI and equity market moves? It is hard to be precise, but Exhibit 8 implies a hit averaging about ¾pp in 2019 under GS forecasts for Fed policy and the different asset markets. Combined with the loss of fiscal impulse, we think this will slow growth to a trend pace by the end of 2019.
Exhibit 8: Tighter US Financial Conditions Point to a Headwind Next Year
Percentage points |
|
|
|
|
|
|
|
|
|
|
|
|
Percentage points |
||||||||||||||||
2.0 |
|
|
|
|
|
|
|
|
|
|
|
|
|
|
|
|
|
|
|
|
|
|
|
|
|
|
|
2.0 |
|
|
Effects on Real GDP Growth, 3-Quarter Centered Moving Average |
|
|
|
|
|
|
|
|||||||||||||||||||||
1.5 |
|
|
|
|
|
|
|
|
1.5 |
||||||||||||||||||||
|
|
|
Projected Impulse When the FCI is: |
|
|
|
|
|
|
|
|
|
|
|
|
||||||||||||||
1.0 |
|
|
|
|
|
|
|
|
|
|
|
|
|
|
|
1.0 |
|||||||||||||
|
|
|
|
|
Constant as of November 12 Close |
|
|
|
|
|
|
|
|
|
|
|
|
||||||||||||
|
|
|
|
|
|
|
|
|
|
|
|
|
|
|
|
|
|||||||||||||
0.5 |
|
|
|
|
|
GS Forecast |
|
|
|
|
|
|
|
|
|
|
|
|
|
|
|
|
0.5 |
||||||
|
|
|
|
|
|
|
|
|
|
|
|
|
|
|
|
|
|
|
|
|
|||||||||
|
|
|
|
|
|
|
|
|
|
|
|
|
|
|
|
|
|
|
|
|
|
|
|
|
|
|
|||
0.0 |
|
|
|
|
|
|
|
|
|
|
|
|
|
|
|
|
|
|
|
|
|
|
|
|
|
|
|
|
0.0 |
|
|
|
|
|
|
|
|
|
|
|
|
|
|
|
|
|
|
|
|
|
|
|
|
|
|
|
|
||
-0.5 |
|
|
|
|
|
|
|
|
|
|
|
|
|
|
|
|
|
|
|
|
|
|
|
|
|
|
|
-0.5 |
|
-1.0 |
|
|
|
|
|
|
|
|
|
|
|
|
|
|
|
|
|
|
|
|
|
|
|
|
|
|
|
-1.0 |
|
-1.5 |
|
|
|
|
|
|
|
|
|
|
|
|
|
|
|
|
|
|
|
|
|
|
|
|
|
|
|
-1.5 |
|
-2.0 |
|
|
|
|
|
|
|
|
|
|
|
|
|
|
|
|
|
|
|
|
|
|
|
|
|
|
|
|
-2.0 |
|
Q1 |
Q2 |
Q3 |
Q4 |
Q1 |
Q2 |
Q3 |
Q4 |
Q1 |
Q2 |
Q3 |
Q4 |
Q1 |
Q2 |
Q3 |
Q4 |
Q1 |
Q2 |
Q3 |
Q4 |
Q1 |
Q2 |
Q3 |
Q4 |
|
||||
|
|
|
|||||||||||||||||||||||||||
|
|
2014 |
|
|
2015 |
|
2016 |
|
2017 |
|
|
2018 |
|
2019 |
|
|
|
||||||||||||
Source: Goldman Sachs Global Investment Research
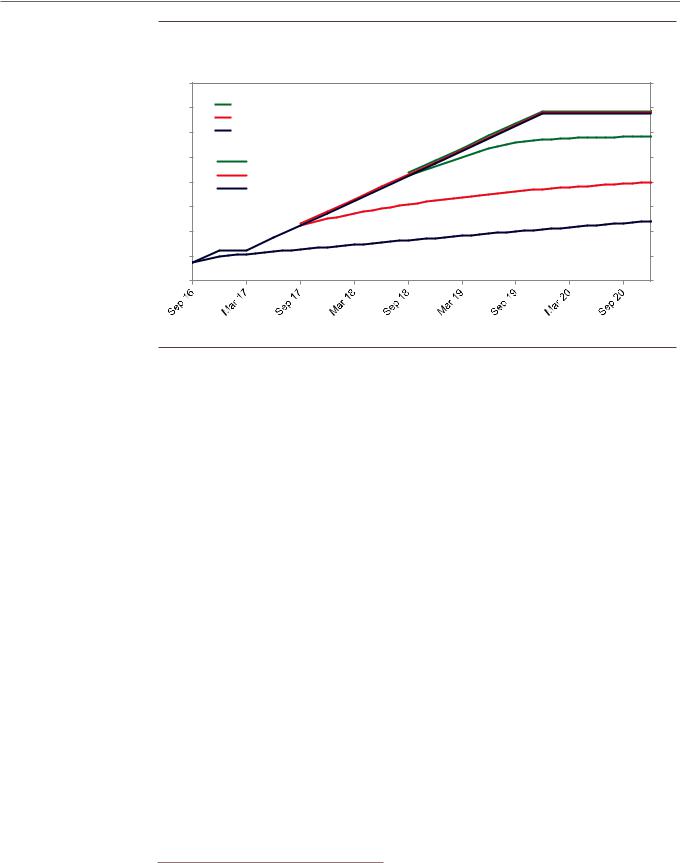
We therefore remain comfortable with our forecast of quarterly rate hikes until the funds rate hits 3¼-3½% by the end of 2019. This remains above market pricing, but Exhibit 9 shows that it is the smallest disagreement in quite a while. Two years ago, our funds rate call for the end of 2019 was 240 basis points (bp) above market pricing. One year ago, the gap had shrunk to 160bp. Now, the gap is 50bp. This is not a trivial amount, but we should also not overstate the required adjustment relative to the repricing that has already occurred.
14 November 2018 |
6 |
vk.com/id446425943
Goldman Sachs
Global Economics Analyst
Exhibit 9: More Repricing Needed, But Much of It Is Done
Percent |
|
Percent |
|
4.0 |
|
4.0 |
|
3.5 |
GS Forecast As Of: |
Federal Funds Rate |
|
November 2018 |
3.5 |
||
3.0 |
November 2017 |
3.0 |
|
November 2016 |
|||
2.5 |
Market Pricing As Of: |
2.5 |
|
November 2018 |
|||
|
|
||
2.0 |
November 2017 |
2.0 |
|
November 2016 |
|||
|
|
||
1.5 |
|
1.5 |
|
1.0 |
|
1.0 |
|
0.5 |
|
0.5 |
|
0.0 |
|
0.0 |
Source: Bloomberg, Goldman Sachs Global Investment Research
The Spillovers from Fed Tightening
Many investors agree that further funds rate hikes are needed from a domestic US perspective but worry that this will result in large negative spillovers to the rest of the world and thereby undermine the global recovery, and perhaps even the Fed’s ability to continue tightening. They point out that EM growth, in particular, underperformed expectations in 2018 and blame the shortfall on higher US rates and resulting upward pressure on the currency.
Our view is more nuanced. As shown in the left-hand chart of Exhibit 10, we find that Fed policy shocks do not have significant net effects on financial conditions in foreign advanced economies. This is because the exchange rate tends to cushion spillovers into long-term interest rates and equity prices in other DMs.1 But we do find that hawkish Fed shocks have net negative effects on EM financial conditions (right-hand panel of Exhibit 10), because exchange rates do not move sufficiently to offset the spillovers into EM domestic financial conditions (and also because the exchange rate has a smaller weight in our EM FCIs).2
1For a more detailed discussion, see Jan Hatzius, Sven Jari Stehn and Matteo Leombroni, “Looking after Number One,” Global Economics Analyst, June 10, 2016.
2See Nicholas Fawcett, “Tighter Fed Policy a Manageable Risk for EM Financial Conditions”, Global Economics Analyst, April 1, 2018. Part of the reason why the FX weight is smaller is the importance of dollar-denominated debt in many EM economies.
14 November 2018 |
7 |
vk.com/id446425943
Goldman Sachs
Global Economics Analyst
Exhibit 10: The Effects of Fed Tightening on Global Financial Conditions
Basis points |
Basis points |
||
200 |
|
|
200 |
|
|
||
|
|
Impact of 100bp Fed Shock on FCI |
|
150 |
DM |
EM |
150 |
|
|
||
100 |
|
|
100 |
50 |
|
|
50 |
0 |
|
|
0 |
-50 |
|
|
-50 |
USA |
Euro |
Japan |
UK |
China |
India |
Brazil Russia Turkey South |
|
area |
|
|
|
|
Africa |
Note: Dark shading denotes statistical significance at the 5% level.
Source: Goldman Sachs Global Investment Research
A hawkish Fed is therefore, in principle, a concern for EM. But again, it is important to keep the numbers in perspective. The estimates in Exhibit 10 suggest that the two additional hikes we see on top of current market pricing would tighten EM financial conditions by 40bp, on average.3 And our FCI impulse analysis suggests that such an FCI tightening might slow growth in EM economies by about 0.3pp. This would be a noticeable, but manageable, drag on EM growth.
One risk to all of this is that the US economy overheats more significantly. If so, Fed officials would likely need to go beyond our current baseline forecast for the funds rate, and might even need to accelerate the pace of rate hikes. If so, the spillovers especially to EM could turn out to be significantly larger as well. This illustrates how important it is for the world that the FOMC achieve a soft landing for the US economy in 2019.
Easing “As Needed” in China
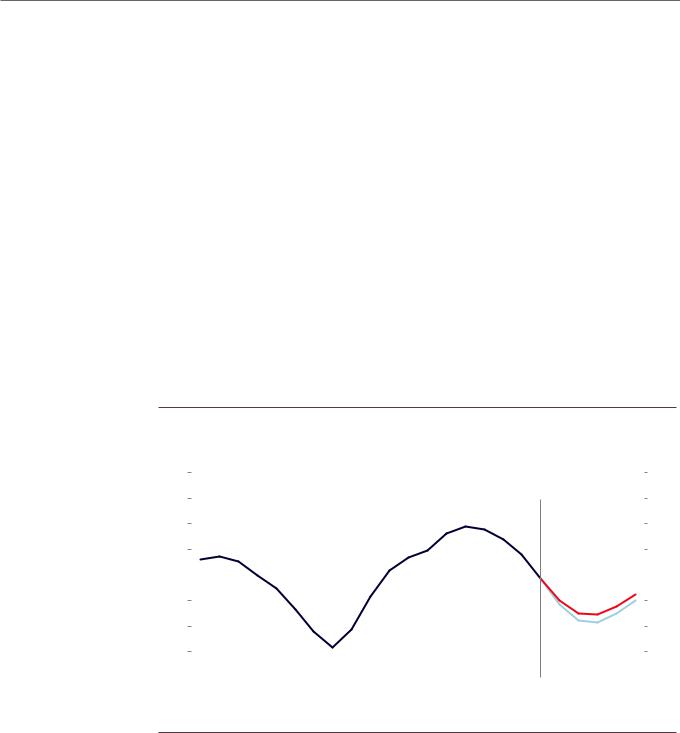
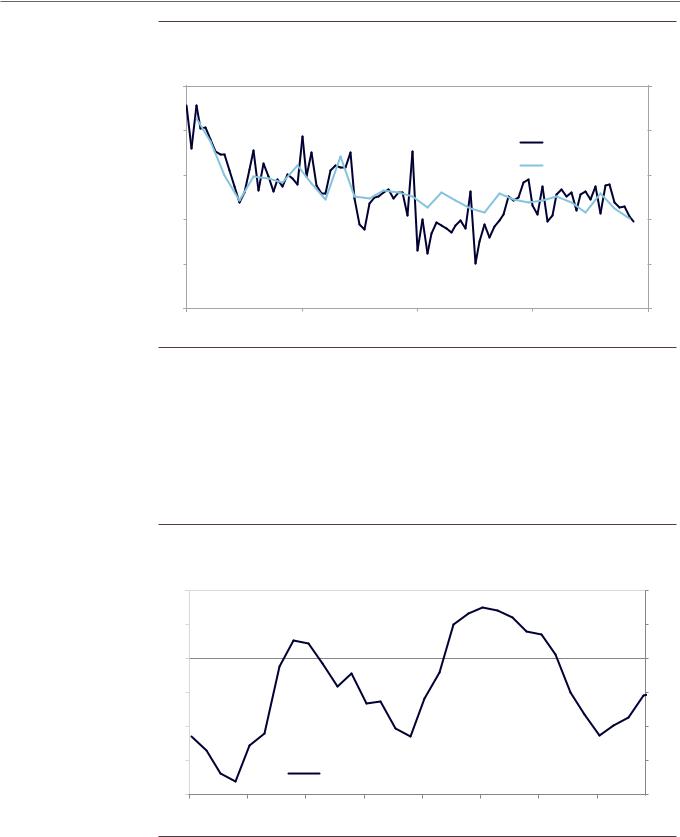
China has slowed significantly in 2018, with our CAI down from 7½% in the first half to around 6% in the fall (Exhibit 11). We see two main drivers of this deceleration. First, credit growth slowed sharply in the early part of the year, which tightened financial conditions and slowed domestic demand growth. Second, fears about a damaging trade war with the US weighed on Chinese sentiment and equity prices, likely exacerbating domestic demand weakness.
3 A 50bp increase in the funds rate typically tightens our US FCI by about 35bp. Exhibit 10 suggests that this would lead to an average EM FCI tightening of 40bp.
14 November 2018 |
8 |
vk.com/id446425943
Goldman Sachs
Global Economics Analyst
Exhibit 11: The Slowdown in China
Percent change, annualized |
|
Percent change, annualized |
||
12 |
|
China Current Activity Indicator and GDP |
|
12 |
|
|
|
|
|
10 |
|
|
|
10 |
|
|
|
|
CAI (mom) |
8 |
|
|
|
Real GDP (qoq) |
|
|
|
8 |
|
6 |
|
|
|
6 |
4 |
|
|
|
4 |
2 |
|
|
|
2 |
2011 |
2013 |
2015 |
2017 |
2019 |
Source: Haver Analytics, Goldman Sachs Global Investment Research
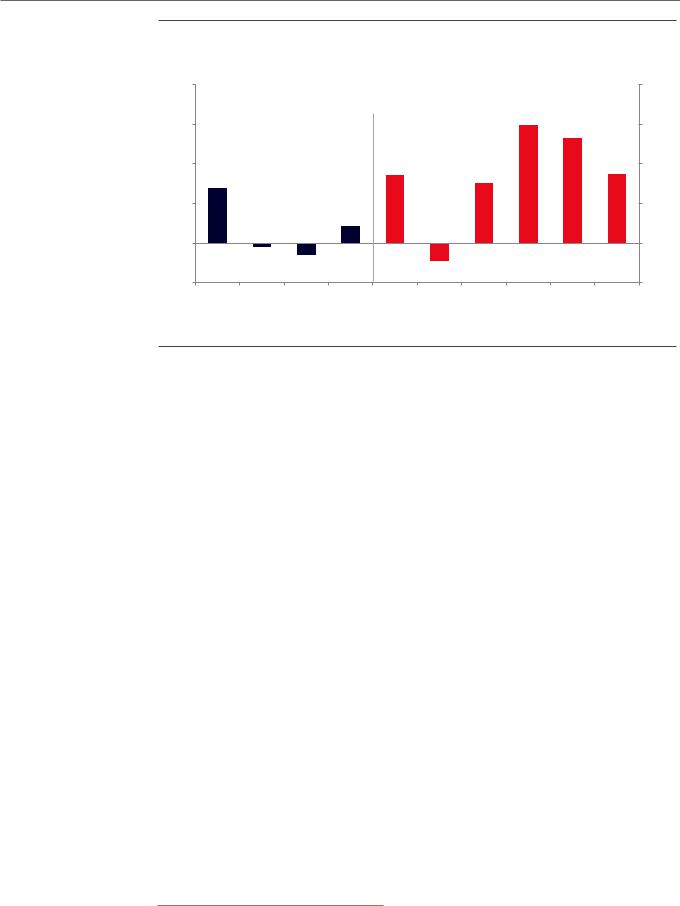
With monetary and fiscal policy now in easing mode, however, we expect only a modest further deceleration in 2019. The PBoC has already lowered short-term interest rates from 3% to 2% this year, the Renminbi has depreciated 6½% against the dollar, credit growth has picked up sequentially, and fiscal policy has turned more expansionary since the summer. The authorities have signaled that policy will be eased further “as needed” and we expect additional fiscal measures in coming months, with corporate tax cuts and increased bond issuance to finance local infrastructure projects.
Exhibit 12: China in Easing Mode
Percent change |
|
|
|
|
|
Percent change |
|
1 |
|
|
|
|
|
|
1 |
|
Aggregate China Credit Impulse to Nominal Activity (4Q Moving Average) |
||||||
0.5 |
|
|
|
|
|
|
0.5 |
0 |
|
|
|
|
|
|
0 |
-0.5 |
|
|
|
|
|
|
-0.5 |
-1 |
|
|
|
|
|
|
-1 |
-1.5 |
|
|
Baseline (assuming new borrowing stays at Q3 pace) |
-1.5 |
|||
|
|
|
|
||||
-2 |
|
|
|
|
|
|
-2 |
2012 |
2013 |
2014 |
2015 |
2016 |
2017 |
2018 |
2019 |
Source: Goldman Sachs Global Investment Research
The US-China trade tensions are likely to rise further from here. So far, President Trump has imposed a 25% tariff on $50bn-worth of imports from China and 10% on another $200bn-worth, in addition to a range of goods-specific duties. We expect him to raise
14 November 2018 |
9 |
vk.com/id446425943
Goldman Sachs
Global Economics Analyst
the tariff rate on the $200bn tranche to 25%, as already scheduled for January, and also view a 10% tariff on the remaining $267bn of imports from China as more likely than not.
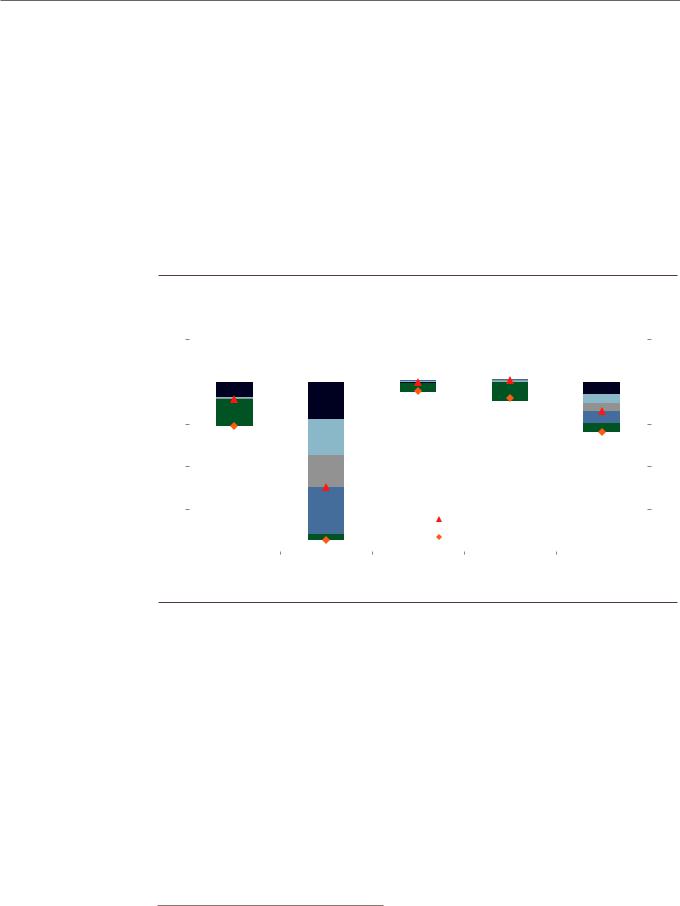
Our analysis suggests that these tariffs should have a moderately negative effect on Chinese growth (Exhibit 13).4 Our simulations point to a real GDP hit of 0.25% under our baseline expectation and 0.4% if President Trump raises the tariff rate on the remaining $267bn to 25%. The latter is not our baseline, but the uncertainty around the extent of the escalation from here and the likelihood of an ultimate trade deal is substantial. An even larger hit is possible, of course, if the US-China tensions morph into a truly global trade war and global financial conditions tighten sharply in response. In our baseline, however, the drag on Chinese growth looks manageable given the remaining room for policy easing.
Exhibit 13: China Is Most Exposed to Higher Tariffs
Percent |
|
|
|
|
Percent |
||||
0.1 |
|
|
|
|
|
|
|
0.1 |
|
|
|
Real GDP Level Effect of Alternative Tariff Scenarios (After Three Years) |
|
||||||
|
|
|
|
|
|
||||
0 |
|
|
|
|
|
|
|
|
0 |
|
|
|
|
|
|
|
|
||
-0.1 |
|
|
|
|
|
Plus autos |
|
-0.1 |
|
|
|
|
|
|
|
||||
|
|
|
|
|
|
|
|
|
|
|
|
|
|
|
|
Plus $267bn at 25% |
|
|
|
|
|
|
|
|
|
|
|
|
|
|
|
|
|
|
|
|
|
|
|
-0.2 |
|
|
|
|
|
Plus $267bn at 10% |
|
-0.2 |
|
|
|
|
|
|
|
||||
|
|
|
|
|
|
||||
|
|
|
|
|
|
Plus $200bn at 25% |
|
|
|
|
|
|
|
|
|
|
|
|
|
|
|
|
|
|
|
|
|
|
|
-0.3 |
|
|
|
|
|
Implemented |
|
-0.3 |
|
|
|
|
|
|
|
||||
|
|
|
|
|
|
||||
|
|
|
|
|
Total: Baseline |
|
|||
|
|
|
|
|
|
|
|
|
|
-0.4 |
|
|
|
|
|
Total: All Threatened |
|
|
-0.4 |
|
|
|
|
|
|
|
|
||
|
|
US |
China |
Euro area |
Japan |
World |
|
||
Source: Goldman Sachs Global Investment Research
Europe: Slower But Not Slow
The latest Euro area growth numbers have been disappointing, including softer-than-expected real GDP growth in Q3 and a further decline in the manufacturing PMIs. The bulk of this weakness, however, appears due to a sharp and temporary contraction in the European auto sector, stemming from a change in environmental rules. Cutting through the noise, we believe that the underlying growth trend in the Euro area has slowed from about 3% at the start of the year to just below 2% now (Exhibit 14).
4 For details, see Sven Jari Stehn and Jan Hatzius, “The Trade War: Bigger Numbers, Same Conclusion,”
Global Economics Analyst, October 5, 2018.
14 November 2018 |
10 |