

GS Landing the Plane_watermark
.pdfvk.com/id446425943
Goldman Sachs
Global Economics Analyst
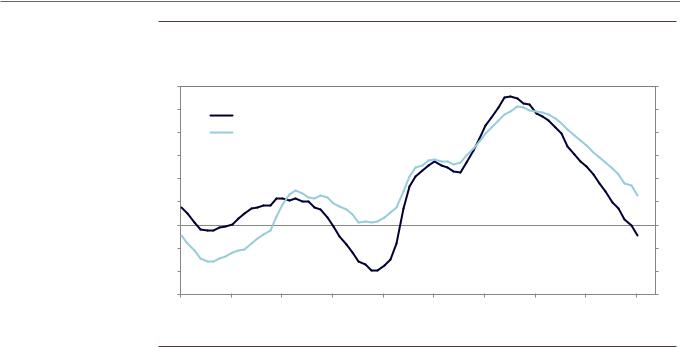
Exhibit 14: European Moderation
Percent change |
|
|
|
|
|
|
|
Percent change |
|
4 |
|
|
|
Euro Area CAI vs GDP |
|
|
4 |
||
|
|
|
|
|
|
|
|||
3 |
|
|
|
|
|
|
|
|
3 |
2 |
|
|
|
|
|
|
|
|
2 |
1 |
|
|
|
|
|
|
|
|
1 |
0 |
|
|
|
|
|
|
|
|
0 |
|
|
|
|
|
|
CAI |
|
|
|
-1 |
|
|
|
|
|
GDP |
|
|
-1 |
|
|
|
|
|
|
RETINA Q4 Tracking Estimate |
|||
-2 |
|
|
|
|
|
Potential Growth |
|
-2 |
|
|
|
|
|
|
|
|
|
||
2010 |
2011 |
2012 |
2013 |
2014 |
2015 |
2016 |
2017 |
2018 |
2019 |
Source: Haver Analytics, Goldman Sachs Global Investment Research
The European economy faces a range of risks in 2019 that could make the outcome worse than we expect. Italy’s budget crisis remains unresolved and we expect the Italian economy to flirt with recession early next year. Although the budget tensions might have to get worse before they get better, we see the economic spillovers from Italy as manageable, unless financial contagion rises sharply from here (Exhibit 15).5 A disorderly Brexit also remains a risk, but parliamentary ratification before March 2019 remains our base case, which would put the UK into a status-quo transition phase after Brexit. And while the threat of US auto tariffs still clouds the European outlook, we expect the US administration to focus trade restrictions on China.
5 See Sven Jari Stehn, Silvia Ardagna and Matteo Crimella, “Global Repercussions of Italy’s Budget Crisis,”
Global Economics Analyst, September 30, 2018.
14 November 2018 |
11 |

vk.com/id446425943
Goldman Sachs
Global Economics Analyst
Exhibit 15: Spillovers from Italy Should Remain Contained
Percent |
|
|
|
|
|
|
Percent |
||||
0.2 |
|
|
|
|
|
|
|
|
|
0.2 |
|
|
|
Real GDP Response to Italian Crisis (100bp BTP Selloff) After Two Years |
|
||||||||
|
|
|
|
|
|
||||||
0 |
|
|
|
|
|
|
|
|
|
|
0 |
|
|
|
|
|
|
|
|
|
|
||
-0.2 |
|
|
|
|
|
|
|
|
|
-0.2 |
|
-0.4 |
|
|
|
|
|
|
|
|
|
-0.4 |
|
-0.6 |
|
|
|
|
|
|
|
Severe Contagion |
|
-0.6 |
|
|
|
|
|
|
|
|
|
|
|
|
|
|
|
|
|
|
|
|
|
|
|
|
|
|
|
|
|
|
|
|
|
|
|
|
|
-0.8 |
|
|
|
|
|
|
|
Mild Contagion |
|
-0.8 |
|
|
|
|
|
|
|
|
|
||||
|
|
|
|
|
|
|
|
||||
-1 |
|
|
|
|
|
|
|
No Contagion |
|
-1 |
|
|
|
|
|
|
|
|
|
||||
|
|
|
|
|
|
|
|
||||
|
|
|
|
|
|
|
Total |
|
|||
-1.2 |
|
|
|
|
|
|
|
|
|
|
-1.2 |
|
|
Italy |
Spain |
US |
Germany |
Japan |
|
France |
UK |
|
|
Source: Goldman Sachs Global Investment Research
While the risks are real, there are still some significant positives in Europe. Household incomes are growing strongly, given solid employment gains and a notable acceleration in wage growth. Credit conditions remain supportive for growth, helped by accommodative ECB policy. And fiscal policy looks poised to turn more expansionary next year, boosting area-wide growth by ¼pp in our estimates. Based on all this, we expect the Euro area to grow 1.6% in 2019, which is still above trend—although that is admittedly a relatively low hurdle given a European potential growth rate of only around 1%.
So far, the above-trend growth of recent years has not done much to boost core inflation, which remains stuck at 1%. A number of factors have likely weighed on inflation, but our estimates suggest that remaining labor market slack plays a key role.6
Although the headline unemployment rate has now fallen to 8.1%, the lowest level since late 2008, a broader “U6” measure remains above the previous cycle highs (Exhibit 16). Remaining slack should continue to weigh on core inflation in the near term. But the combination of falling unemployment and accelerating wage growth suggests that inflation will ultimately rise back towards the ECB’s goal.
6 See Sven Jari Stehn and Jan Hatzius, “Broad Slack and ECB Policy,” Global Economics Analyst, April 22, 2018.
14 November 2018 |
12 |
vk.com/id446425943
Goldman Sachs
Global Economics Analyst
Exhibit 16: Broad Euro Area Slack Remains
Standard deviations |
|
|
|
|
|
|
Standard deviations |
||
6 |
|
|
Unemployment in the Euro Area |
|
|
6 |
|||
|
|
|
|
|
|
||||
5 |
U3 |
|
(Deviation from 2000-2008 Average) |
|
|
5 |
|||
|
|
|
|
|
|
|
|
|
|
4 |
U6 |
|
|
|
|
|
|
|
4 |
3 |
|
|
|
|
|
|
|
|
3 |
2 |
|
|
|
|
|
|
|
|
2 |
1 |
|
|
|
|
|
|
|
|
1 |
0 |
|
|
|
|
|
|
|
|
0 |
-1 |
|
|
|
|
|
|
|
|
-1 |
-2 |
|
|
|
|
|
|
|
|
-2 |
-3 |
|
|
|
|
|
|
|
|
-3 |
2000 |
2002 |
2004 |
2006 |
2008 |
2010 |
2012 |
2014 |
2016 |
2018 |
Note: We calculate mean and standard deviation using pre-crisis data.
Source: Haver Analytics, Goldman Sachs Global Investment Research
ECB officials have therefore sent a steady message in recent weeks, indicating that risks to the outlook are still broadly balanced and policy normalization remains on track. Net asset purchases are on course to wind down at the end of the year but reinvestments of maturing assets are likely to continue for the foreseeable future. Our baseline forecast remains for the first hike in the deposit rate in late 2019, but the risks are skewed towards a later lift-off.
VAT Hike Keeps BoJ on Hold
Growth in Japan has generally held up well this year. Real GDP contracted in Q3, but this likely reflects a negative impact from a number of natural disasters and we expect growth to rebound in the current quarter. The continued improvement in the labor market—with further declines in the unemployment rate and increases in the 15-64 employment/population ratio—also shows that the economy has grown at a clearly above-trend pace. Consistent with this, Japanese wage growth has been on an accelerating trend.
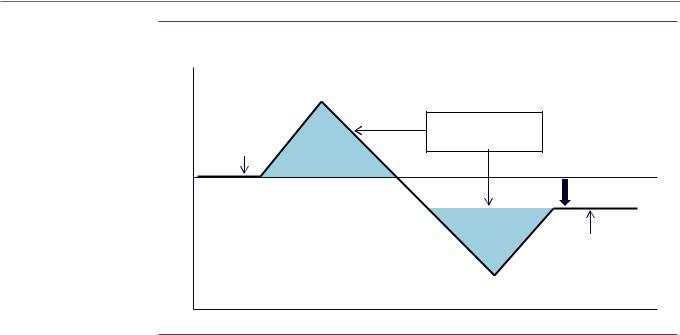
However, next year will be a challenging one for Japanese growth, mainly because we expect the planned October VAT hike to weigh sharply on growth in 2019Q4. The government will likely try to cushion the impact by recycling some of the additional revenue via spending hikes, but we nevertheless expect a drop in GDP, with a pattern exacerbated by expenditure shifting in surrounding quarters. Exhibit 17 from our Japan economics team shows the likely effects in schematic form.
14 November 2018 |
13 |
vk.com/id446425943
Goldman Sachs
Global Economics Analyst
Exhibit 17: The VAT Hike Will Weigh on Japanese Growth in Late 2019
Consumption (level) |
|
Conceptual Diagram of Consumption Tax Hike Impacts |
|
|
|
||
Consumption Trend |
Intertemporal |
||
Substitution Effect |
|||
(Pre-tax Hike) |
|
||
|
Front-loading Demand |
||
|
|
Negative Income |
|
|
|
Effect |
|
|
|
Demand Fall-off |
|
|
|
Consumption Trend |
|
|
|
(Post-tax Hike) |
|
Consumption Tax Hike |
Time |
Source: NLI Research Institute, Cabinet Office
The consumption tax hike has important implications for monetary policy. With underlying measures of inflation still far below the Bank of Japan’s 2% target—the CPI excluding fresh food and energy is up just 0.4% over the past year—we think the BoJ will want to minimize the chance of a fresh relapse. To be sure, policymakers have increasingly discussed the potential financial vulnerabilities stemming from the easy policy stance. But we don’t think officials see these adverse effects as strong enough to trigger hikes any time soon and we continue to see the BoJ on hold past the tax hike.
How Far Is Too Far?
Our baseline forecast beyond 2019 is continued global growth close to the estimated 3½% potential rate, with below-trend numbers in economies that have already moved beyond full employment (such as the US) and above-trend numbers in countries that are still climbing out of the hole (such as Southern Europe and much of EM outside of China). That is, we are not forecasting a global recession, either in 2019 or beyond. But what are the risks to this view?
For 2019, the risk of recession looks low. Growth momentum remains fairly strong, financial conditions are broadly accommodative, debt growth remains subdued (with China a partial exception), inflation is moderate, and output has not yet meaningfully surpassed its potential. Consequently, our statistical model in Exhibit 18 shows recession risk over the next year far below the unconditional historical average.
14 November 2018 |
14 |

vk.com/id446425943
Goldman Sachs
Global Economics Analyst
Exhibit 18: Recession Risk Remains Low (For Now)
Source: Goldman Sachs Global Investment Research
The longer-term versions of the model—which depend less on near-term momentum and more on the level of asset prices and the output gap—show the risk increasing to levels close to the historical average three years ahead. Recession in the out years is therefore a meaningful risk, especially in places where output has already moved beyond potential. This means the unemployment rate—especially in countries where it has already fallen quite far, such as the United States—must stabilize before too long to limit the risk of recession further down the road. So the plane needs to land, and it needs to land soon.
Jan Hatzius
Sven Jari Stehn
See all our year-ahead forecasts in one place. Visit the page.
14 November 2018 |
15 |

vk.com/id446425943
Goldman Sachs
Global Economic Forecasts
Global Economics Analyst
|
|
Real GDP Growth (YoY) |
2017 |
2018 |
2019 |
2020 |
|
Core CPI Inflation (YoY) |
2017 |
2018 |
2019 |
2020 |
|
|
|
|
|
|
|
|
|
||||||||
|
|
World |
3.8 |
3.8 |
3.5 |
3.6 |
|
G3 |
|
|
|
|
|
|
|
|
Advanced Economies |
2.4 |
2.4 |
2.1 |
1.7 |
|
United States (core PCE) |
1.6 |
1.9 |
2.2 |
2.2 |
|
|
|
|
Emerging Markets |
5.1 |
5.1 |
4.7 |
5.3 |
|
Euro area |
1.0 |
1.0 |
0.9 |
1.2 |
|
|
|
|
G3 |
|
|
|
|
|
Germany |
1.3 |
1.2 |
1.3 |
1.4 |
|
|
|
|
United States |
2.2 |
2.9 |
2.5 |
1.6 |
|
France |
0.6 |
0.9 |
0.5 |
0.6 |
|
|
|
|
Euro area |
2.5 |
1.9 |
1.6 |
1.6 |
|
Italy |
0.8 |
0.7 |
0.8 |
1.3 |
|
|
|
|
Germany |
2.5 |
1.7 |
1.9 |
1.6 |
|
Spain |
1.2 |
1.1 |
1.1 |
1.4 |
|
|
|
|
France |
2.3 |
1.6 |
1.7 |
1.6 |
|
Japan (ex food & energy) |
0.1 |
0.4 |
0.8 |
1.5 |
|
|
|
|
Italy |
1.6 |
1.0 |
0.4 |
1.1 |
|
Advanced Economies |
|
|
|
|
|
|
|
|
Spain |
3.0 |
2.5 |
2.3 |
2.1 |
|
Norway |
1.4 |
1.5 |
2.1 |
2.1 |
|
|
|
|
Japan |
1.7 |
0.9 |
1.0 |
0.6 |
|
United Kingdom |
2.4 |
2.1 |
2.0 |
2.0 |
|
|
|
|
Advanced Economies |
|
|
|
|
|
|
|
|
|
|
|
|
|
|
Australia |
2.2 |
3.4 |
3.1 |
2.9 |
|
|
|
|
|
|
|
|
|
|
Canada |
3.1 |
2.1 |
2.3 |
1.9 |
|
|
|
|
|
|
|
|
|
|
New Zealand |
2.8 |
2.8 |
3.1 |
3.0 |
|
Policy Rate (%) |
2017 |
2018 |
2019 |
2020 |
|
|
|
|
Norway |
2.4 |
1.7 |
2.2 |
2.2 |
|
|
|
|||||
|
|
|
|
|
|
|||||||||
|
|
Sweden |
2.4 |
2.5 |
2.3 |
2.2 |
|
G3 |
|
|
|
|
|
|
|
|
Switzerland |
1.7 |
2.8 |
1.3 |
1.6 |
|
United States |
1.3 |
2.4 |
3.4 |
3.4 |
|
|
|
|
United Kingdom |
1.7 |
1.3 |
1.5 |
1.4 |
|
Euro area |
0.0 |
0.0 |
0.0 |
0.5 |
|
|
|
|
Asia |
|
|
|
|
|
Japan |
-0.1 |
-0.1 |
-0.1 |
-0.1 |
|
|
|
|
China |
6.9 |
6.6 |
6.2 |
6.1 |
|
Advanced Economies |
|
|
|
|
|
|
|
|
India |
6.3 |
7.5 |
7.3 |
7.9 |
|
Australia |
1.5 |
1.5 |
1.8 |
2.3 |
|
|
|
|
CEEMEA |
|
|
|
|
|
Canada |
1.0 |
1.8 |
2.8 |
3.3 |
|
|
|
|
Russia |
1.5 |
1.7 |
1.8 |
2.8 |
|
New Zealand |
1.8 |
1.8 |
2.0 |
2.5 |
|
|
|
|
|
|
|
||||||||||
|
|
Turkey |
7.4 |
3.0 |
-1.5 |
3.6 |
|
Norway |
0.5 |
0.8 |
1.5 |
2.3 |
|
|
|
|
Latin America |
|
|
|
|
|
Sweden |
-0.5 |
-0.3 |
0.3 |
1.0 |
|
|
|
|
Brazil |
1.0 |
1.2 |
2.6 |
3.0 |
|
Switzerland |
-0.8 |
-0.8 |
-0.8 |
-0.3 |
|
|
|
|
|
|
|
||||||||||
|
|
Mexico |
2.0 |
2.2 |
1.9 |
1.7 |
|
United Kingdom |
0.5 |
0.8 |
1.0 |
1.3 |
|
|
|
|
|
|
|
|
|
|
Asia |
|
|
|
|
|
|
|
|
|
|
|
|
|
|
China |
3.1 |
2.5 |
2.5 |
2.5 |
|
|
|
|
|
|
|
|
|
|
India |
6.0 |
6.5 |
7.3 |
7.3 |
|
|
|
|
|
|
|
|
|
|
CEEMEA |
|
|
|
|
|
|
|
|
|
|
|
|
|
|
Russia |
7.8 |
7.5 |
7.0 |
6.0 |
|
|
|
|
|
|
|
|
|
|
Turkey |
8.0 |
24.0 |
18.0 |
13.0 |
|
|
|
|
|
|
|
|
|
|
Latin America |
|
|
|
|
|
|
|
|
|
|
|
|
|
|
Brazil |
7.0 |
6.5 |
8.0 |
9.0 |
|
|
|
|
|
|
|
|
|
|
Mexico |
7.3 |
8.0 |
8.0 |
6.8 |
|
|
|
|
|
|
|
|
|
|
|
|
|
|
|
|
|
|
|
|
|
|
|
|
|
|
|
|
|
|
|
|
Source: Goldman Sachs Global Investment Research
14 November 2018 |
16 |