

Gazprom_investor_day_2019_presentation_watermark
.pdfvk.com/id446425943
GAZPROM’S EXPORT ROUTES
CAPACITY UTILIZATION OF MAIN ROUTES FOR GAS SUPPLIES TO EUROPE IN 20181
|
|
Gazprom transport |
Other |
|
|
120% |
|
routes |
|
suppliers |
|
|
|
107% |
|
|
|
|
|
|
|
|
|
100% |
|
|
92% |
|
|
|
|
83% |
|
84% |
|
80% |
|
|
|
|
|
|
|
|
65% |
|
|
60% |
|
|
|
|
|
|
|
|
|
41% |
|
40% |
|
30% |
|
|
31% |
|
|
|
25% |
||
|
|
|
|
|
|
20% |
|
|
|
|
|
0% |
|
|
|
|
|
|
Finland Blue Stream |
via Belarus Nord Stream via Ukraine2 |
from Lybia3 from Algeria3 from Norway3 |
LNG 3 |
|
|
|
||||
1Deliveries under the contracts of Gazprom Export LLC
2Capacity remains unclear due to lack of accurate data on current state of the Ukrainian pipeline system
3Pipeline exports
4Including LNG trading between European countries and capacity of FSRUs
21 Source: ENTSOG, Bloomberg, IHS Markit
Gazprom transport routes demonstrated high level of capacity utilization in 2018
Utilization rate of the competing routes was at the same level or even declined
Utilization rate of LNG terminals in Europe increased from 29% in 2017 to 31% in 2018 as a result of increased LNG deliveries
EXPORT
vk.com/id446425943
GROWTH VECTOR: CHINA IS NOW WORLD’S TOP NATURAL GAS IMPORTER
GAS DEMAND IN CHINA, |
|
CHINA REMAINS THE KEY DRIVER OF |
|
GAS SUPPLY IN CHINA, |
BCM |
|
NATURAL GAS DEMAND GROWTH IN ASIA: |
|
BCM |
|
|
|
|
|
|
|
|
|
|
450
400
350
300
250
200
150
100
50
0
22
440 
277
237
206
193
179
Gas demand: +17% YOY1
LNG imports: +40% YOY
Pipeline gas imports: +21% YOY
Total gas imports: +32% YOY
Gas production: +7% YOY
In 2018 Chinese gas import growth continued and China became the largest net importer of natural gas in the world (overtaking Japan).
450 |
|
|
440 |
|
|
|
|
400 |
|
|
~9% (38 bcm) |
350 |
|
|
Gazprom |
|
|
pipeline gas |
|
|
|
277 |
|
300 |
|
supplies share |
|
237 |
|
||
250 |
74 |
by 2025 |
|
|
Chinese |
||
|
53 |
||
200 |
|
demand |
|
|
51 |
||
|
42 |
|
|
150 |
|
|
|
|
|
|
|
100 |
|
157 |
|
50 |
147 |
|
|
|
|
|
|
0 |
|
|
|
-50 |
|
|
|
|
2017 |
2018E |
2025F |
2014 |
2015 |
2016 |
2017 |
2018E |
2025F |
|
|
indigenous production |
|
|
|||||||||
|
|
|
|||||||
|
|
|
|
|
|
|
|
|
LNG imports |
|
|
|
|
|
|
|
|
|
|
1 |
Numbers below reflect 2018 growth as compared to 2017 |
|
|
pipeline gas exports2 |
|||||
|
|
||||||||
|
|
||||||||
|
|
|
|||||||
2 |
Pipeline gas exports from mainland China to Hong Kong and Macau |
|
|
|
|||||
*The difference between gas consumption and total gas supply is due to gas in transit, volumes in storage, losses and statistical discrepancies Source: IEA; General Administration of Customs, National Bureau of Statistics, National Development and Reform Commission, National
Energy Administration, People’s Republic of China; CNPC Research Institute of Economics and Technology
pipeline gas imports
(incl. from Russia via Eastern Route in 2025F)
EXPORT
vk.com/id446425943
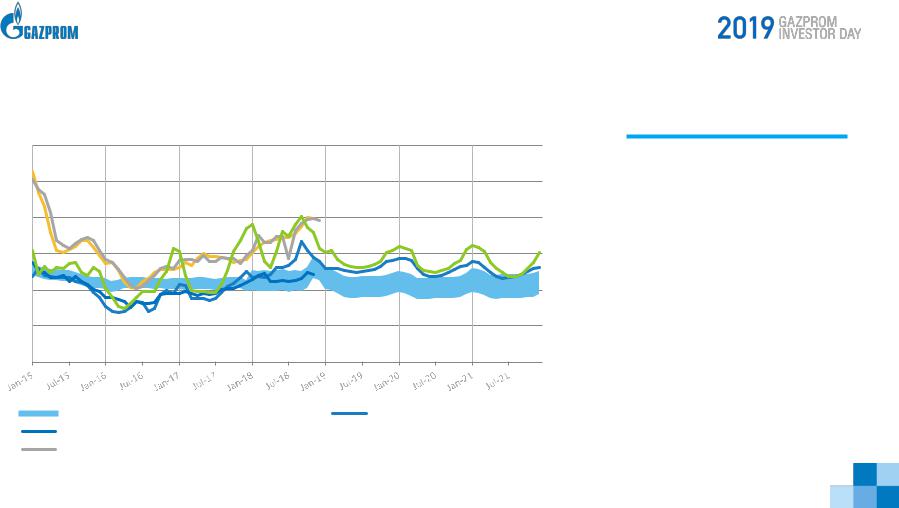
EUROPEAN MARKET IS NOT THE FIRST OPTION FOR US LNG
ECONOMICS OF LNG SUPPLIES FROM USA
|
600 |
|
USD/mcm |
500 |
|
400 |
||
|
300
200
100
0
1 |
|
TTF, Month Ahead and Futures |
US LNG breakeven prices (full cycle costs)* |
|
|
Germany border price (BAFA) |
|
Japanese LNG Import Price |
|
||
S. Korean LNG Import Price |
|
Asian spot prices (actual and forecast) |
|
17.1 |
|
|
14.2 |
USD/mmbtu |
|
11.4 |
||
|
8.5
5.7
2.8
0.0
Hub prices significantly increased above both short-run marginal and full cycle costs of US LNG making its deliveries to Europe economically viable
However, European market is not a first choice for LNG from the USA due to higher attractiveness of other markets
1 Calculated on the basis of Henry Hub Futures prices, P = HH * 115% + X, where X – costs of liquefaction, shipping to Europe, regasification
Source: IMF, Korea Customs Service, Bloomberg, IHS Markit
23 |
|
EXPORT |
|
vk.com/id446425943
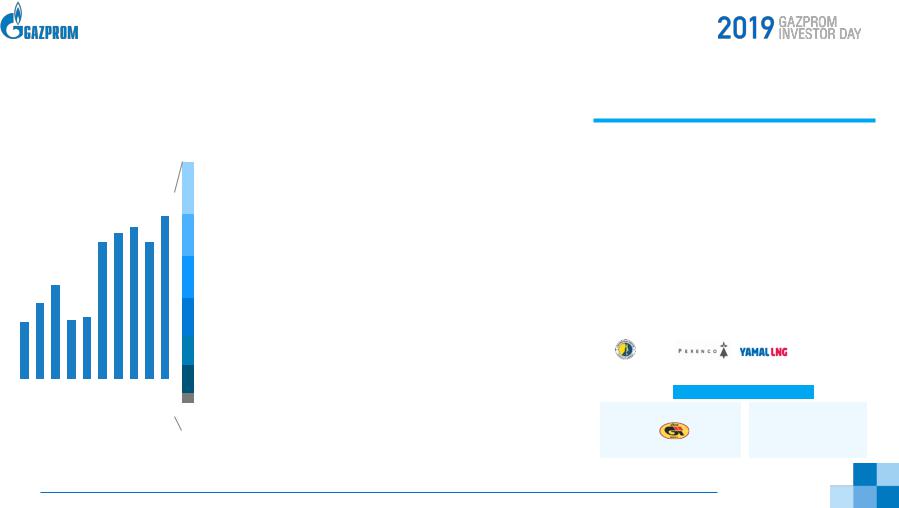
GAZPROM’S LNG BUSINESS
GAZPROM PORTFOLIO LNG SUPPLIES |
GAZPROM LNG PROJECTS |
|
|
|
|
|
|
|
mmt
5 |
|
|
|
|
|
|
|
|
|
|
|
|
|
|
|
|
|
|
|
|
|
|
|
|
|
|
|
|
|
|
|
|
|
|
|
|
|
|
|
|
|
|
|
|
|
|
|
|
4.0 |
|
|
4 |
|
|
|
|
|
3.4 |
3.6 3.7 |
3.3 |
|
|
|
|
|
|
|
|
|
|
|
|
|
|
|
||
3 |
|
|
|
|
|
|
|
|
|
|
|
|
|
|
|
2.3 |
|
|
|
|
|
|
|
|
|
2 |
|
1.9 |
|
|
|
|
|
|
|
|
|
|
|
|
|
1.4 1.5 |
|
|
|
|
|
|
|
||
|
1.4 |
|
|
|
|
|
|
|
|
|
||
1 |
|
|
|
|
|
|
|
|
|
|
|
|
|
|
|
|
|
|
|
|
|
|
|
|
|
2009 |
2010 |
2011 |
2012 |
2013 |
2014 |
2015 |
2016 |
2017 |
2018 |
|
|
|
|
|
|
|
|
|
|
|
|
|
|
|
|
|
|
|
|
|
|
|
|
|
|
|
|
|
INDIA - 19%
JAPAN - 16%
CHINA - 15%
KOREA - 14%
KUWAIT - 11%
TAIWAN - 10%
other DES sales - 4%
FOB sales – 11%
OPERATIONAL |
SAKHALIN 2 (T1,2) – 9.6 mmt/year1 |
||
• |
11.4 mmt of LNG produced in 2018. |
||
|
|||
|
• In 2018 Gazprom took delivery of |
||
|
|
1.5 mmt of LNG from Sakhalin which was sold to |
|
|
|
customers in Asia Pacific. 2 |
|
|
|
||
CONSTRUCTION |
PORTOVAYA LNG – 1.5 mmt/year |
||
• |
Mid-sized LNG Plant currently being constructed |
||
|
|||
|
|
in the vicinity of Portovaya Compressor Station; |
|
|
• |
Expected to start up in H2 of 2019; |
|
|
• |
Oriented towards both small and large scale LNG |
|
|
|
demand in the region. |
|
|
|
||
|
|
||
|
SAKHALIN 2 T3 – up to 5.4 mmt/year |
||
PROSPECTIVE |
• In 2015, Gazprom signed MOU with Shell on |
||
|
project implementation. |
||
|
|
||
|
• |
The project’s FEED was finalized in 2018. |
|
|
BALTIC LNG – 10 mmt/year |
||
|
• In 2017, Gazprom signed JVA Key terms with Shell |
||
|
|
for Joint Venture. |
|
|
• |
Concept select study is under development |
|
|
1 |
Nominal capacity. Gazprom holds 50%+1 share in SEIC (project operator company); |
24 |
2 |
Under SPAs and spot purchases. Calculated as per PJSC Gazprom reporting methodology |
|
|
GAZPROM IS COMMITTED TO BUILDING A DIVERSIFIED LNG TRADING PORTFOLIO TO CONTINUE RELIABLE AND TIMELY DELIVERIES OF LNG TO ITS CUSTOMERS
IN 2018:
•Gazprom Group delivered 57 cargoes to customers in 8_countries throughout the world;
•Gazprom Group started deliveries to India under LT contract with GAIL. India became the biggest importer of LNG sourced from Gazprom’s portfolio.
•Gazprom Group started offtake under LT contracts from Yamal LNG and Cameroon FLNG.
GAZPROM LNG PORTFOLIO OVERVIEW
LT LNG Purchase Agreements |
|
other |
SEIC |
|
MT/ST/ |
|
spot |
|
|
|
|
1.0 mmtpa/20y 1.2 mmtpa/8y 2.9 mmtpa/20y |
|
purchases |
|
|
|
LT LNG Sale Agreements
other MT/ST/spot sales
2.9 mmtpa/20y
EXPORT
vk.com/id446425943
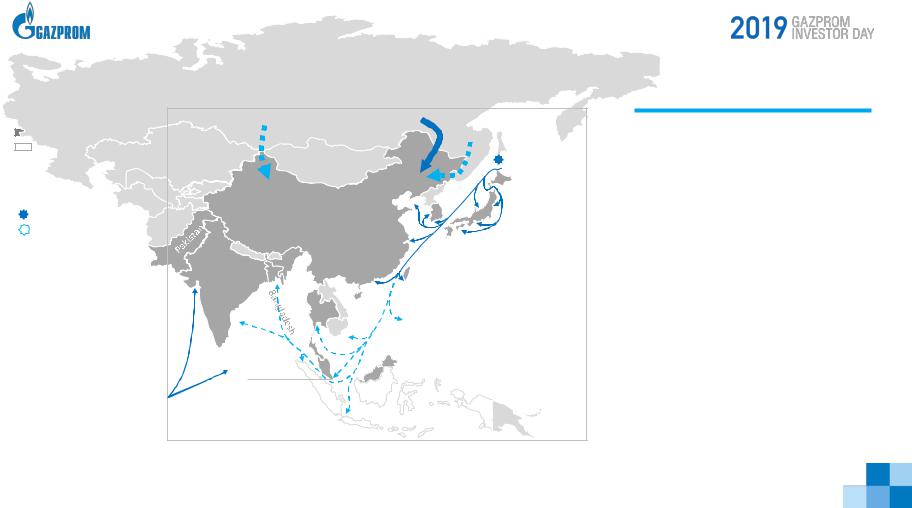
GAZPROM’S NATURAL GAS BUSINESS IN ASIA PACIFIC
GAZPROM’S LNG ASSETS
- EXISTING - POTENTIAL
GAZPROM’S LNG
SUPPLY ROUTES
 - EXISTING
  - POTENTIAL
GAZPROM’S PIPELINE
NATURAL GAS SUPPLY ROUTES
 - UNDER CONSTRUCTION
  - POTENTIAL
Western Route |
Eastern Route |
Far Eastern |
|
|
|
|
|
Route |
Sakhalin 2
 Sakhalin 2
Train 3
South
Korea
|
China |
|
Japan |
India |
Taiwan |
|
Philippines |
Thailand
Malaysia
Singapore
other supplies sourced from Gazprom Group’s
LNG Portfolio
continues to expand its natural business in Asia Pacific by developing projects for both LNG and pipeline deliveries.
On December 1, 2019 Gazprom will commence pipeline natural gas supplies to China via the Eastern Route pipeline (Power of Siberia) under the Sales and Purchase Agreement signed with CNPC in 2014.
Annual supply volumes via Eastern Route will ramp-up year by year and will reach level of 38 bcm per year by 2025.
Gazprom also continues working on other projects for increasing supply of Russian gas to China.
25 |
|
EXPORT |
|

vk.com/id446425943
COMPETITIVE ADVANTAGES
RELIABLE SUPPLIER |
|
GEOGRAPHICAL |
|
COMPETITIVE |
|
NEW APPLICATIONS |
|
|
|
FOR NATURAL GAS |
|||
|
|
DIVERSIFICATION |
|
PRICES |
|
|
|
|
|
|
|
||
|
|
|
|
|
|
|
26 |
|
EXPORT |
|

vk.com/id446425943
OIL BUSINESS
MR. ALEXEY YANKEVICH
Member of the
Management Board and
CFO, Gazprom Neft

vk.com/id446425943
DISCLAIMER
THIS PRESENTATION CONTAINS FORWARD-LOOKING STATEMENTS CONCERNING THE FINANCIAL CONDITION, RESULTS OF OPERATIONS AND BUSINESSES OF GAZPROM NEFT AND ITS CONSOLIDATED SUBSIDIARIES
All statements other than statements of historical fact are, or may be deemed to be, forward-looking statements. Forward-looking statements are statements of future expectations that are based on management’s current expectations and assumptions and involve known and unknown risks and uncertainties that could cause actual results, performance or events to differ materially from those expressed or implied in these statements.
Forward-looking statements include, among other things, statements concerning the potential exposure of Gazprom Neft to market risks and statements expressing management’s expectations, beliefs, estimates, forecasts, projections and assumptions. These forward-looking statements are identified by their use of terms and phrases such as ‘‘anticipate’’, ‘‘believe’’, ‘‘could’’, ‘‘estimate’’, ‘‘expect’’, ‘‘intend’’, ‘‘may’’, ‘‘plan’’, ‘‘objectives’’, ‘‘outlook’’, ‘‘probably’’, ‘‘project’’, ‘‘will’’, ‘‘seek’’, ‘‘target’’, ‘‘risks’’, ‘‘goals’’, ‘‘should’’ and similar terms and phrases.
There are a number of factors that could affect the future operations of Gazprom Neft and could cause those results to differ materially from those expressed in the forward-looking statements included in this presentation,inclusively (without limitation):
(a)price fluctuations in crude oil and oil products;
(b)changes in demand for the Company’s products;
(c)currency fluctuations;
(d)drilling and production results;
(e)reserve estimates;
(f)loss of market and industry competition;
(g)environmental and physical risks;
(h)risks associated with the identification
of suitable potential acquisition properties and targets, and successful negotiation and completion of such transactions;
(i)economic and financial market conditions in various countries and regions;
(j)political risks, project delay or advancement, approvals and cost estimates; and
(k)changes in trading conditions.
All forward-looking statements contained in this presentation are expressly qualified in their entirety by the cautionary statements contained or referred to in this section. Readers should not place undue reliance on these forward-looking statements.
Each forward-looking statement speaks only as of the date of this presentation. Neither Gazprom Neft nor any of its subsidiaries undertake any obligation to publicly update or revise any forward-looking statement as a result of new information, future events or other information.
28 |
|
OIL |
|
vk.com/id446425943
BEST IN CLASS AND FULLY INTEGRATED OIL MAJOR AFTER 10 YEARS OF DEVELOPMENT
2005
A REGIONAL COMPANY
672 filling stations
6.6 tpd average filling-station throughput
1 airport presence
0 sea port presence
29
2018
NATIONWIDE PLAYER
NO.3
in hydrocarbon production and refining1
LEADER
in the Russian Arctic
1,801
filling stations
20.7 tpd
filling-station throughput (No.1)1
1 in Russia
Present at |
LEADING in the domestic |
|
260 airports |
||
bitumen market |
||
37 ports |
Oil exports to |
|
|
78 countries |
|
|
OIL |

vk.com/id446425943
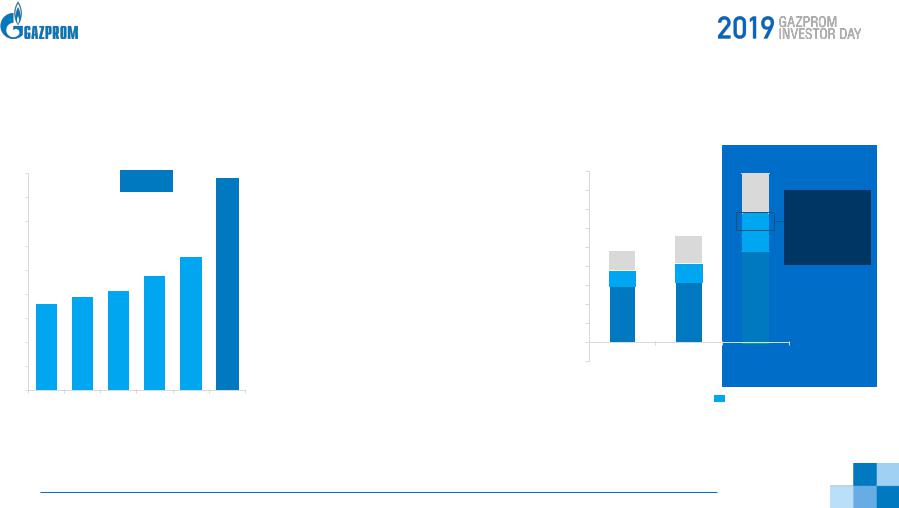
CONSISTENTLY DELIVERING STRONG RESULTS
HYDROCARBON PRODUCTION, MTOE |
|
|
|
|
ADJ. EBITDA, US$ BN |
|
|
|
||||||||
|
|
|
|
|
|
|
|
|
|
|
|
|
|
|
|
|
|
|
|
|
|
|
|
|
|
|
|
|
|
|
|
|
|
|
|
|
|
|
89.8 |
92.9 |
|
|
|
|
|
|
|
|
12.7 |
|
|
|
|
|
|
|
|
|
|
|
|
|
|
|
9.4 |
|
|
46.8 |
|
|
|
|
5.4 |
|
|
|
|
|||||||
|
|
|
|
|
|
|
|
|
|
|
|
|||||
|
|
|
|
|
|
|
|
|
|
|
||||||
|
|
|
|
|
|
|
|
|
|
|
|
|
|
|
|
|
|
|
|
|
|
|
|
|
|
|
|
|
|
|
|
|
|
2005 |
|
2017 |
2018 |
|
2005 |
|
2017 |
2018 |
|
|||||||
REFINING THROUGHPUT, MT |
|
|
|
|
|
NET INCOME, US$ BN |
|
|
|
|||||||
|
|
|
|
|
|
|
|
|
|
|
|
|
|
|
|
|
|
|
|
|
|
40.1 |
42.9 |
|
|
|
|
|
|
|
|
6.0 |
|
|
|
|
|
|
|
|
|
|
|
|
|
|
4.3 |
|
|
|
|
|
|
|
|
|
|
|
|
|
|
|
|
|
|
|
|
17.6 |
|
|
|
|
2.8 |
|
|
|
|
|||||||
|
|
|
|
|
|
|
|
|
|
|
|
|
|
|
||
|
|
|
|
|
|
|
|
|
|
|
|
|
|
|
|
|
2005 |
|
2017 |
2018 |
|
2005 |
|
2017 |
2018 |
|
|||||||
30 |
|
OIL |
|