

ExxonMobil - Outlook for Energy 2019_watermark
.pdfvk.com/id446425943 |
P.21 |
2019 OUTLOOK FOR ENERGY | DEMAND |
|
|
|
INDUSTRIAL — PROJECTIONS
Industrial sector energy supports economic progress
World – quadrillion BTUs |
|
|
|
|
300 |
Growth '17-'40 |
|
|
|
|
|
|
|
Chemicals |
200 |
|
|
|
|
|
|
|
|
Heavy industry |
100 |
|
|
|
|
|
|
|
|
Agriculture |
|
|
|
|
Asphalt/Lubes/Specialties |
|
|
|
|
Energy industry |
0 |
|
|
|
|
2000 |
2010 |
2020 |
2030 |
2040 |
Oil, gas and electricity fuel industrial growth
World – quadrillion BTUs
70 |
|
|
|
|
|
60 |
|
|
|
|
|
|
|
Chemical |
|
|
|
50 |
|
feedstock |
|
|
|
|
|
|
|
|
|
40 |
|
|
|
|
|
|
|
Asphalt/ |
|
|
|
30 |
|
Lubes/ |
|
|
|
|
Specialties |
|
|
|
|
|
|
|
|
|
|
20 |
|
|
|
|
|
|
|
Industrial |
|
|
|
10 |
|
fuel |
|
|
|
|
|
|
|
|
|
‘00 |
'17 |
'40 |
|
|
|
0 |
|
|
|
|
Other |
|
Oil |
Natural |
Electricity/ |
Coal |
|
|
gas |
Mkt heat |
|
|
|
|
|
|
|
•The industrial sector provides more than a billion jobs for people who work to feed, clothe, shelter and improve the lives of people around the world
•Rising population and prosperity trigger demand for modern cities, medical equipment, mobility and home appliances that underpin the need for steel, cement and chemicals
•In 2017, the industrial sector used about half the world’s electricity and nearly as much primary energy as the transportation and residential/commercial sectors combined
•Increased options for consumers to ‘reduce, reuse, recycle’ and manufacturers’ efforts to improve industrial processes and efficiency can conserve fuel and mitigate emissions
•Heavy industry (steel, cement, metals and manufacturing) and chemicals (plastics, fertilizer and other chemical products) are expected to account for 85 percent of growth to 2040
•Industry uses energy products both as a fuel and as a feedstock for chemicals, asphalt lubricants, waxes and other specialty products
•Oil, natural gas and electricity each contribute about one-third of industrial energy growth to 2040
•Oil grows because it is particularly well-suited as a feedstock; companies choose natural gas and electricity for their versatility, convenience and lower direct emissions
•Coal is expected to continue to play a role in steel and cement manufacturing but its use declines as nations and businesses strive to reduce their environmental impact
•Shifting to lower-carbon fuels holds the industrial sector’s 2040 direct emissions at about the same level as 2017 even as energy demand increases by around 15 percent
Visit exxonmobil.com/energyoutlook |
Subscribe to energyfactor.com |
Follow @exxonmobil |
Follow facebook.com/exxonmobil |
vk.com/id446425943 |
P.22 |
2019 OUTLOOK FOR ENERGY | DEMAND |
|
|
|
INDUSTRIAL — HEAVY INDUSTRY PROJECTIONS
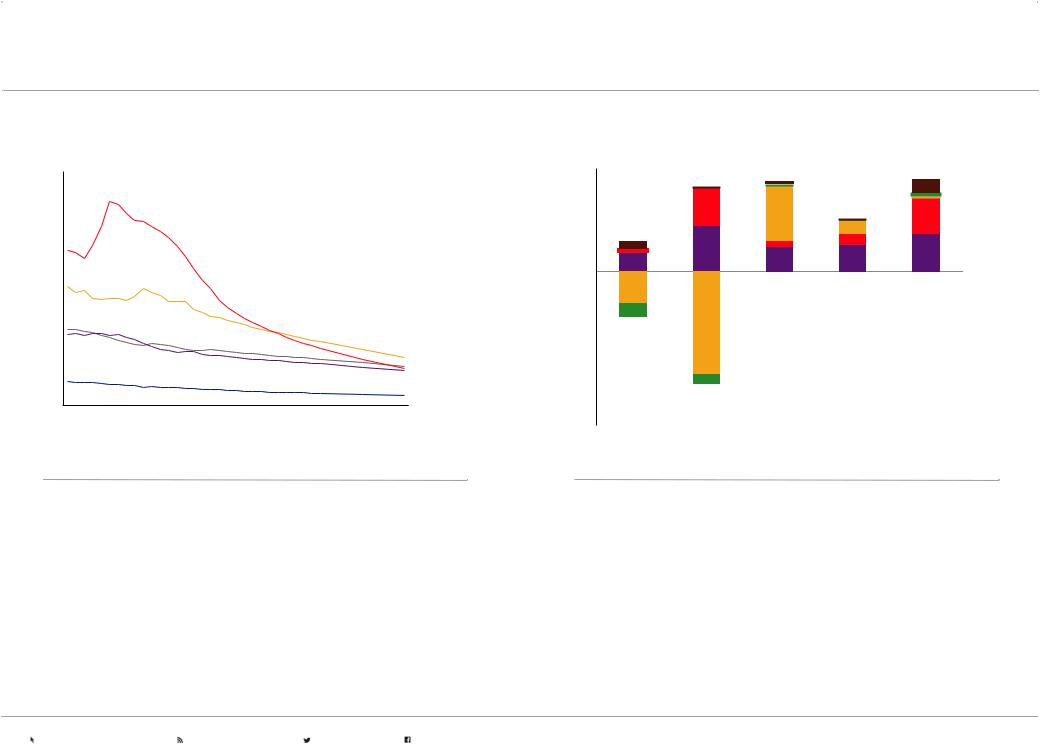
Heavy industry energy intensity improves
Thousand BTUs per dollar of GDP |
|
|
|
||
8 |
|
|
|
|
|
7 |
|
China |
|
|
|
|
|
|
|
|
|
6 |
|
|
|
|
|
5 |
|
|
|
|
|
4 |
India |
|
|
|
|
3 |
Rest of World |
|
|
|
|
2 |
Other AP |
|
|
|
|
|
non-OECD |
|
|
|
|
1 |
|
|
|
|
|
|
OECD |
|
|
|
|
0 |
|
|
|
|
|
|
2000 |
2010 |
2020 |
2030 |
2040 |
Heavy industry transitions toward cleaner fuels
2017-2040 change in quadrillion BTUs
10
|
|
|
|
|
Biomass/Other |
|
|
|
|
|
Oil |
|
|
|
|
|
Coal |
5 |
|
|
|
|
Natural gas |
|
|
|
|
|
Electricity/ |
0 |
|
|
|
|
Market heat |
|
|
|
|
|
|
-5 |
|
|
|
|
|
-10 |
|
|
|
|
|
-15 |
OECD |
China |
India |
Other AP |
Rest of |
|
|||||
|
|
|
|
non-OECD |
World |
•Heavy industry energy intensity measures the amount of energy used in heavy industry and manufacturing per dollar of overall economic activity (GDP)
•Producing more value with less energy has a positive impact - economically and environmentally - for manufacturing companies and countries
•OECD nations have lower energy intensity due to their service-based economies and predominance of higher-value, energy-efficient industries
•China's intensity spiked as it invested in infrastructure and heavy industry; recently its intensity has been improving rapidly as its economy matures and efficiency increases
•Optimizing energy use via advances in technology, processes and logistics can help companies remain competitive and contribute to gains in global energy-intensity
•Manufacturing tends to gravitate toward regions with access to abundant, affordable energy, an able workforce and balanced policies
•Each region’s fuel mix differs based upon its unique blend of manufacturing activity and the relative availability and cost of its energy sources
•Electricity use is expected to grow; it is ideal for motors, robotics and process controls
•Natural gas is expected to give a competitive edge to resource-rich areas of Africa, the Middle East and Latin America; it also helps China manage its air quality
•Coal’s use declines in the OECD and China but doubles in coal-producing India and the rest of Asia because of coal’s abundance and affordability relative to other fuels
Visit exxonmobil.com/energyoutlook |
Subscribe to energyfactor.com |
Follow @exxonmobil |
Follow facebook.com/exxonmobil |
vk.com/id446425943 |
P.23 |
2019 OUTLOOK FOR ENERGY | DEMAND |
|
|
|
INDUSTRIAL — CHEMICAL PROJECTIONS
Consumer demand boosts chemicals energy growth
Quadrillion BTUs
70 |
|
|
|
|
60 |
|
|
|
Rest of |
|
|
|
|
World |
50 |
|
|
|
Middle East |
|
|
|
|
|
40 |
|
|
|
Other AP |
|
|
|
non-OECD |
|
30 |
|
|
|
China |
|
|
|
|
|
20 |
|
|
|
|
|
|
|
|
Rest of OECD |
10 |
|
|
|
|
|
|
|
|
United States |
0 |
|
|
|
|
2000 |
2010 |
2020 |
2030 |
2040 |
•Chemicals are the building blocks for a wide variety of products people rely on every day
•Demand for fertilizer, adhesives, cosmetics, textiles and plastics used in medical devices, cars, computers and other basic home goods spur chemicals growth
•Asia Pacific’s chemicals production grows to meet the needs of its rising middle class
•Investors in the U.S. and Middle East chemicals production are expected to tap abundant, affordable energy supplies (used as feedstock and fuel) to gain competitive advantage
•Europe, Russia, South Korea and Japan remain important contributors to global chemicals production
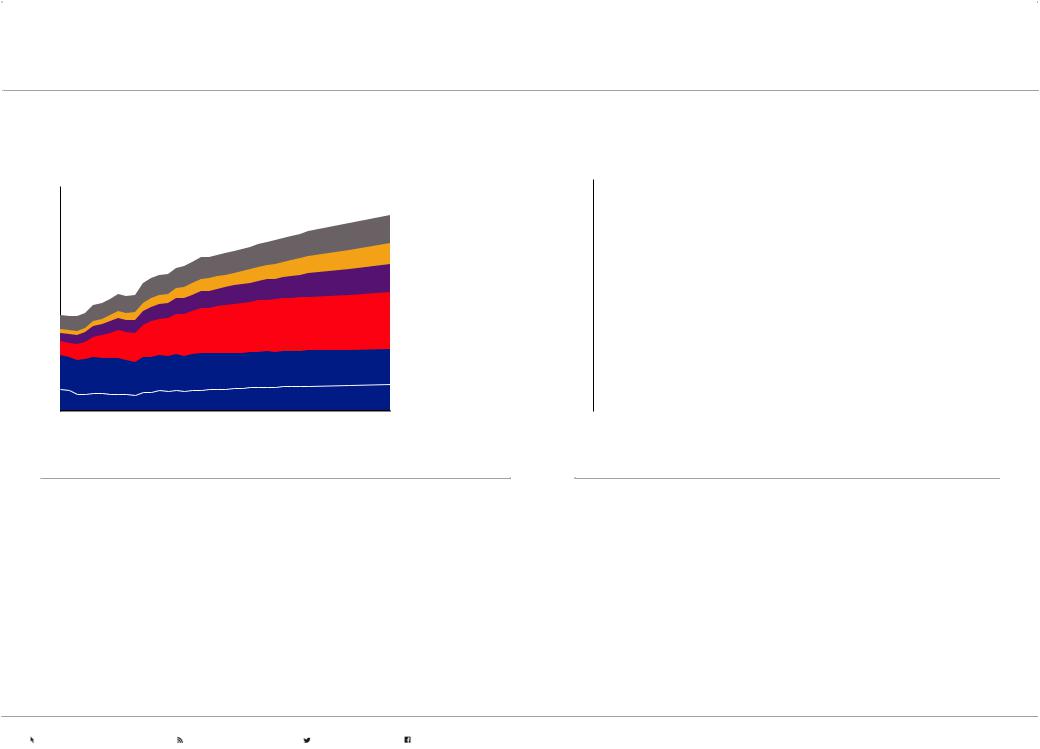
Chemicals production relies on oil and natural gas
World – quadrillion BTUs 70
60 |
|
|
|
|
|
Gas liquids |
|
|
|
|
|
||||
|
|
|
|
|
|
||
50 |
|
|
|
|
|
|
|
40 |
|
|
|
|
|
Naphtha |
|
|
|
|
|
||||
30 |
|
|
|
|
|
Other oil |
|
|
|
|
|
|
|
||
20 |
|
|
|
|
|
Natural gas |
|
|
|
|
|
|
|
||
10 |
|
|
|
|
|
Coal |
|
|
|
|
|
|
|||
|
|
|
|
||||
|
|
|
|
|
|
||
0 |
|
|
|
|
|
Electricity/Market heat |
|
|
|
|
|
|
|
|
|
2017 |
2040 |
|
|
||||
•The chemical industry uses hydrocarbon products as both a feedstock and a fuel
•Naphtha and natural gas liquids are primarily used as feedstock; natural gas is used as both a feedstock (notably for fertilizer) and a fuel
•Natural gas liquids consumption almost doubles from 2017 to 2040, as unconventional oil and natural gas production in the United States expands supply
•Naphtha is expected to remain the dominant feedstock in Asia; the Middle East is expected to rely on natural gas liquids and natural gas
•Advances in plastic materials and chemical processes can save energy as the industry continues to meet rising consumer demand for high-performing products
Visit exxonmobil.com/energyoutlook |
Subscribe to energyfactor.com |
Follow @exxonmobil |
Follow facebook.com/exxonmobil |
vk.com/id446425943 |
P.24 |
2019 OUTLOOK FOR ENERGY | DEMAND |
|
|
|
ELECTRICITY AND POWER GENERATION — PROJECTIONS
Global electricity demand rises 60 percent
Since it first started lighting homes in the late 1800s, electricity has provided the means to boost economic productivity and improve the human condition with modern conveniences like electric motors, air conditioning and refrigeration. Power generation has witnessed transitions in fuel sources from coal to nuclear and gas, and now we are harnessing wind and solar energy. The growth of new energy sources is impacted by factors such as technology cost improvements, the availability and quality of domestic resources, and government policies.
Electricity demand is expected to grow around the globe, supplied primarily by growth in wind, solar, natural gas-fired generation and nuclear. Besides meeting residential, commercial, and industrial demand, the increase in electricity demand is also fueled by the growth of electric vehicles in light-duty transportation. Cost reductions in transportation batteries are being leveraged for other applications including larger-scale electricity storage.
Today, batteries represent a small share of installed capacity on the grid, and are used for short-duration storage. The increased variable production from weather-dependent wind and solar triggers additional transmission build-out, storage and flexible gas peaking generation but results in reduced asset efficiency. Further breakthroughs that provide new solutions deployable at commercial scale to maintain reliable and affordable electricity for consumers are needed.
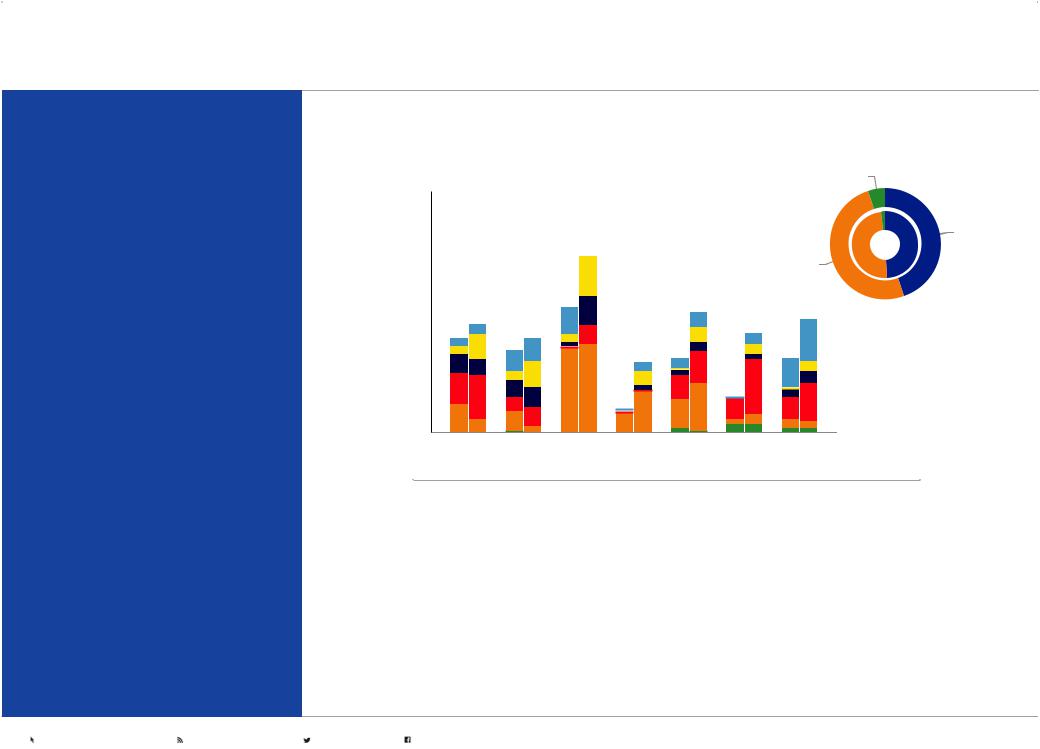
Electricity generation highlights regional diversity
Net delivered electricity – thousand TWh
|
|
Transportation |
10 |
2040 |
|
|
||
|
|
2017 |
|
|
|
8 |
|
Industrial |
|
|
|
|
|
|
Res/Comm
6
4 |
|
Other renewables |
|
|
|
||
|
|
Wind/Solar |
|
2 |
|
Nuclear |
|
|
|
||
|
|
Natural gas |
|
'17 |
'40 |
Coal |
|
Oil |
|||
0 |
|
||
|
|
United |
Europe |
China |
India |
Other Middle East / |
Rest of |
States |
|
|
|
Asia Pacific Africa |
World |
•The mix of electricity generation varies geographically as a result of technology costs, domestic resource availability and policy targets (e.g., renewable portfolio standards for local generation)
•Much of the world continues to shift further to lower-carbon sources for electricity generation, led by wind and solar, natural gas and nuclear, based on local opportunities and policies
•In 2017, coal-fired generation was the leading source of electricity production (accounting for over 45 percent in non-OECD countries). While China’s coal-fired electricity remains nearly constant to 2040, its share in power generation decreases as renewables and nuclear provide almost 85 percent of the delivered electricity growth
•The share of electricity use into transportation is small today, but is expected to grow with increasing penetration of electric vehicles as a result of emissions/fuel economy targets and cheaper batteries
Visit exxonmobil.com/energyoutlook |
Subscribe to energyfactor.com |
Follow @exxonmobil |
Follow facebook.com/exxonmobil |
vk.com/id446425943 |
P.25 |
2019 OUTLOOK FOR ENERGY | DEMAND |
|
|
|
ELECTRICITY AND POWER GENERATION — PROJECTIONS
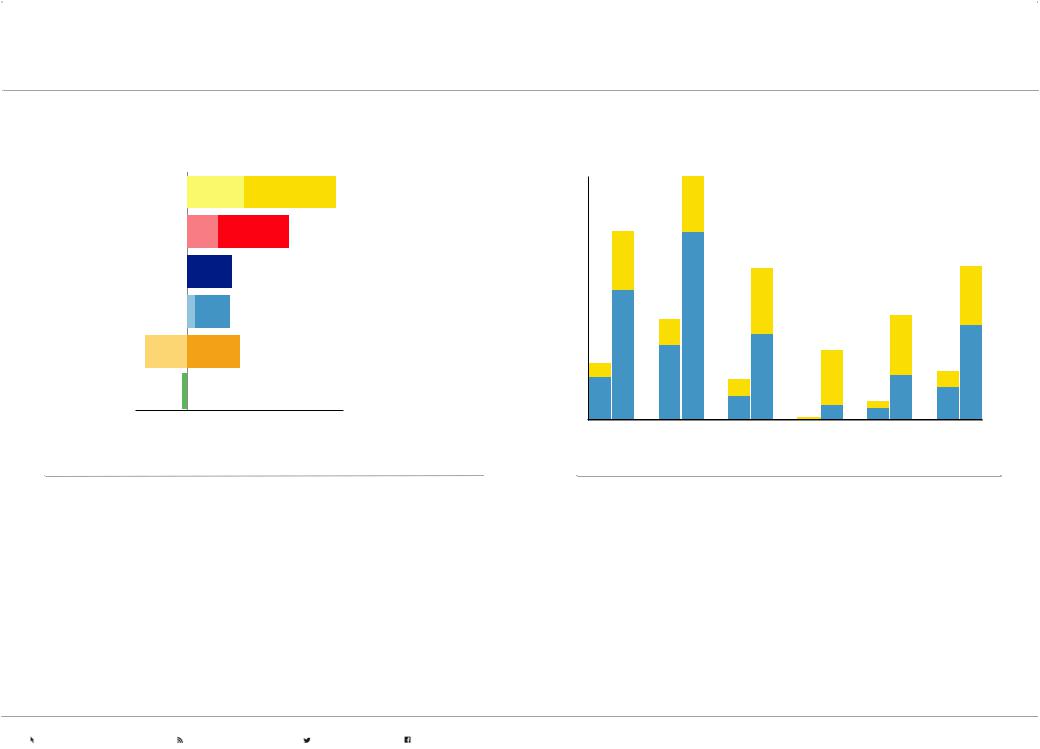
Renewables and natural gas dominate growth |
Renewables penetration increases across all regions |
Global growth 2017-2040 – thousand TWh (net delivered) |
Wind/Solar share of delivered electricity percent – share of TWh |
Wind/Solar |
OECD |
|
Non-OECD |
|
30 |
|
|
|
|
|
|
|
Natural gas |
|
|
|
|
|
|
|
|
|
|
|
|
Nuclear |
|
|
|
|
20 |
|
|
|
|
|
|
|
|
|
|
|
|
|
|
|
|
|
|
||
Other renewables |
|
|
|
|
|
|
|
|
|
|
Solar |
|
|
|
|
|
|
|
|
|
|
|
|
||
Coal |
|
|
|
|
10 |
|
|
|
|
|
|
|
|
|
|
|
|
|
|
|
|
|
|
||
|
|
|
|
|
|
|
|
|
|
|
Wind |
|
Oil |
|
|
|
|
|
|
|
|
|
|
|
|
|
|
|
|
|
'17 |
'40 |
|
|
|
|
|
|
-2 |
0 |
2 |
4 |
6 |
0 |
|
|
|
|
|
|
|
North |
Europe |
Asia Pacific |
Middle |
Africa |
World |
|||||||
|
|
|
|
|
||||||||
|
|
|
|
|
America |
|
|
East |
|
|
||
•Wind and solar generation grow the most to 2040, supported by technology cost reductions (particularly for solar) and policies targeting lower CO2 emissions
•Natural gas grows significantly; OECD growth is partially due to coal-to-gas switching, while half of the non-OECD growth is in gas-producing Africa and the Middle East
•China accounts for nearly 70 percent of all nuclear growth. OECD growth nets to near zero as expected nuclear restarts in Japan are offset by phase-out of nuclear in other OECD nations due to concerns about costs and safety
•Coal-fired generation grows in the non-OECD, primarily in Asia Pacific countries with domestic resources, growing electricity demand and favorable economics
•Wind and solar grow across the globe, but penetration in 2040 varies based on natural resource quality and varying levels of policy support. Globally, wind and solar’s share of delivered electricity grows significantly from about 6 percent in 2017 to about 20 percent in 2040
•In 2040, wind and solar are expected to deliver 25 percent or more of electricity in Europe and North America, contributing to renewables policy goals
•Renewables growth in Asia Pacific contributes to local air quality improvements and energy security goals
•Up to 20-30 percent wind and solar penetration can be achieved without significant additional costs to the power grid. Higher penetration levels incur additional costs to manage intermittency through flexible backup generation, transmission build-out and storage to ensure reliable electricity delivery
Visit exxonmobil.com/energyoutlook |
Subscribe to energyfactor.com |
Follow @exxonmobil |
Follow facebook.com/exxonmobil |
vk.com/id446425943 
ELECTRICITY AND POWER GENERATION — CONSIDERATIONS
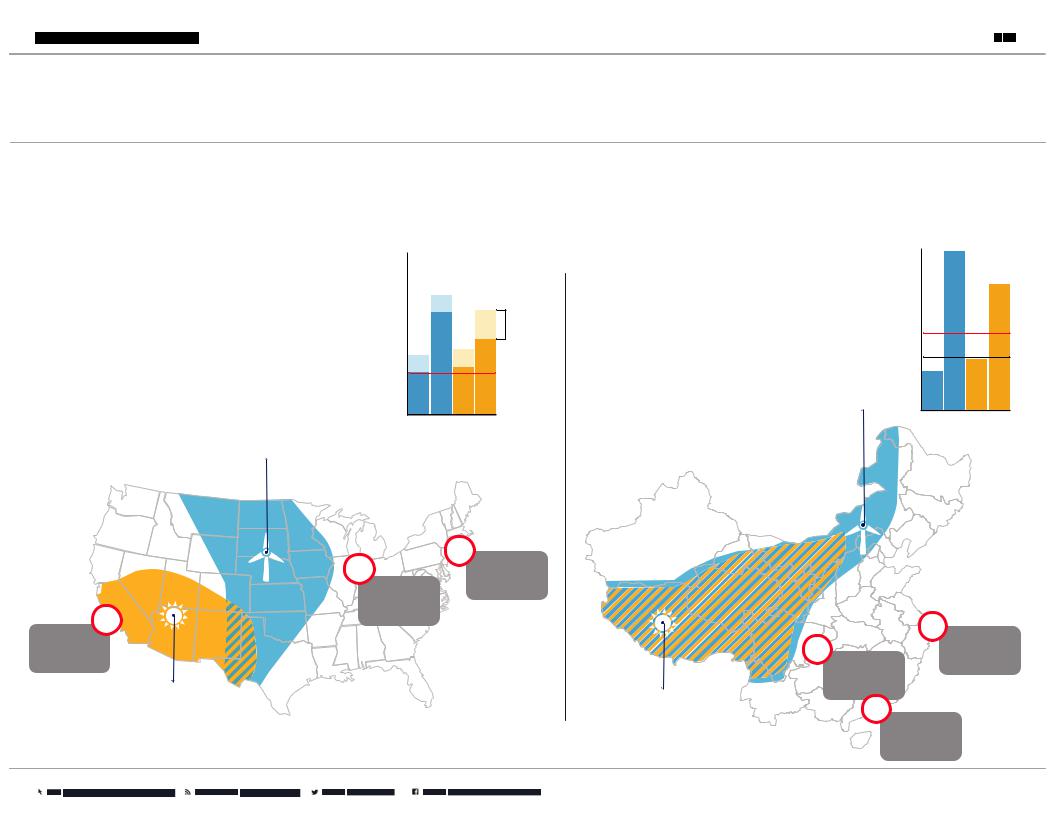
Wind and solar are potential solutions for lower-emission power generation, but the quality of resources varies geographically, even within national borders. These resources are also not always located near high population areas demanding electricity, requiring additional transmission and distribution infrastructure. Technology choices used in power generation can be compared by looking at the cost plus return on capital to generate a unit of electricity, known as the levelized cost of energy (LCOE). This cost is impacted by factors including the cost for the equipment, maintenance, fuel, financing terms and tax incentives. As shown below, resource quality variation can lead to a 2-3 fold increase in cost due to location. Assessing the optimum mix of power generation technologies is a local evaluation because cost factors and policies can vary greatly between sites even within a country.
WIND AND SOLAR IN THE CONTINENTAL US
Solar power is best suited in the Southwest region of the United States, while wind power is concentrated in the middle plains. High quality wind and solar resources are cost-competitive against low-price natural gas generation in these parts of the U.S. with support from tax and financing incentives.
WIND
2018 LCOE in $2018 USD/MWh
150
100 |
Tax credit |
50 |
New gas |
0 |
High Low High Low
Resource quality
|
2018 LCOE in $2018 USD/MWh |
||
|
150 |
|
|
WIND AND SOLAR IN MAINLAND CHINA |
|
|
|
China’s build-out of long-distance transmission is |
100 |
|
|
connecting high resource wind and solar renewables in |
|
|
|
the northwest to high population centers.High quality |
|
|
New gas |
wind and solar resources are competitive versus |
|
|
|
|
|
|
|
imported natural gas, while coal remains a low-cost |
50 |
|
New coal |
option but has challenges with air quality impacts. |
|
|
|
|
WIND |
|
|
|
0 |
|
|
|
High |
Low |
High Low |
|
Resource quality |
||
|
20M |
|
|
10M |
New York |
|
|
metropolitan |
|
|
|
|
|
|
|
Chicago |
area population |
|
|
metropolitan |
|
|
|
area population |
|
|
|
13M |
|
|
36M |
Los Angeles |
|
|
|
|
|
Shanghai |
|
metropolitan |
|
25M |
metropolitan |
area population |
|
Chongqing |
area population |
|
|
metropolitan |
|
SOLAR |
|
area population |
|
SOLAR |
44M |
|
|
|
|
Guangzhou
metropolitan
SHADED AREAS INDICATE HIGHER area population
QUALITY WIND/SOLAR RESOURCES
vk.com/id446425943 |
P.27 |
2019 OUTLOOK FOR ENERGY | DEMAND |
|
|
|
ELECTRICITY AND POWER GENERATION — NATURAL GAS SENSITIVITY
Similar to the transportation sector, we use sensitivity analyses to provide greater perspective on how changes to our base Outlook assumptions in the power generation sector could affect the energy landscape.
Power generation modeling is complex with a number of questions to explore for both demand growth and supply mix, including:
•How will electricity access expand in developing nations?
•How will technology evolve to enable more electricity use in other sectors (e.g., EVs for personal mobility instead of gasoline-fueled cars or mass transit)?
•How will developing nations transition off coal if it is their lowest cost supply today?
•Will perceptions about nuclear safety challenge new builds in some countries?
•What is the optimum penetration of variable renewables before intermittency challenges create reliability and cost impacts for power grids?
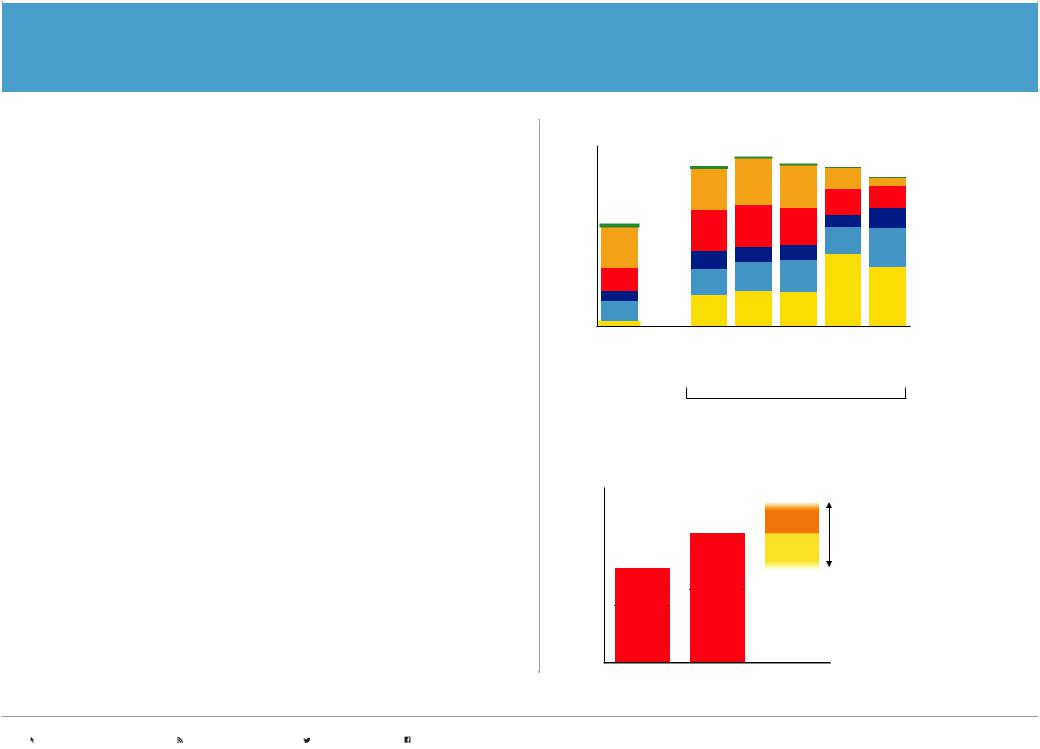
There are a number of different potential outcomes for each of these questions that could yield different projections. The top chart shows outcomes for different third-party models, including some deep decarbonization scenarios like the IEA’s Sustainable Development Scenario (IEA SDS). These results describe a range of potential outcomes with some common trends:
•Electricity demand grows significantly from today to 2040
•Zero-carbon power generation grows 2-3x due to cost competitiveness and policies
•Gas use for electricity grows in all cases except the IEA SDS, accompanied with coal’s decline primarily in developed countries
The bottom chart is a sensitivity to test the impact of alternate assumptions on natural gas:
•Lower cost wind and solar with efficient storage to manage their inherently variable production could increase penetration to 50 percent of supply (more than 2x the base Outlook). Ratable reductions in both coal and natural gas by region could reduce global natural gas demand by ~115 BCFD
•Decline in coal-fired generation occurs predominantly in developed countries out to 2040. Switching 50 percent of the remaining coal to natural gas to address issues such as air quality and emissions could increase natural gas demand by over
20 percent
Monitoring technology advancements, market behavior and the evolving policy landscapes can identify signposts related to cost reduction, technology deployment and policy targets indicating how a different outcome may materialize.
Views of the electricity supply mix vary based on assumptions
Supply of electricity - Thousand TWh 45
|
|
|
|
|
|
|
|
|
Oil |
|
|
|
|
|
|
|
|
|
Coal |
30 |
|
|
|
|
|
|
|
|
Natural gas |
|
|
|
|
|
|
|
|
Nuclear |
|
|
|
|
|
|
|
|
|
|
|
|
|
|
|
|
|
|
|
|
Other |
15 |
|
|
|
|
|
|
|
|
renewables |
|
|
|
|
|
|
|
|
|
|
|
|
|
|
|
|
|
|
|
Wind/Solar |
0 |
19EO |
|
|
|
|
|
|
|
|
19EO |
IHS |
Rivalry |
IEA |
NPS |
McKinsey |
GEP |
IEA |
SDS |
|
|
|
|
|
|
|
||||
|
|
|
|
|
|
|
|
||
2017 |
|
|
|
2040 |
|
|
|
||
Source: IHS Markit, IEA World Energy Outlook 2018, McKinsey |
|
|
|
||||||
Different policy or technology choices can impact gas demand
Global natural gas demand sensitivity – BCFD
700
|
|
|
Power |
|
|
|
|
|
|
||
350 |
|
|
generation |
|
|
Power |
|
||||
|
|
||||
|
generation |
|
|
|
|
|
|
|
|
|
|
Non-power
Non-power
0
Up to ~50 percent remaining coal-fired generation switched to natural gas
Up to ~50 percent share penetration of wind/solar
2017 2040
Natural gas volume represents both power generation and non-power sector demand Shaded ranges are indicative of potential shifts in demand relative to base Outlook
Visit exxonmobil.com/energyoutlook |
Subscribe to energyfactor.com |
Follow @exxonmobil |
Follow facebook.com/exxonmobil |

vk.com/id446425943
Energy - in all its forms - enables growth and prosperity. As economies grow, as technology advances, as consumers SUPPLY — PROJECTIONS become more environmentally aware and as policies adapt, global energy demand will evolve to meet changing needs.
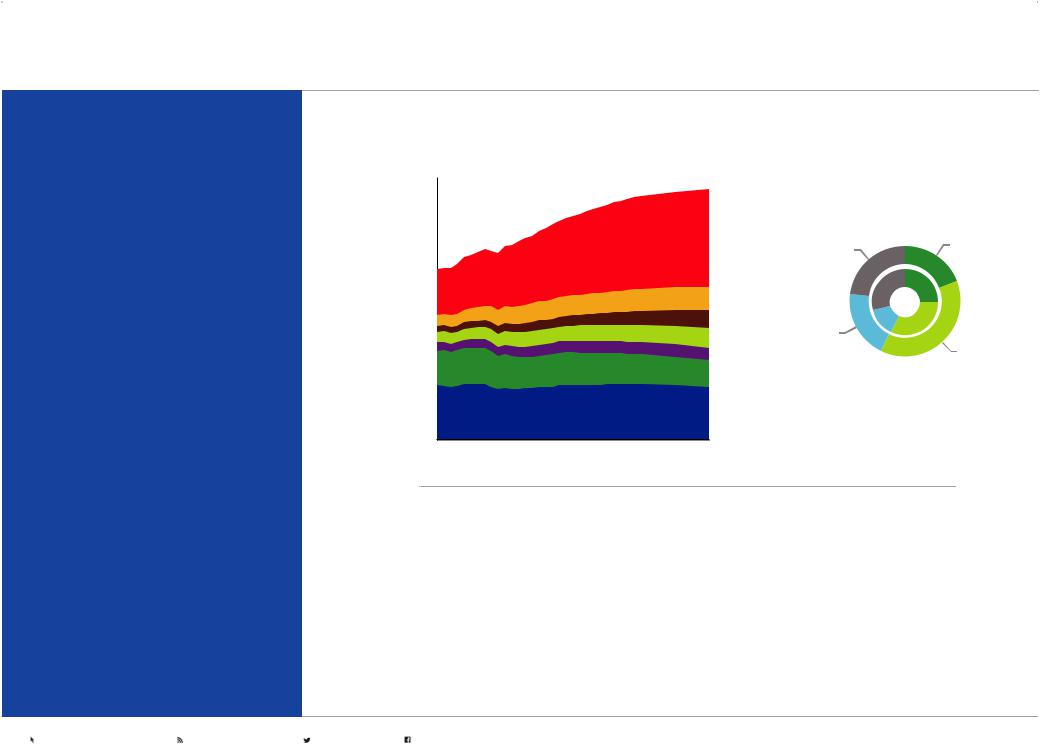
The supply mix to meet rising consumer demand will be increasingly diverse, leveraging a wide range of economic energy sources. Renewables - wind, solar, biofuels, hydro and geothermal energy - together with carbon-free nuclear energy are expected to grow at the fastest pace. Oil and natural gas (and even coal) continue to play a significant role in providing reliable, affordable energy the world needs to sustain global economic progress.
From the industrial revolution to the shale revolution and the rise of modern renewables, innovators, engineers and entrepreneurs have tackled tough challenges to unlock new energy sources - and we expect they will continue to do so.
Projected share of 2040 energy
OIL GAS COAL BIOMASS
30% |
8% |
|
20%
26%
NUCLEAR |
WIND/SOLAR |
HYDRO/GEO/BIOFUELS |
7% |
4% |
4% |

vk.com/id446425943 |
P.29 |
2019 OUTLOOK FOR ENERGY | SUPPLY |
|
|
|
SUPPLY — PROJECTIONS
Energy supply evolves to meet demand projections
2040 global demand by fuel – quadrillion BTUs
250
|
Total energy: 0.8% |
|
|
Average annual growth rate from 2017 to 2040 |
|
0.6% |
Average annual growth |
|
rate from 2017 to 2040 |
|
|
200 |
|
|
|
|
|
2017 |
1.3% |
|
150 |
-0.4% |
|
|
|
|
100 |
|
|
|
0.4% |
|
50 |
2.2% |
|
|
|
|
|
6.7% |
1.4% |
|
|
|
|
|
2.5% |
0 |
|
|
Oil |
Gas |
Coal |
Biomass Nuclear Wind/ |
Hydro/ Biofuel |
|
|
|
Solar |
Geo |
•Technology improvements help achieve more efficient fuel use and lower emissions intensity across all sources of supply
•Oil remains the largest source; essential for commercial transportation and chemicals
•Natural gas demand rises the most, largely to help meet increasing needs for electricity and lower-carbon industrial heat
•Lower carbon energy sources - including wind/solar, biofuels and nuclear - increase at the fastest pace
•Coal is still prominent in some non-OECD countries, however global consumption likely peaked in 2013, as the OECD and China shift to lower-carbon energy sources
Global energy supplies vary by sector |
|
|
||||||
End-use energy - quadrillion BTUs |
|
Primary energy - quadrillion BTUs |
||||||
300 |
|
|
|
|
|
300 |
|
|
|
|
|
|
|
|
250 |
Wind/Solar |
|
250 |
|
|
|
|
|
Hydro/Geo |
||
|
|
|
|
|
|
|
||
|
|
|
|
|
|
|
Biomass |
|
200 |
|
|
|
Electricity/ |
|
200 |
Nuclear |
|
|
|
|
|
Mkt Heat |
|
|
||
|
|
|
|
|
|
|
||
150 |
|
|
|
Biofuels |
|
150 |
|
|
|
|
|
|
|
|
|
Coal |
|
100 |
|
|
|
|
|
100 |
|
|
50 |
|
|
|
|
|
50 |
Natural gas |
|
0 |
'17 |
'25 |
'40 |
|
|
0 |
Oil |
|
Transportation |
Residential/ |
Industrial |
Electricity |
|||||
|
|
|||||||
|
|
|
|
Commercial |
|
|
generation |
|
•The energy mix to meet rising demand - while also addressing environmental impacts, including the risks of climate change - will vary by sector
•Oil remains essential for transportation, where growing commercial transportation still relies on liquid fuels to meet more than 90 percent of demand
•With a drive for cleaner and more efficient operations, the industrial sector relies primarily on electricity and natural gas for growth; industrial oil demand grows as a feedstock for chemicals, asphalt, lubricants and other specialty products
•Electricity demand rises in all end-use sectors while the mix of fuel supply for electricity generation is shifting to lower-carbon sources
Visit exxonmobil.com/energyoutlook |
Subscribe to energyfactor.com |
Follow @exxonmobil |
Follow facebook.com/exxonmobil |
vk.com/id446425943 |
P.30 |
2019 OUTLOOK FOR ENERGY | SUPPLY |
|
|
|
LIQUIDS — PROJECTIONS
Liquids are projected to remain the world’s leading energy source in 2040, even as demand growth slows beyond 2030.
Commercial transportation and chemicals - sectors where liquid fuels are favored for their high energy density and distinctive chemical properties - drive liquids demand growth. Overall, demand for liquids is expected to rise about 16 million barrels per day by 2040 with almost all of the growth in the emerging markets of Asia, Africa, the Middle East and Latin America.
New investments in oil production - and in technologies to improve recoverability, enhance efficiency and reduce cost - are needed to offset natural production decline and meet rising demand. Much of the growth in liquids production is expected to be from sources of supply that have been unlocked by technology advances in the past two decades: North American tight oil and the natural gas liquids associated with unconventional oil and gas production, deepwater projects offshore Brazil and Guyana, and Canadian oil sands, for example.
Continued investment in conventional crude and condensate is required too as the Middle East and Russia/Caspian remain significant oil producing regions helping meet the needs of consumers worldwide.
Liquids demand driven by transportation and chemicals |
|
|
|
||||
By region and sector – MBDOE |
|
|
|
|
|
|
|
120 |
|
|
|
|
|
|
|
100 |
|
|
|
Asia Pacific |
|
|
|
|
|
|
|
|
|
Light-duty |
|
|
|
|
|
|
Other |
|
|
|
|
|
|
|
2040 |
transportation |
|
80 |
|
|
|
|
|
|
|
|
|
|
|
|
|
|
|
|
|
|
|
|
|
2017 |
|
60 |
|
|
|
Middle East |
|
|
|
|
|
|
Africa |
|
|
|
|
|
|
|
|
|
|
|
|
|
|
|
|
Latin America |
Chemicals |
|
Commercial |
40 |
|
|
|
Russia/Caspian |
|
|
|
|
|
|
|
|
transportation |
||
|
|
|
|
Europe |
|
|
|
20 |
|
|
|
North |
|
|
|
|
|
|
|
|
|
|
|
|
|
|
|
America |
|
|
|
0 |
|
|
|
|
|
|
|
2000 |
2010 |
2020 |
2030 |
2040 |
|
|
|
•Global liquids demand growth is concentrated in developing nations, with Asia Pacific accounting for about 65 percent of global growth by 2040
•Efficiency gains and fuel switching in Europe reduce liquids demand by about 20 percent from 2017 to 2040, led by a reduction of about 55 percent in light-duty vehicle liquids demand
•Chemicals and commercial transportation sectors make up nearly all of the liquids demand growth, with these sectors growing about 60 percent and 40 percent, respectively to 2040
Visit exxonmobil.com/energyoutlook |
Subscribe to energyfactor.com |
Follow @exxonmobil |
Follow facebook.com/exxonmobil |