

ExxonMobil - Outlook for Energy 2019_watermark
.pdfvk.com/id446425943 |
P.11 |
2019 OUTLOOK FOR ENERGY | DEMAND |
|
|
|
DEMAND — PROJECTIONS
Global energy demand varies by sector
Primary energy – quadrillion BTUs |
|
|
||
750 |
Growth '17-'40 |
|
|
|
|
|
|
|
|
|
|
|
|
Residential/Commercial |
500 |
|
|
|
Industrial |
|
|
|
|
|
250 |
|
|
|
Electricity generation |
|
|
|
|
Light-duty transportation |
|
|
|
|
Commercial transportation |
0 |
|
|
|
|
2000 |
2010 |
2020 |
2030 |
2040 |
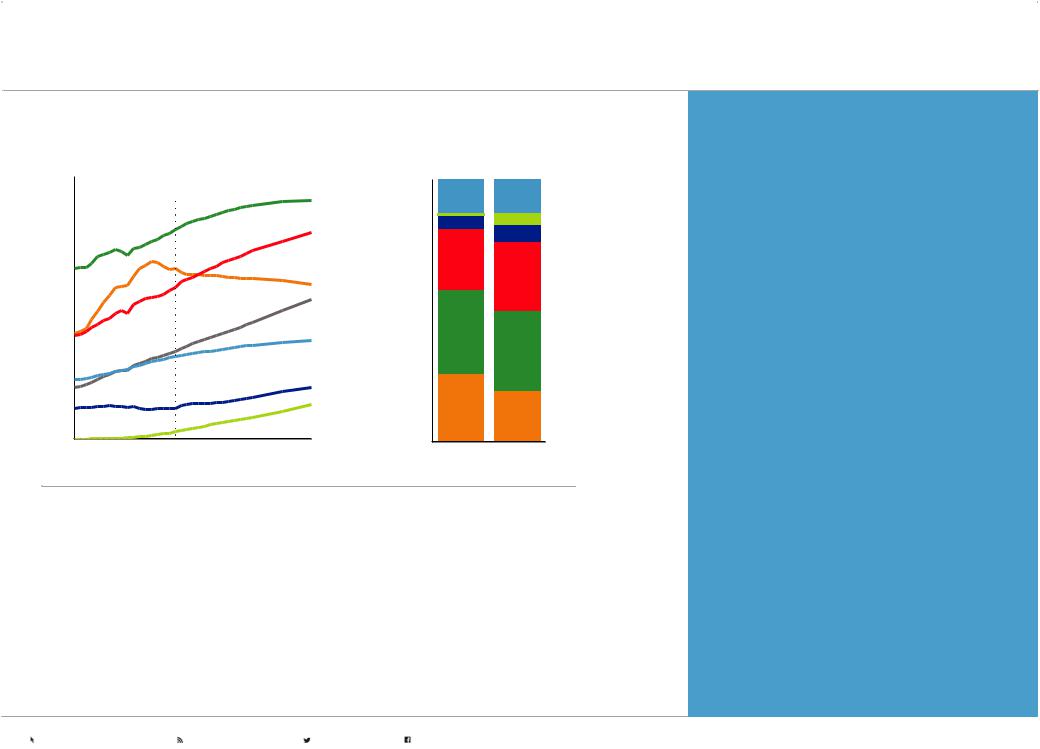
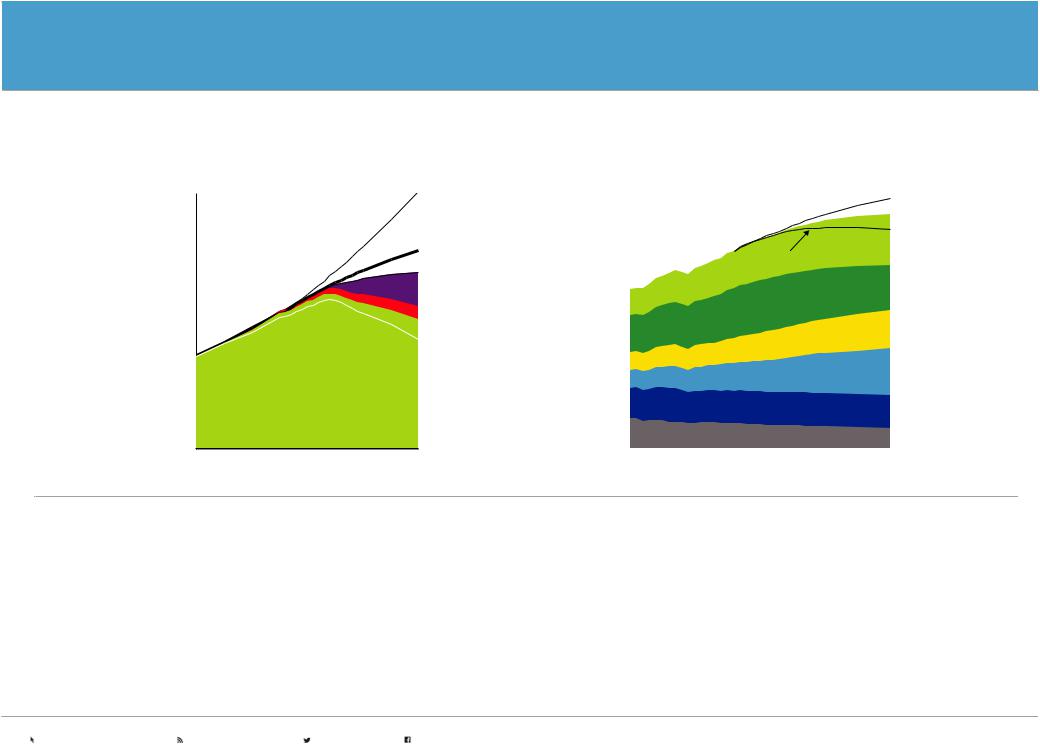
•Global demand reaches 675 quadrillion BTUs in 2040, up ~20 percent versus 2017, reflecting a growing population and rising prosperity
•Residential and commercial energy demand is flat out to 2040 as efficiency improvements offset the energy needs of a growing population
•Electricity generation is the largest and fastest-growing sector, primarily reflecting expanding access to reliable electricity in developing countries
•Industrial sector growth supports construction of buildings and infrastructure, and manufacturing of a variety of products to meet the needs of the world’s population
•Commercial transportation grows with expanding economies, which increase the movement of goods. Personal mobility also expands, but efficiency improvements and more electric vehicles offset the increase in vehicle miles traveled
Energy demand led by non-OECD
Percent of primary energy (percent) 100
80 |
Other non-OECD |
|
|
60 |
India |
|
|
40 |
China |
|
|
|
Other OECD |
20 |
Europe OECD |
|
|
|
United States |
0 |
|
2017 |
2040 |
•Global energy consumption continues to shift proportionally to developing economies where population and economic growth are both faster than the global average. Non-OECD share of global energy demand reaches ~70 percent in 2040
•China and India contribute ~50 percent of the world’s energy demand growth to 2040
•Efficiency gains outpace economic growth in the OECD, which helps offset energy demand increases historically linked to economic expansion
•The combined share of energy used in the United States and European OECD nations declines from about 30 percent in 2017 to less than 25 percent in 2040
Visit exxonmobil.com/energyoutlook |
Subscribe to energyfactor.com |
Follow @exxonmobil |
Follow facebook.com/exxonmobil |
vk.com/id446425943 |
P.12 |
2019 OUTLOOK FOR ENERGY | DEMAND |
|
|
|
DEMAND — PROJECTIONS
Global energy mix shifts to lower-carbon fuels
Quads |
|
|
|
|
225 |
|
2017 |
|
|
|
|
|
Oil |
|
|
|
|
|
|
|
|
|
|
Natural gas |
150 |
|
|
|
|
|
|
|
|
Coal |
|
|
|
|
Electricity |
75 |
|
|
|
Other renewables |
|
|
|
|
|
|
|
|
|
Nuclear |
|
|
|
|
Wind/Solar |
0 |
|
|
|
|
2000 |
2010 |
2020 |
2030 |
2040 |
Percent of primary energy (%)
100 |
|
|
Other renewables |
|
Wind/Solar |
80 |
Nuclear |
60 |
Natural gas |
|
|
40 |
Oil |
|
|
20 |
|
|
Coal |
0 |
|
2017 |
2040 |
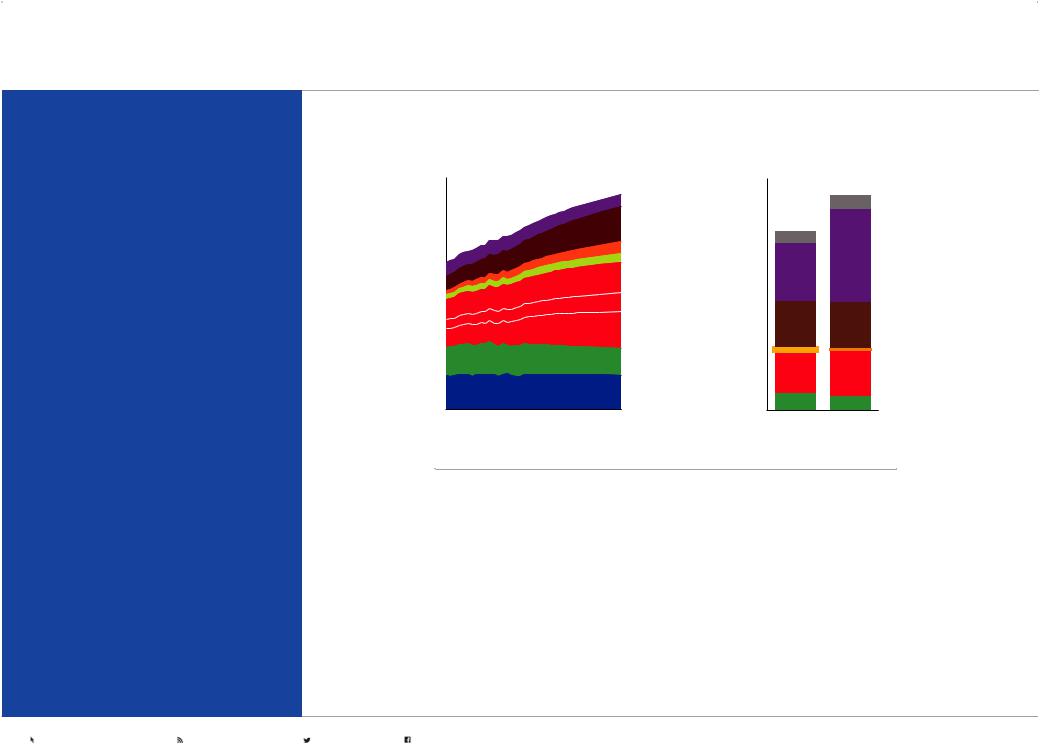
•Oil continues to play a leading role in the world’s energy mix, with growing demand driven by commercial transportation and feedstocks for the chemicals industry
•Natural gas grows the most of any energy type, reaching a quarter of all demand
•Renewables and nuclear see strong growth, contributing more than 40 percent of incremental energy supplies to meet demand growth
•Coal use remains significant in parts of the developing world, but drops below 20 percent global share as China and OECD nations transition toward lower-carbon sources like renewables, nuclear and natural gas
•Electricity, an energy carrier and not an energy source, grows ~3X faster than overall energy demand
Visit energyfactor.com to learn more about technology and innovations such as our cogeneration operations generating electricity and heat that are helping make operations more energy efficient.
Visit exxonmobil.com/energyoutlook |
Subscribe to energyfactor.com |
Follow @exxonmobil |
Follow facebook.com/exxonmobil |

vk.com/id446425943 |
P.13 |
2019 OUTLOOK FOR ENERGY | DEMAND |
|
|
|
TRANSPORTATION — PROJECTIONS
Commerce and trade drive transportation energy consumption up more than 25 percent
Over the past few decades the movement of people and goods has grown dramatically, driven by vast growth in the purchasing power of individuals. Likewise, technology advancements have provided new and more efficient mobility options.
Global transportation demand is driven by differing trends for commercial transportation and light-duty passenger vehicles. As economic activity expands, especially in developing regions, commercial transportation is expected to grow. The majority of the growth comes from heavy-duty trucking as a result of goods movement, but increased aviation travel also plays a role as individual purchasing power expands.
Passenger vehicle ownership is expected to expand as a result of the dramatic growth in the middle class and increased urbanization, leading to increased passenger vehicle travel. The fuel mix continues to evolve with more alternatives, like electric vehicles (BEV and PHEV).
In the 2018 Outlook, hypothetical sensitivities for light-duty demand showed that for every additional 100 million EVs on the road, liquids demand could fall by ~1.2 million barrels per day in 2040. In a 100 percent light-duty EV sensitivity by 2040, light-duty liquids demand could see 100 percent displacement while growth in chemicals and commercial transportation offset much of the decline resulting in similar liquids demand as seen in 2013. This 100 percent EV sensitivity by 2040 would require all passenger vehicle sales to be electric starting
in 2025.
Transportation energy demand growth driven by commerce
Global sector demand – million oil-equivalent barrels per day (MBDOE)
75
Rail Marine
Aviation
50
Heavy-duty
25
Light-duty
0
2000 |
2010 |
2020 |
2030 |
2040 |
•Global transportation-related energy demand is expected to grow by more than 25 percent from 2017 to 2040
•Personal vehicle ownership continues to grow as purchasing power rises, however, higher efficiency and more electric vehicles lead to a peak and decline in light-duty vehicle energy demand in the mid-2020s
•Commercial transportation (heavy-duty, aviation, marine and rail) energy demand is driven by growth in economic activity and personal buying power, which drives increasing trade of goods and services
•Aviation demand sees the highest annual growth rate at 2.2 percent from 2017 to 2040 due to both rising economic activity as well as rapid growth of the middle class, specifically in emerging economies
Visit exxonmobil.com/energyoutlook |
Subscribe to energyfactor.com |
Follow @exxonmobil |
Follow facebook.com/exxonmobil |
vk.com/id446425943 |
P.14 |
2019 OUTLOOK FOR ENERGY | DEMAND |
|
|
|
TRANSPORTATION — LIGHT-DUTY PROJECTIONS
Access to personal mobility increases
Vehicles per thousand people |
2040 total car fleet by region |
|
1,000 |
ROW |
U.S. |
|
||
|
|
|
Other AP non-OECD
800 |
|
|
|
Europe |
|
|
|
India |
|
600 |
|
|
|
Other OECD |
|
|
China |
|
|
|
|
|
|
|
400 |
|
|
|
|
|
|
|
|
Motorcycles |
200 |
|
|
|
|
'17 |
'40 |
|
|
Cars |
0 |
|
|
|
|
United |
Europe |
China |
India |
|
States |
|
|
|
|
Light-duty fleet by type
Million vehicles |
|
|
2,000 |
|
|
|
|
Electric/Plug-in/ |
|
|
Fuel cell |
1,500 |
|
|
|
|
Full hybrid |
|
|
Natural gas/LPG |
|
|
Diesel |
1,000 |
|
|
|
|
Gasoline |
500 |
|
|
0 |
|
|
2017 |
2025 |
2040 |
Light-duty demand by fuel
MBDOE |
|
|
30 |
|
|
|
|
Natural gas/LPG |
|
|
Electricity/Hydrogen |
20 |
|
Diesel |
|
|
|
10 |
|
Gasoline |
|
|
|
0 |
|
|
2017 |
2025 |
2040 |
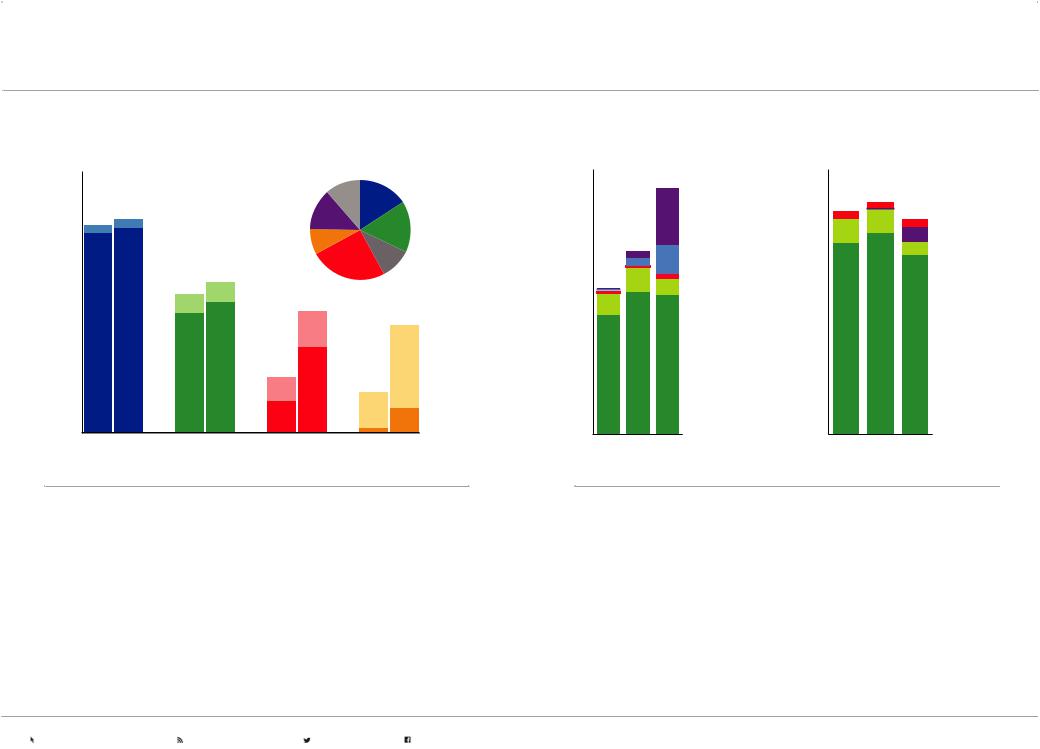
•When individual purchasing power increases, access to personal mobility also increases, driving growth of the global fleet of light-duty vehicles and motorcycles
•Motorcycles offer a lower-cost entry point to personal mobility, with ownership and growth particularly high in Asia Pacific
•Increasing access to vehicles drives a worldwide increase in personal mobility-related energy demand growth, with Asia Pacific leading the growth
•In the OECD (such as U.S. and Europe), while the number of cars per 1,000 people increases by about 10 percent, passenger vehicle fuel demand declines about 30 percent on average as a result of efficiency gains and powertrain diversification
•In 2017, the global fleet was about 1.1 billion vehicles, with ~3 million (0.3 percent) of the fleet being plug-in hybrids, battery electric & fuel cells
•By 2040, these advanced vehicles grow to over 20 percent of the fleet (~420 million) and nearly 30 percent of new car sales, driven by decreasing battery costs and policies for tailpipe emissions, efficiency and energy independence for importing countries
•Light-duty vehicle demand for internal combustion engine (ICE) fuels are projected to peak prior to 2025 and then decline to levels seen in the early-2010s by 2040
•The reduction in fuel demand, while driven in part by electrification, is mostly connected with efficiency gains across all vehicle types
Visit exxonmobil.com/energyoutlook |
Subscribe to energyfactor.com |
Follow @exxonmobil |
Follow facebook.com/exxonmobil |
vk.com/id446425943 |
P.15 |
2019 OUTLOOK FOR ENERGY | DEMAND |
|
|
|
TRANSPORTATION — COMMERCIAL TRANSPORTATION PROJECTIONS
Global transportation energy demand relative to GDP
Index, 1990=100
450 |
|
|
2017 |
|
|
|
|
|
|
|
|
400 |
|
|
|
|
GDP |
350 |
|
|
|
|
|
300 |
|
|
|
|
|
|
|
|
|
|
Commercial |
250 |
|
|
|
|
|
200 |
|
|
|
|
|
150 |
|
|
|
|
|
100 |
|
|
|
|
|
50 |
|
|
|
|
|
1990 |
2000 |
2010 |
2020 |
2030 |
2040 |
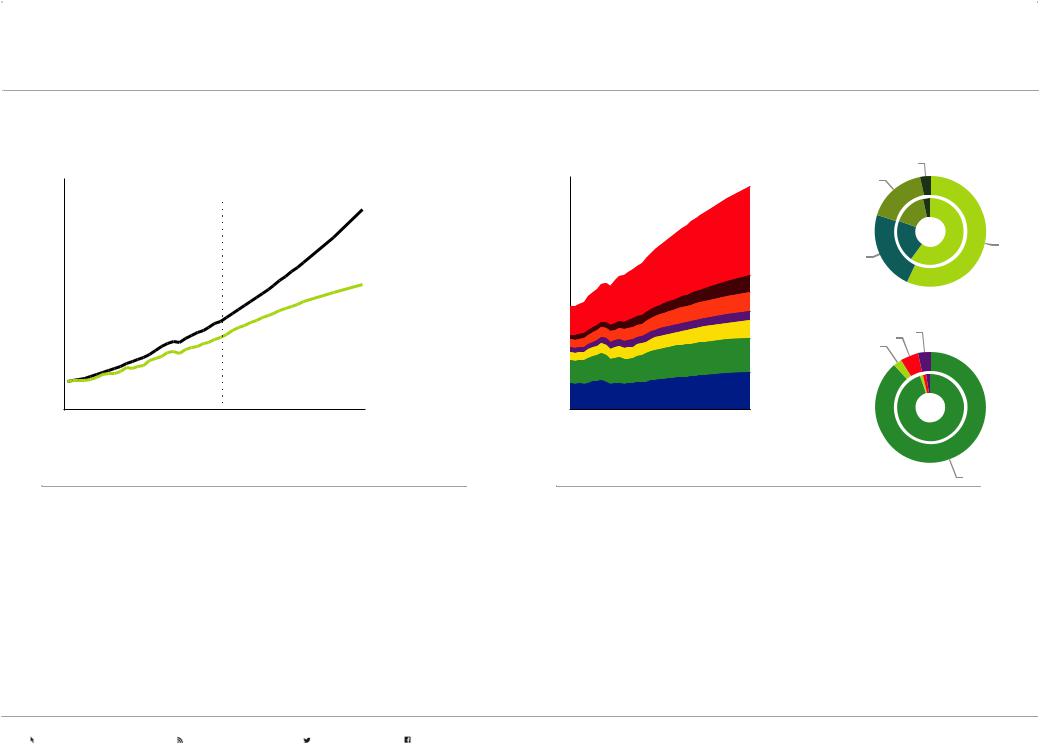
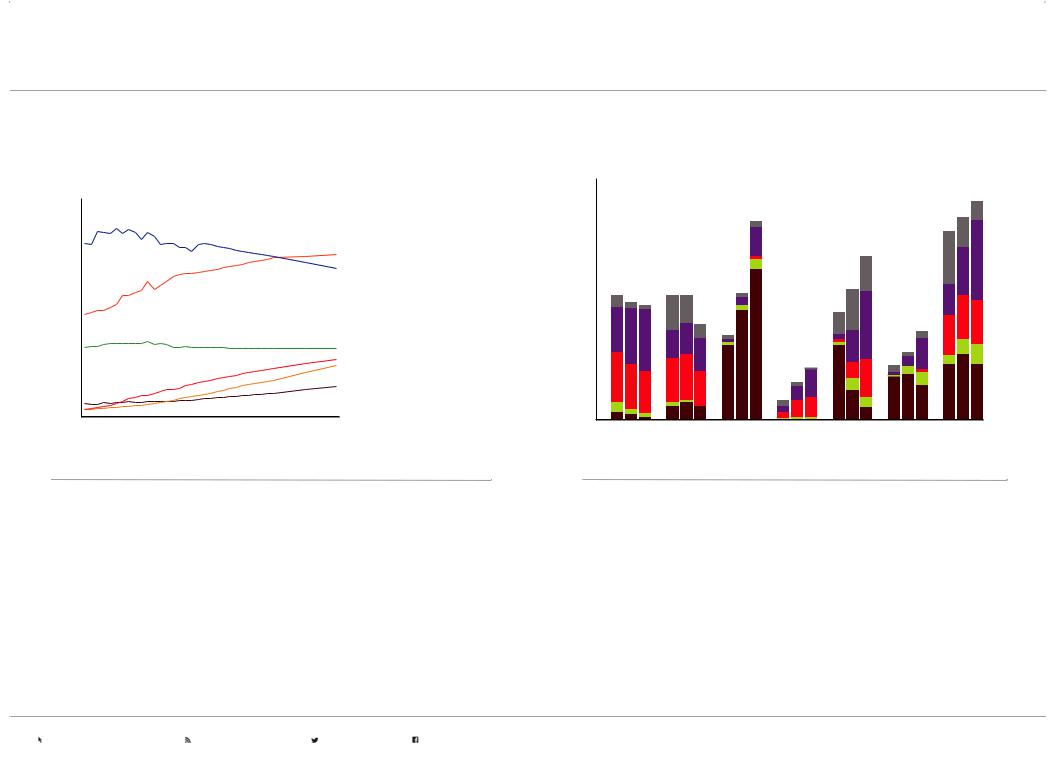
•Historically, commercial transportation services (e.g. ton-miles of freight, passenger-miles of air travel) demand growth tracks with GDP and economic growth
•As GDP continues to grow, especially in developing nations, there will be increased demand for goods and services
•Recent accelerated decoupling of the trends for GDP and commercial transportation demand has been observed and is expected to continue as a result of fuel switching and efficiency improvements (e.g., mode shifting, engine improvements or logistical improvements)
•Continued improvements in efficiency will moderate commercial transportation energy demand associated with expanding economic activity.
Commercial transportation grows in all aspects |
By sector |
|
|||||
Commercial transportation energy demand – MBDOE |
|
|
|||||
|
Rail |
|
|||||
|
|
|
|
|
|
|
|
50 |
|
|
|
|
Marine |
2040 |
|
|
|
|
|
|
|
||
|
|
|
|
|
|
|
|
|
|
|
|
|
|
2017 |
|
40 |
|
|
|
Asia Pacific |
|
|
|
|
|
|
|
|
|
|
Heavy- |
|
|
|
|
|
Aviation |
|
duty |
|
|
|
|
|
|
|
|
30 |
|
|
|
|
|
|
|
|
|
|
|
Africa |
|
|
|
|
|
|
|
Middle East |
|
By fuel |
|
20 |
|
|
|
Russia/Caspian |
|
|
|
|
|
|
Electric/Hydrogen |
|
|||
|
|
|
|
Latin America |
|
||
|
|
|
|
|
Natural gas |
. |
|
|
|
|
|
Europe |
Biofuels |
|
|
10 |
|
|
|
|
2040 |
|
|
|
|
|
|
|
|
||
|
|
|
|
North America |
|
2017 |
|
|
|
|
|
|
|
|
|
0 |
|
|
|
|
|
|
|
2000 |
2010 |
2020 |
2030 |
2040 |
|
|
|
|
|
|
|
|
|
|
Oil |
•The largest growth in commercial transportation services is observed in the non-OECD countries, driven by increases in population and GDP
•While all regions see some increased demand, Asia Pacific leads the growth, rising to 40 percent of commercial transportation energy demand
•All modes of commercial transport grow over the Outlook period, with heavy-duty trucking accounting for over 50 percent of the growth through 2040
•Electrification plays a role in certain applications (e.g., short-haul trucks and buses), but electricity in commercial transportation grows slowly due to upfront costs, range limitations, payload requirements, and the pace of infrastructure development
Visit exxonmobil.com/energyoutlook |
Subscribe to energyfactor.com |
Follow @exxonmobil |
Follow facebook.com/exxonmobil |
vk.com/id446425943 
TRANSPORTATION — HEAVY-DUTY LANDSCAPE
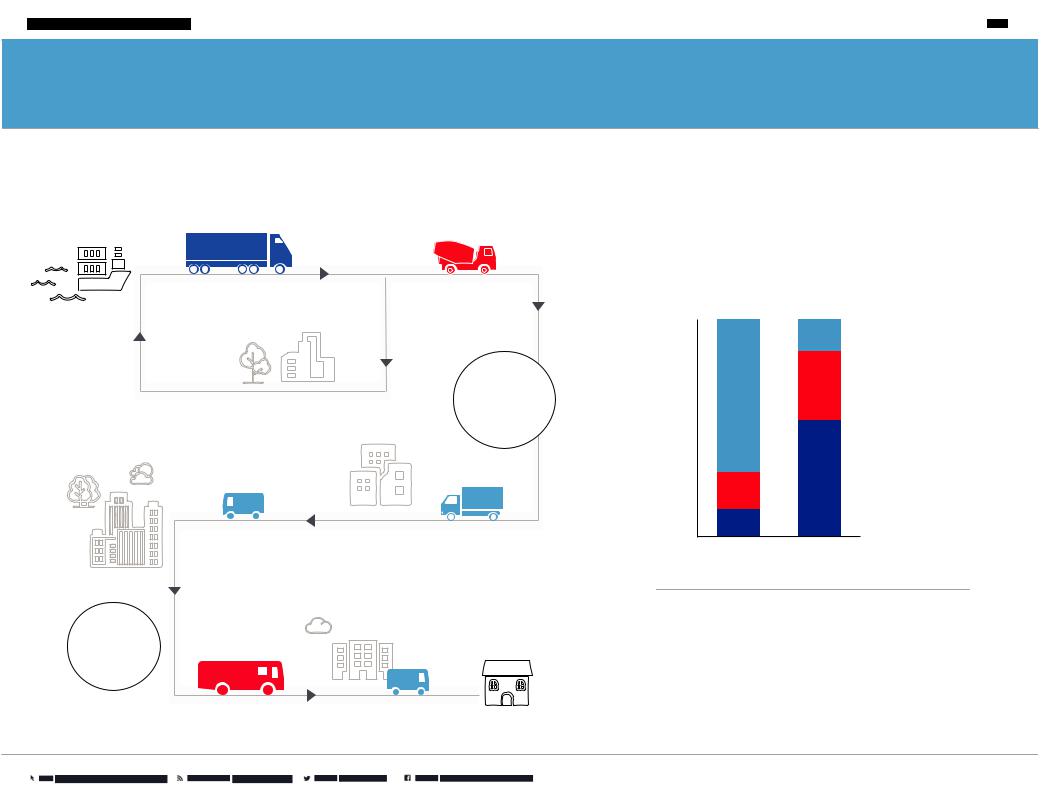
Heavy-duty transportation demand is is driven by economic activity, which leads to increased commerce and movement of goods across oceans, nations, and cities. Fuel demand in this sector is influenced by the type of truck and its use, so understanding fleet dynamics and fuel usage is important for projecting future demand. For example, a light commercial vehicle (LCV) for intra-city deliveries has different energy needs versus a heavy commercial vehicle (HCV) for cross-country shipments of goods. Additionally truck fleets can be quite different from region to region based on the distribution of various sector and economic needs, such as heavy industry, manufacturing or resource extraction.
18-wheeler |
Cement truck |
|
PORT |
Goods are transported from |
|
Heavy industry uses trucking |
port to factory on heavy-duty |
|
to move raw and building |
|
|
trucks as well as back to port |
Factory |
materials to-and-from factories |
|
for global shipment. |
and sites. |
Distribution
Center
Delivery truck
|
Once a product leaves a |
|
distribution center, it’s transported |
City |
to homes across the nation. |
|
~99%
Of the 400k+ electric buses worldwide in 2018, about 99 % of them are in China
Buses are an efficient means of movement in cities for largelargenumberofofpeople. .
>50%
Global heavy duty fuel demand grew by more than 50% from 2000 to 2017, with growth in almost every country
HOME
2015 Heavy-duty fleet/fuel usage mix
100% |
|
Light commercial |
|
|
|
||
|
|
(LCV): pickup, van, |
|
|
|
postal |
|
80% |
|
|
|
|
|
Med commercial |
|
|
|
(MCV): garbage, |
|
60% |
|
fire, regional bus |
|
|
|
||
40% |
|
|
|
|
~55 |
Heavy commercial |
|
20% |
(HCV): long-haul |
||
|
|||
|
(US CL8) |
||
|
|
||
~15 |
|
|
|
0% |
|
|
|
Fleet |
Fuel |
|
Source: IEA The Future of Trucks, 2017, EM analyses
•Fleet breakdown and truck usage play a critical role in understanding the types of alternate fuels available for substitution in trucking
•In 2015, HCV long-haul trucks made up ~15 percent of the fleet, but used ~55 percent of the fuel for trucking driven by the heavy loads carried over long distances
vk.com/id446425943 |
P.17 |
2019 OUTLOOK FOR ENERGY | DEMAND |
|
|
|
TRANSPORTATION — HEAVY-DUTY SENSITIVITY
We use sensitivity analyses to provide greater perspective on how changes to our base Outlook assumptions could affect the energy landscape. Our hypothetical sensitivities explore different fuel efficiency trends in a higher demand case as well as deep penetration of alternatives, such as electricity, biofuels, gas and hydrogen in a lower demand case
Heavy-duty fuels demand sensitivities
World – MBDOE |
|
|
35 |
|
High Sensitivity |
30 |
|
|
|
|
Base Outlook |
25 |
|
Low Sensitivity |
|
|
|
20 |
|
Electric/Hydrogen |
|
Natural gas |
|
|
|
|
15 |
|
Biofuels |
|
|
|
10 |
Liquids |
Oil |
|
|
|
5 |
|
|
0 |
|
|
2000 |
2020 |
2040 |
Liquids demand sensitivities by sector
World – MBDOE
125 |
|
|
High Sensitivity |
|
|
|
Heavy-duty |
||
100 |
|
|
||
|
Low Sensitivity |
transportation |
||
|
|
|
|
|
|
|
|
Light-duty |
|
75 |
|
|
transportation |
|
|
|
|
Air / Marine / Rail |
|
50 |
|
|
transportation |
|
|
|
|
|
|
|
|
|
Chemicals |
|
25 |
|
|
Other industrial |
|
|
|
|
||
|
|
|
Power generation / |
|
0 |
|
|
residential / commercial |
|
|
|
|
|
|
2000 |
2020 |
2040 |
||
•The base Outlook assumes that future efficiency improves on average at double the historical rate from 2000 - 2016, and that alternative fuels grow to ~13 percent of demand
•In comparison, the high demand sensitivity above assumes future efficiency improves only at the historical rate, which could increase demand ~30 percent versus the base Outlook, and highlights the need for continued technology investments in efficiency improvements
•The low demand sensitivity assumes a deeper penetration of alternative fuels with accompanying efficiency gains. The penetration assumptions vary by truck type and usages. LCVs see nearly 100 percent penetration of EVs due to shorter, start/stop routes, MCVs see 70 percent alternative fuels, and HCVs see ~20 percent alternatives, mostly biofuels due to the need for high energy density fuels in long-haul trucks. This sensitivity would require a rapid acceleration in the early 2020s of both alternate fuels into the heavy-duty fleet as well as infrastructure build-out to support the alternatives. The resulting fuel penetration is ~3x the base Outlook in 2040, with traditional fuel demand peaking prior to 2025 before declining to mid-2000s levels
•The impact on total liquids demand from the high sensitivity shows liquids demand could be ~7 percent above the base Outlook, while in the low demand sensitivity total liquids demand could peak in the mid-2030s as growth in chemicals, aviation and marine are offset by the heavy-duty decline
•These hypothetical sensitivities highlight the difficulty of decarbonizing heavy-duty transportation and the need for further technology development on economic, lower-carbon solutions
Visit exxonmobil.com/energyoutlook |
Subscribe to energyfactor.com |
Follow @exxonmobil |
Follow facebook.com/exxonmobil |
vk.com/id446425943 |
P.18 |
2019 OUTLOOK FOR ENERGY | DEMAND |
|
|
|
RESIDENTIAL AND COMMERCIAL — PROJECTIONS
As populations grow and prosperity rises, more energy will be needed to power homes, offices, schools, shopping centers and hospitals.
Combined residential and commercial energy demand is projected to rise by around 20 percent through 2040. Led by the growing economies of non-OECD nations, average worldwide household electricity use will rise about 25 percent between 2017 and 2040.
Energy efficiency plays a big role in constraining energy demand growth within the residential and commercial sectors as modern appliances, advanced materials and policies shape the future.
Demand shifts to non-OECD with growth primarily supplied by electricity
Demand by region – quadrillion BTUs
150 |
|
|
|
Russia/Caspian |
|
|
|
|
|
125 |
|
|
|
Africa |
|
|
|
|
Middle East |
100 |
|
|
|
Latin America |
|
|
|
|
Other Asia Pacific |
75 |
|
|
|
India |
|
|
|
|
|
50 |
|
|
|
China |
25 |
|
|
|
Europe |
|
|
|
|
|
|
|
|
|
North America |
0 |
|
|
|
|
2000 |
2010 |
2020 |
2030 |
2040 |
World mix – quadrillion BTUs |
|
150 |
|
|
Other |
125 |
|
100 |
Electricity |
75 |
|
|
Biomass |
50 |
|
|
Coal |
25 |
Natural gas |
0 |
Oil / LPG |
|
|
2017 |
2040 |
•In addition to the energy people need to heat or cool their homes and keep appliances running, this sector also includes the energy required in hospitals, schools, grocery stores, retail shops, offices, sports facilities and cultural centers
•With rising prosperity and expanding commercial activity comes an increased demand for lighting, heating, cooling and power in homes and offices of around 20 percent by 2040
•Strong middle-class growth in non-OECD nations increases energy demand by more than 35 percent. Improving building efficiencies lower energy demand in OECD countries by about 5 percent
•Globally, electricity supplies the entire net demand increase
Visit exxonmobil.com/energyoutlook |
Subscribe to energyfactor.com |
Follow @exxonmobil |
Follow facebook.com/exxonmobil |
vk.com/id446425943 |
P.19 |
2019 OUTLOOK FOR ENERGY | DEMAND |
|
|
|
RESIDENTIAL AND COMMERCIAL — PROJECTIONS
Household electricity up in non-OECD
Residential electricity intensity Megawatt hours per household per year
12 |
|
|
|
|
9 |
|
|
|
Middle East |
|
|
|
|
North America |
6 |
|
|
|
|
|
|
|
|
Europe |
3 |
|
|
|
China |
|
|
|
India |
|
|
|
|
|
|
|
|
|
|
Africa |
0 |
|
|
|
|
2000 |
2010 |
2020 |
2030 |
2040 |
Residential energy fuel use varies across regions
Quadrillion BTUs |
|
|
|
|
|
|
|
25 |
|
|
|
|
|
|
|
|
|
|
|
|
|
|
Other |
20 |
|
|
|
|
|
|
|
|
|
|
|
|
|
|
Electricity |
15 |
‘00 '17 '40 |
|
|
|
|
|
|
|
|
|
|
|
|
|
|
10 |
|
|
|
|
|
|
Natural gas |
|
|
|
|
|
|
|
LPG |
5 |
|
|
|
|
|
|
|
|
|
|
|
|
|
|
Biomass |
0 |
|
|
|
|
|
|
|
|
North |
Europe |
Africa |
Middle East |
China |
India |
Rest of World |
|
America |
|
|
|
|
|
|
•Residential electricity use is expected to rise about two-thirds by 2040 as a substantially increased middle class seeks to improve health, security and comfort at home
•The annual electricity use per household in non-OECD countries rises about 60 percent with residential electricity use in India and China expected to grow strongly, bringing electricity consumption per household close to the European average by 2040
•Electricity use per household in OECD nations will be stagnant or declining as more efficient appliances help limit electricity requirements
•Efficient buildings, appliances and consumer products lead to a decrease of residential demand in North America and Europe increasingly met by electricity
•More households, urbanization and rising living standards in developing nations lead to continued energy increases
•While most developing nations transition away from traditional biomass (such as wood and charcoal) with improved access to LPG, electricity and gas, Africa’s rising population and insufficient supplies of alternative sources increase its biomass use
Visit exxonmobil.com/energyoutlook |
Subscribe to energyfactor.com |
Follow @exxonmobil |
Follow facebook.com/exxonmobil |
vk.com/id446425943
INDUSTRIAL — PROJECTIONS
Almost half of the world’s energy use is dedicated to industrial activity
As the global middle class continues to grow, demand for durable products, appliances and consumable goods will increase. Without exception, industrial activities are required to manufacture these products and their components. Industrial activities, such as textile manufacture, car assembly or creation of construction materials, take place in almost all regions, and for all this activity energy is required.
Industry grows in emerging markets, like India, Southeast Asia, the Middle East and Africa. Industry also evolves in OECD nations as businesses and consumers strive to reduce their environmental impact by using energy
more efficiently.
Industrial growth takes energy. It also takes innovation. This Outlook anticipates technology advances, as well as the increasing shift toward cleaner sources of energy such as electricity and natural gas. The industry of the future will be more energy efficient and less carbon intensive than it is today.
|
EUROPE |
|
CHINA |
UNITED |
INDIA |
|
|
STATES |
|
|
AFRICA |
|
COLOMBIA |
|
|