

Barclays Oil Gas Weekly_watermark
.pdfvk.com/id446425943
Oil & Gas Weekly
Volatility means discipline
Three times within the past 10 days the Brent oil price has fallen seven percent. This volatility comes ahead of the G20 meeting later this week and the OPEC meeting on 6 December, reflecting fears of an oversupplied market. Whilst there are some fundamental reasons for the fall in oil prices – largely a mismatch between supply and demand as OPEC, Russia and US production grows with the impact to Iranian exports from sanctions not as bad as feared, we also see part of it driven by moves in speculator positions and the closing of hedge positions. The actions that OPEC and non-OPEC take in their upcoming meeting are likely to determine the nearer-term direction of the oil price, but it is likely that volatility will continue through the next 12 months given relatively little real spare capacity in the system. One important aspect of the increased volatility is that it is likely to reinforce the capital discipline mantra across the energy space with the focus maintained on reducing cash breakevens.
Volatility enhances discipline: The pullback in the oil price reminds us of the inherent volatility in the commodities market. At a point when the market was starting to be concerned over a higher oil price leading to a lapse of capital discipline, we see it now as reinforcing management plans to keep capex constrained. Sector cash breakevens are already in a $50-$60/bl range for most companies – down from levels above $90/bl just three years ago – with businesses consequently much better prepared for any downturn in crude than before.
Repsol – the right environment: In this environment of market volatility, we highlight Repsol as a key near-term beneficiary, with higher than average exposure to both US natural gas prices and refining margins. We rate the stock OW with a €19.5/sh price target.
Longer-term value in Equinor: In our report “Value in a lower carbon world” (26
November 2018) we outline our thoughts on the longer-term world of energy. Providing affordable, low-carbon, reliable energy to a growing population is one of the biggest challenges the world faces. Governments and investors alike are increasingly focused on achieving carbon emissions that limit global warming to below two degrees. Understandably this raises questions as to what role the energy stocks have in such a world. All our analysis suggests that the energy industry will have a key role in solving the low-carbon challenge and that aligning portfolios with a two-degree world should not, by itself, rule out holdings in the energy sector. This report assesses the environmental and technology strategies of the large European energy companies, two areas which we see as key to relative competitiveness over the next decade. Different companies should benefit in different ways from each of the themes we identify, but Equinor screens well across the board and we rate the shares Overweight with a NOK280/sh price target.
Barclays Capital Inc. and/or one of its affiliates does and seeks to do business with companies covered in its research reports. As a result, investors should be aware that the firm may have a conflict of interest that could affect the objectivity of this report. Investors should consider this report as only a single factor in making their investment decision.
This research report has been prepared in whole or in part by equity research analysts based outside the US who are not registered/qualified as research analysts with FINRA.
PLEASE SEE ANALYST CERTIFICATION(S) AND IMPORTANT DISCLOSURES BEGINNING ON PAGE 15.
CORE
Equity Research
27 November 2018
SECTOR UPDATE
Americas Integrated Oil
POSITIVE
Unchanged
European Integrated Oil & Refining
POSITIVE
Unchanged
European Oil & Gas: E&P
POSITIVE
Unchanged
European Oil Services & Drilling
POSITIVE
Unchanged
European Integrated Oil & Refining Lydia Rainforth, CFA
+44 (0)20 3134 6669 lydia.rainforth@barclays.com Barclays, UK
Joshua Stone
+44 (0)20 3134 6694 joshua.stone@barclays.com Barclays, UK
Danni Li
+44 (0)20 3134 5636 danni.li@barclays.com Barclays, UK
European Oil & Gas: E&P James Hosie
+44(0)20 7773 1682 james.hosie@barclays.com Barclays, UK
European Oil Services & Drilling Mick Pickup
+44 (0)20 3134 6695 mick.pickup@barclays.com Barclays, UK
Americas Integrated Oil Paul Y. Cheng, CFA
+1 212 526 1884 paul.cheng@barclays.com BCI, US
vk.com/id446425943
Barclays | Oil & Gas Weekly
Barclays Research Industries included in this report
Industry |
Industry view |
Author(s) |
|
|
|
|
|
European Integrated Oil & Refiners |
Positive |
Lydia Rainforth CFA, Josh Stone |
|
|
|
|
|
European E&Ps |
Positive |
James Hosie |
|
European Oil Services & Drilling |
Positive |
Mick Pickup |
|
|
|
|
|
Americas Integrated Oil |
Positive |
Paul Cheng CFA |
|
|
|
|
|
Events Calendar
2018
November
30 G20 Summit
December
01 |
G20 Summit |
06 |
OPEC meeting |
03-06 |
BP field trip |
Source: Company Data, Barclays Research
27 November 2018 |
2 |
vk.com/id446425943
Barclays | Oil & Gas Weekly
CONTENTS
CRUDE OIL PRICES............................................................................................ |
4 |
CRUDE OIL DATA.............................................................................................. |
5 |
REFINING MARGINS ......................................................................................... |
6 |
CRACK SPREADS ............................................................................................... |
7 |
NATURAL GAS PRICES..................................................................................... |
8 |
EXCHANGE RATES............................................................................................ |
9 |
SECTOR SHARE PRICE PERFORMANCE .................................................... |
10 |
SECTOR SHARE PRICE PERFORMANCE .................................................... |
11 |
INTEGRATEDS AND REFINERS..................................................................... |
12 |
OIL SERVICES ................................................................................................... |
13 |
E&PS ................................................................................................................... |
14 |
The data source for all charts and tables is “Company data, Barclays Research”, unless otherwise stated. Share prices are as of 16 November 2018 at market close, unless otherwise stated.
27 November 2018 |
3 |
vk.com/id446425943
Barclays | Oil & Gas Weekly
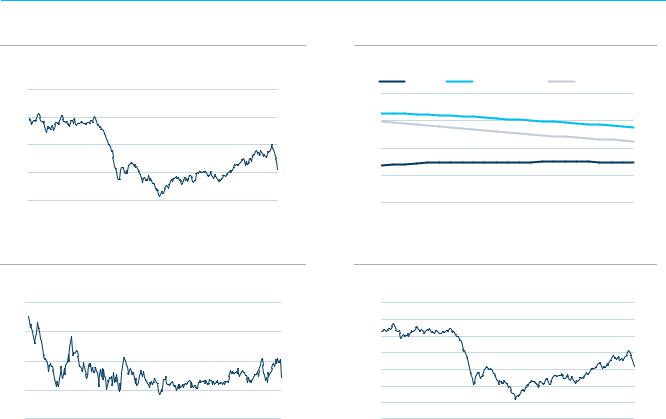
Crude oil prices
|
|
|
|
Crude - $/bl |
|
|
|
|
Date |
Brent |
WTI |
ANS |
Kern River |
Dubai |
OPEC |
WTI-Maya |
Brent-Urals |
19-Nov-18 |
62.3 |
53.7 |
63.7 |
61.6 |
62.7 |
63.5 |
(6.9) |
(0.1) |
12-Nov-18 |
65.8 |
57.0 |
66.9 |
65.2 |
66.9 |
66.7 |
(6.6) |
(0.1) |
05-Nov-18 |
70.7 |
61.6 |
71.4 |
69.6 |
70.8 |
70.9 |
(6.8) |
0.3 |
29-Oct-18 |
74.0 |
65.1 |
74.7 |
73.2 |
74.0 |
74.9 |
(5.9) |
0.6 |
Nov-18 |
66.3 |
57.4 |
67.3 |
65.5 |
66.8 |
67.0 |
(6.8) |
0.0 |
Oct-18 |
79.8 |
70.2 |
79.6 |
78.4 |
78.4 |
79.2 |
(4.7) |
1.2 |
Sep-18 |
78.9 |
70.1 |
78.0 |
77.4 |
77.0 |
77.1 |
1.5 |
0.8 |
Aug-18 |
73.2 |
67.9 |
74.8 |
72.8 |
72.2 |
72.2 |
4.8 |
0.8 |
4Q 2018 |
74.7 |
65.4 |
75.0 |
73.5 |
74.1 |
74.6 |
(5.5) |
0.7 |
3Q 2018 |
75.3 |
69.7 |
76.7 |
74.2 |
73.8 |
74.1 |
3.6 |
1.0 |
2Q 2018 |
74.6 |
68.0 |
74.8 |
73.0 |
71.5 |
71.9 |
5.9 |
1.3 |
1Q 2018 |
67.0 |
62.9 |
67.4 |
65.9 |
64.0 |
64.8 |
5.1 |
1.4 |
4Q 2017 |
61.4 |
55.4 |
61.3 |
61.1 |
59.1 |
59.4 |
2.2 |
0.7 |
3Q 2017 |
51.7 |
48.1 |
51.7 |
51.6 |
50.6 |
49.9 |
1.7 |
0.8 |
2018 |
72.7 |
66.6 |
73.3 |
71.5 |
70.5 |
71.0 |
3.1 |
1.1 |
2017 |
54.3 |
50.9 |
54.0 |
54.1 |
53.1 |
52.5 |
3.8 |
0.9 |
2016 |
44.1 |
43.3 |
42.3 |
45.0 |
41.3 |
40.8 |
6.8 |
1.4 |
2015 |
52.2 |
48.5 |
51.4 |
52.2 |
51.0 |
49.3 |
4.6 |
0.3 |
2014 |
99.3 |
93.4 |
98.4 |
97.1 |
97.1 |
96.7 |
7.4 |
1.2 |
2013 |
108.8 |
97.9 |
107.8 |
107.4 |
105.4 |
105.9 |
0.6 |
0.9 |
2012 |
112.1 |
94.3 |
110.9 |
111.9 |
109.1 |
109.6 |
(5.5) |
1.7 |
2011 |
111.0 |
95.1 |
109.6 |
112.4 |
106.1 |
107.6 |
(3.6) |
1.7 |
2010 |
79.7 |
79.5 |
78.9 |
82.8 |
78.1 |
77.5 |
9.2 |
1.4 |
2009 |
62.2 |
62.1 |
61.1 |
64.6 |
62.1 |
61.1 |
5.8 |
0.6 |
Source: Bloomberg, Datastream |
|
|
|
|
|
|
|
|
Brent, $/bl |
|
|
|
Futures curve, $/bl |
|
|
|
145 |
|
|
|
Spot |
1 month ago |
6 months ago |
|
|
|
|
85 |
|
|
|
|
|
|
|
|
|
|
|
|
115 |
|
|
|
75 |
|
|
|
|
|
|
|
|
|
|
|
85 |
|
|
|
65 |
|
|
|
|
|
|
|
|
|
|
|
55 |
|
|
|
55 |
|
|
|
|
|
|
|
|
|
|
|
25 |
|
|
|
45 |
|
|
|
Nov-12 Nov-13 Nov-14 Nov-15 |
Nov-16 |
Nov-17 |
Nov-18 |
Jan-19 May-19 |
Sep-19 |
Jan-20 |
May-20 Sep-20 |
Source: Bloomberg, Barclays Research |
|
|
|
Source: Datastream, Barclays Research |
|
||
Brent-WTI Spread, $/bl |
|
|
|
OPEC crude basket price, $/bl |
|
||
30 |
|
|
|
140 |
|
|
|
|
|
|
|
120 |
|
|
|
20 |
|
|
|
100 |
|
|
|
|
|
|
|
|
|
|
|
10 |
|
|
|
80 |
|
|
|
|
|
|
60 |
|
|
|
|
|
|
|
|
|
|
|
|
0 |
|
|
|
40 |
|
|
|
|
|
|
|
|
|
|
|
|
|
|
|
20 |
|
|
|
-10 |
|
|
|
0 |
|
|
|
Nov-12 Nov-13 Nov-14 Nov-15 |
Nov-16 |
Nov-17 |
Nov-18 |
Nov-12 Nov-13 Nov-14 Nov-15 |
Nov-16 Nov-17 Nov-18 |
||
Source: Bloomberg, Barclays Research |
|
|
|
Source: Bloomberg, Barclays Research |
|
||
27 November 2018 |
4 |
vk.com/id446425943
Barclays | Oil & Gas Weekly
Crude oil data
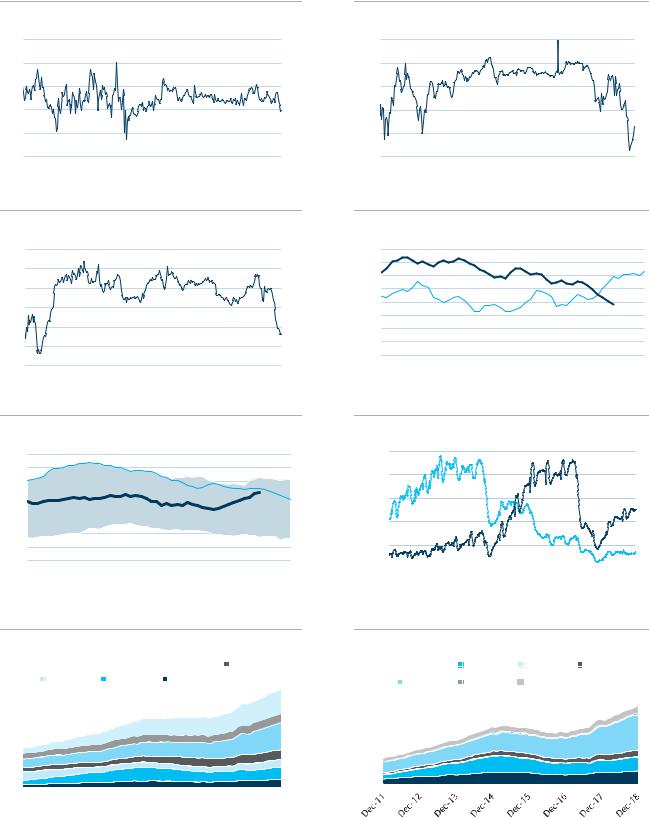
Brent-Urals Spread, $/bl
6
4
2
0
-2
-4
Nov-12 Nov-13 Nov-14 Nov-15 Nov-16 Nov-17 Nov-18
Source: Bloomberg, Barclays Research
WTIMaya Spread, $/bl
15
10
5
0 -5 -10
-15
Nov-12 Nov-13 Nov-14 Nov-15 Nov-16 Nov-17 Nov-18
Source: Bloomberg, Barclays Research
US crude oil inventories, mb
560
520
480
440
400
360
320
280
240
1 4 7 10 13 16 19 22 25 28 31 34 37 40 43 46 49 52
Week |
|
7 Year Range |
|
2017 |
|
2018 |
|
|
|
Source: Energy Information Administration (EIA), Barclays Research
US shale drilling productivity, b/d (production per rig)
24 |
|
|
Appalachia |
|
Anadarko |
|
|
Permian |
Niobara |
|
|
|
|
|
|||||||
|
|
|
|
|||||||
|
|
|
|
|
|
|
|
|
|
|
|
|
Haynesville |
|
Eagle Ford |
|
|
Bakken |
|
|
|
22 |
|
|
|
|
|
|
|
|||
|
|
|
|
|
|
|
|
|
|
|
20 |
|
|
|
|
|
|
|
|
|
|
|
|
|
|
|
|
|
|
|
|
|
18 |
|
|
|
|
|
|
|
|
|
|
|
|
|
|
|
|
|
|
|
|
|
16 |
|
|
|
|
|
|
|
|
|
|
|
|
|
|
|
|
|
|
|
|
|
14 |
|
|
|
|
|
|
|
|
|
|
|
|
|
|
|
|
|
|
|
|
|
12 |
|
|
|
|
|
|
|
|
|
|
|
|
|
|
|
|
|
|
|
|
|
10 |
|
|
|
|
|
|
|
|
|
|
|
|
|
|
|
|
|
|
|
|
|
8 |
|
|
|
|
|
|
|
|
|
|
|
|
|
|
|
|
|
|
|
|
|
6 |
|
|
|
|
|
|
|
|
|
|
|
|
|
|
|
|
|
|
|
|
|
4 |
|
|
|
|
|
|
|
|
|
|
|
|
|
|
|
|
|
|
|
|
|
2 |
|
|
|
|
|
|
|
|
|
|
|
|
|
|
|
|
|
|
|
|
|
0 |
|
|
|
|
|
|
|
|
|
|
|
|
|
|
|
|
|
|
|
|
|
Dec-11 Dec-12 Dec-13 Dec-14 |
Dec-15 Dec-16 |
Dec-17 Dec-18 |
||||||||
Source: Energy Information Administration (EIA), Barclays Research. *Marcellus and Utica are combined into Appalachia
WCS-WTI Spread, $/bl
0
-10
-20
-30
-40
-50
Nov-12 Nov-13 Nov-14 Nov-15 Nov-16 Nov-17 Nov-18
Source: Bloomberg, Barclays Research
US Non-commercial Paper Positions, mb
800
700
600
500
400
300
200
100
0
1 |
4 |
7 |
10 |
13 16 |
19 |
22 25 |
28 |
31 34 |
37 |
40 43 |
46 |
49 52 |
||
Week |
|
|
|
|
|
2017 |
|
|
2018 |
|
|
|
||
|
|
|
|
|
|
|
|
|
|
|||||
Source: Commitments of Traders reportUS CFTC, Barclays Research
Baker Hughes US Rotary Rig Count
2,000
1,600
1,200
800
400
0 |
|
|
|
|
|
|
|
|
|
|
|
|
|
|
|
|
|
Nov-02 |
Nov-06 |
Nov-10 |
Nov-14 |
Nov-18 |
||||
|
|
|
|
Gas rigs |
|
Oil rigs |
|
|
|
|
|
|
|
|
|
||
Source: Baker Hughes, Barclays Research
US shale oil production by play, mb/d
mb/d |
|
|
Bakken |
Eagle Ford |
Haynesville Niobara |
|
|
||||
|
|
||||
10 |
|
|
Permian |
Appalachia |
Anadarko |
|
|
|
|
|
|
8 |
|
|
|
|
|
|
|
|
|
|
|
6 |
|
|
|
|
|
|
|
|
|
|
|
4 |
|
|
|
|
|
|
|
|
|
|
|
2 |
|
|
|
|
|
|
|
|
|
|
|
0 |
|
|
|
|
|
|
|
|
|
|
Source: Energy Information Administration (EIA), Barclays Research. *Marcellus and Utica are combined into Appalachia
27 November 2018 |
5 |
vk.com/id446425943
Barclays | Oil & Gas Weekly
Refining margins
|
|
Refining margins - $/bl |
|
|
|
Date |
NW Europe |
US Gulf |
US W. Coast |
Singapore |
Med |
19-Nov-18 |
4.81 |
9.42 |
12.55 |
10.41 |
4.24 |
12-Nov-18 |
5.25 |
9.75 |
9.68 |
7.69 |
4.65 |
05-Nov-18 |
3.33 |
9.83 |
8.99 |
5.65 |
3.35 |
29-Oct-18 |
3.64 |
9.77 |
8.03 |
8.94 |
3.88 |
Nov-18 |
4.47 |
9.67 |
10.41 |
7.92 |
4.08 |
Oct-18 |
1.58 |
9.96 |
11.47 |
7.32 |
2.69 |
Sep-18 |
1.67 |
10.24 |
10.62 |
4.59 |
2.24 |
Aug-18 |
4.45 |
10.85 |
9.21 |
5.63 |
5.47 |
4Q 2018 |
2.66 |
9.85 |
11.07 |
7.54 |
3.21 |
3Q 2018 |
3.09 |
9.60 |
9.21 |
5.11 |
4.09 |
2Q 2018 |
2.11 |
9.85 |
13.16 |
4.94 |
3.41 |
1Q 2018 |
1.48 |
7.11 |
13.67 |
5.03 |
2.83 |
4Q 2017 |
3.00 |
10.20 |
13.40 |
4.91 |
3.88 |
3Q 2017 |
5.54 |
12.27 |
22.89 |
6.17 |
6.45 |
2018 |
2.30 |
9.02 |
11.85 |
5.45 |
3.40 |
2017 |
3.96 |
9.16 |
18.71 |
5.35 |
4.99 |
2016 |
2.38 |
5.29 |
21.04 |
4.36 |
4.09 |
2015 |
5.19 |
9.29 |
26.13 |
7.09 |
5.43 |
2014 |
1.04 |
5.72 |
11.39 |
5.32 |
1.80 |
2013 |
0.50 |
9.95 |
10.86 |
6.10 |
0.83 |
2012 |
2.61 |
18.66 |
11.31 |
8.45 |
3.59 |
2011 |
0.22 |
15.02 |
6.91 |
8.49 |
1.33 |
2010 |
1.42 |
1.29 |
8.37 |
4.66 |
2.46 |
2009 |
1.53 |
1.68 |
10.34 |
3.15 |
2.95 |
Source: Bloomberg, Barclays Research
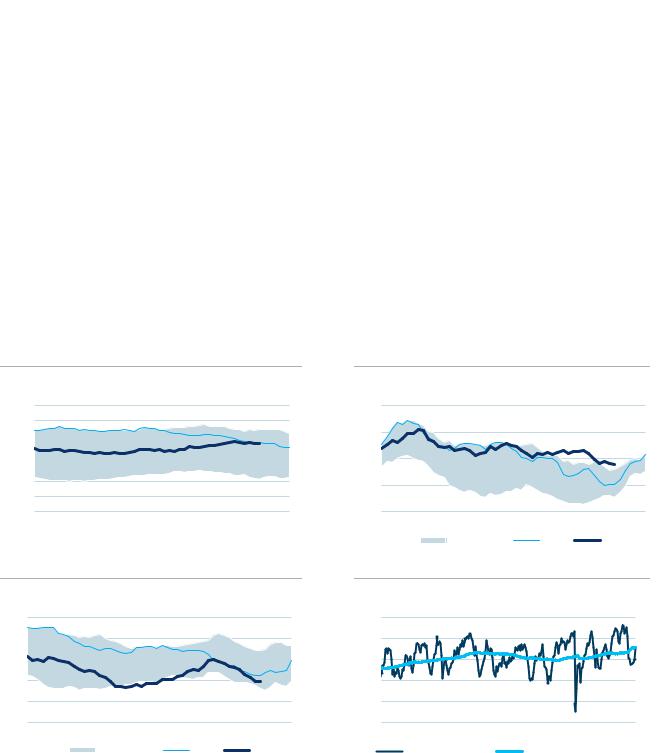
US total inventories, mb
1,500
1,400
1,300
1,200
1,100
1,000
900
800
1 4 7 10 13 16 19 22 25 28 31 34 37 40 43 46 49 52
Week |
|
7 Year Range |
|
2017 |
|
2018 |
|
|
|
Source: Energy Information Administration (EIA), Barclays Research
US distillate inventories, mb
180
160
140
120
100
80
1 4 7 10 13 16 19 22 25 28 31 34 37 40 43 46 49 52
Week |
7 Year Range |
2017 |
2018 |
|
Source: Energy Information Administration (EIA), Barclays Research
US gasoline inventories, mb
270
250
230
210
190
1 4 7 10 13 16 19 22 25 28 31 34 37 40 43 46 49 52
Week |
7 Year Range |
2017 |
2018 |
|
Source: Energy Information Administration (EIA), Barclays Research
US Refinery Utilisation, %
100 |
|
|
|
|
|
95 |
|
|
|
|
|
90 |
|
|
|
|
|
85 |
|
|
|
|
|
80 |
|
|
|
|
|
75 |
|
|
|
|
|
Nov-13 |
Nov-14 |
Nov-15 |
Nov-16 |
Nov-17 |
Nov-18 |
|
Refinery utilisation |
Rolling 12 month average |
|||
Source: Energy Information Administration (EIA), Barclays Research
27 November 2018 |
6 |
vk.com/id446425943
Barclays | Oil & Gas Weekly
Crack spreads
European Gasoline Brent Crack Spread, $/bl
30
20
10
0
-10
1 |
4 |
7 |
10 |
13 |
16 |
19 |
22 |
25 |
28 |
31 |
34 |
37 |
40 |
43 |
46 |
49 |
52 |
||
Week |
|
|
|
10 Year Range |
|
|
|
2017 |
|
|
|
2018 |
|
||||||
|
|
|
|
|
|
|
|
|
|
||||||||||
Source: Bloomberg, Barclays Research
European Naphtha Brent Crack Spread, $/bl
20
10
0
-10
-20
-30
1 4 7 10 13 16 19 22 25 28 31 34 37 40 43 46 49 52
Week |
|
10 Year Range |
|
2017 |
|
2018 |
|
|
|
Source: Bloomberg, Barclays Research
European LSFO Brent Crack Spread, $/bl
0
-10
-20
-30
-40
-50
1 4 7 10 13 16 19 22 25 28 31 34 37 40 43 46 49 52
Week |
|
10 Year Range |
|
2017 |
|
2018 |
|
|
|
Source: Bloomberg, Barclays Research
NW Europe refining margin, $/bl
15
10
5
0
-5
1 |
4 |
7 |
10 13 16 19 22 25 28 31 34 37 40 43 46 49 52 |
|||||
Week |
|
|
10 Year Range |
|
2017 |
|
2018 |
|
|
|
|
|
|||||
Source: Bloomberg, Barclays Research
European Diesel Brent Crack Spread, $/bl
40
30
20
10
0
-10
1 4 7 10 13 16 19 22 25 28 31 34 37 40 43 46 49 52
Week |
|
10 Year Range |
|
2017 |
|
2018 |
|
|
|
Source: Bloomberg, Barclays Research
European Kerosene Brent Crack Spread, $/bl
50
40
30
20
10
0
-10
1 4 7 10 13 16 19 22 25 28 31 34 37 40 43 46 49 52
Week |
|
10 Year Range |
|
2017 |
|
2018 |
|
|
|
Source: Bloomberg, Barclays Research
European HSFO Brent Crack Spread, $/bl
0 -10 -20 -30
-40
-50
-60
1 4 7 10 13 16 19 22 25 28 31 34 37 40 43 46 49 52
Week |
|
10 Year Range |
|
2017 |
|
2018 |
|
|
|
Source: Bloomberg, Barclays Research
Mediterranean refining margin, $/bl
15
10
5
0
-5
1 |
4 |
7 |
10 13 16 19 22 25 |
28 31 34 37 |
40 43 46 49 52 |
||||||
Week |
|
|
|
10 Year Range |
|
|
2017 |
|
|
2018 |
|
|
|
|
|
|
|
||||||
Source: Bloomberg, Barclays Research
27 November 2018 |
7 |

vk.com/id446425943
Barclays | Oil & Gas Weekly
Natural gas prices
|
|
|
Natural gas |
|
|
|
|
Henry Hub |
Rockies |
Russia |
UK-NBP |
Zee |
Singapore Spot LNG |
Date |
$/mBtu |
$/mBtu |
$/kcf |
p/therm |
p/therm |
$/mBtu |
19-Nov-18 |
4.50 |
6.00 |
- |
66.17 |
62.68 |
9.98 |
12-Nov-18 |
4.21 |
4.40 |
- |
67.85 |
67.10 |
9.79 |
05-Nov-18 |
3.59 |
3.54 |
- |
61.80 |
59.78 |
9.80 |
29-Oct-18 |
3.23 |
2.99 |
- |
62.96 |
61.17 |
9.76 |
Nov-18 |
4.10 |
4.65 |
- |
65.27 |
63.19 |
9.86 |
Oct-18 |
3.21 |
2.99 |
- |
66.28 |
65.25 |
10.19 |
Sep-18 |
2.89 |
2.32 |
7.82 |
73.76 |
72.81 |
11.19 |
Aug-18 |
2.92 |
2.54 |
7.61 |
63.63 |
62.94 |
10.47 |
4Q 2018 |
3.65 |
3.82 |
- |
65.78 |
64.22 |
10.02 |
3Q 2018 |
2.87 |
2.45 |
7.63 |
65.09 |
64.25 |
10.42 |
2Q 2018 |
2.84 |
2.04 |
7.22 |
54.19 |
53.92 |
8.58 |
1Q 2018 |
2.82 |
2.50 |
6.74 |
58.40 |
53.71 |
8.95 |
4Q 2017 |
2.88 |
2.66 |
6.07 |
52.71 |
50.58 |
9.29 |
3Q 2017 |
2.93 |
2.62 |
5.33 |
42.12 |
41.92 |
6.00 |
2018 |
2.99 |
2.60 |
7.20 |
60.42 |
58.55 |
9.44 |
2017 |
2.95 |
2.69 |
5.62 |
45.13 |
44.27 |
6.80 |
2016 |
2.50 |
2.33 |
4.45 |
34.79 |
33.81 |
5.42 |
2015 |
2.63 |
2.48 |
7.47 |
42.96 |
42.16 |
- |
2014 |
4.32 |
4.42 |
10.70 |
50.14 |
49.50 |
- |
2013 |
3.72 |
3.66 |
11.61 |
68.19 |
67.48 |
- |
2012 |
2.75 |
2.68 |
12.87 |
59.56 |
59.32 |
- |
2011 |
3.94 |
3.79 |
11.80 |
56.84 |
57.56 |
- |
2010 |
4.37 |
3.94 |
9.77 |
42.52 |
43.06 |
- |
2009 |
3.94 |
3.17 |
8.21 |
30.81 |
31.20 |
- |
Source: Bloomberg, Natural Gas Week, European Gas Markets, Indexmundi
EU gas storage utilisation rate, % |
|
US natural gas storage, bcf |
|
|
|
|
|
|
|
|
|
|
|||||||||||||
100 |
|
|
|
|
|
|
|
|
|
|
|
|
|
|
|
|
|
|
|
|
|
|
|
|
|
|
|
|
|
|
|
|
3,750 |
|
|
|
|
|
|
|
|
|
|
|
|
|
|
|
|
|
|
80 |
|
|
|
|
|
|
|
|
|
|
|
|
|
|
|
|
|
|
|
|
|
|
|
|
|
60 |
|
|
|
|
|
|
2,750 |
|
|
|
|
|
|
|
|
|
|
|
|
|
|
|
|
|
|
40 |
|
|
|
|
|
|
|
|
|
|
|
|
|
|
|
|
|
|
|
|
|
|
|
|
|
|
|
|
|
|
|
|
1,750 |
|
|
|
|
|
|
|
|
|
|
|
|
|
|
|
|
|
|
20 |
|
|
|
|
|
|
|
|
|
|
|
|
|
|
|
|
|
|
|
|
|
|
|
|
|
0 |
|
|
|
|
|
|
750 |
|
|
|
|
|
|
|
|
|
|
|
|
|
|
|
|
|
|
1 |
4 |
7 |
10 13 16 19 22 25 28 31 34 37 40 43 46 49 52 |
|
1 |
4 |
7 |
10 13 16 19 22 25 28 31 34 37 40 43 46 49 52 |
|||||||||||||||||
|
|
|
5 year Range |
2017 |
2018 |
|
Week |
|
|
|
7 Year Range |
|
|
2017 |
|
|
2018 |
|
|||||||
Source: Gas Infrastructure Europe (GIE), Barclays Research. Gas storage data |
Source: Energy Information Administration (EIA), Barclays Research |
|
|||||||||||||||||||||||
revised retrospectively by GIE. |
|
|
|
|
|
|
|
|
|
|
|
|
|
|
|
|
|
|
|
|
|
|
|||
UK & US natural gas futures curve |
|
Singapore spot LNG price, $/mbtu |
|
|
|
|
|
|
|
||||||||||||||||
GBp/therm |
|
UK natural gas (LHS) |
$/mbtu |
25 |
|
|
|
|
|
|
|
|
|
|
|
|
|
|
|
|
|
|
|||
|
US natural gas (RHS) |
|
|
|
|
|
|
|
|
|
|
|
|
|
|
|
|
|
|
||||||
70 |
|
|
|
5 |
|
|
|
|
|
|
|
|
|
|
|
|
|
|
|
|
|
|
|
||
|
|
|
|
|
20 |
|
|
|
|
|
|
|
|
|
|
|
|
|
|
|
|
|
|
||
65 |
|
|
|
|
|
|
|
|
|
|
|
|
|
|
|
|
|
|
|
|
|
|
|
|
|
|
|
|
|
|
|
|
|
|
|
|
|
|
|
|
|
|
|
|
|
|
|
|
|
|
|
60 |
|
|
|
|
|
4 |
15 |
|
|
|
|
|
|
|
|
|
|
|
|
|
|
|
|
|
|
|
|
|
|
|
|
|
|
|
|
|
|
|
|
|
|
|
|
|
|
|
|
|
|
||
55 |
|
|
|
|
|
3 |
|
|
|
|
|
|
|
|
|
|
|
|
|
|
|
|
|
|
|
50 |
|
|
|
|
|
10 |
|
|
|
|
|
|
|
|
|
|
|
|
|
|
|
|
|
|
|
|
|
|
|
|
|
|
|
|
|
|
|
|
|
|
|
|
|
|
|
|
|
|
|
||
45 |
|
|
|
|
|
2 |
5 |
|
|
|
|
|
|
|
|
|
|
|
|
|
|
|
|
|
|
40 |
|
|
|
|
|
|
|
|
|
|
|
|
|
|
|
|
|
|
|
|
|
|
|
||
|
|
|
|
|
|
|
|
|
|
|
|
|
|
|
|
|
|
|
|
|
|
|
|
|
|
35 |
|
|
|
|
|
1 |
0 |
|
|
|
|
|
|
|
|
|
|
|
|
|
|
|
|
|
|
30 |
|
|
|
|
|
|
|
|
|
|
|
|
|
|
|
|
|
|
|
|
|
|
|
||
|
|
|
|
|
|
1 |
4 |
7 |
10 |
13 |
16 |
19 |
22 |
25 |
28 |
31 |
34 |
37 |
40 |
43 |
46 |
49 |
52 |
||
25 |
|
|
|
|
|
0 |
|||||||||||||||||||
|
|
|
|
|
Week |
|
|
|
|
6 year range |
|
|
2017 |
|
|
2018 |
|
||||||||
Nov-18 |
|
|
Nov-19 |
Nov-20 |
Nov-21 |
Nov-22 |
|
|
|
|
|
|
|
|
|
|
|
|
|
|
|
|
|
|
|
Source: Datastream, Barclays Research |
|
|
Source: Datastream, Barclays Research |
|
|
|
|
|
|
|
|
|
|||||||||||||
27 November 2018 |
8 |

vk.com/id446425943
Barclays | Oil & Gas Weekly
Exchange rates
|
|
|
Exchange rates |
|
|
|
Date |
EUR/USD |
GBP/USD |
USD/RUB |
USD/NOK |
USD/CAD |
USD/AUS |
|
|
|
|
|
|
|
19-Nov-18 |
1.14 |
1.28 |
65.89 |
8.54 |
1.32 |
1.38 |
12-Nov-18 |
1.13 |
1.29 |
67.01 |
8.48 |
1.32 |
1.38 |
05-Nov-18 |
1.14 |
1.31 |
66.46 |
8.36 |
1.31 |
1.38 |
29-Oct-18 |
1.14 |
1.29 |
65.76 |
8.38 |
1.31 |
1.40 |
Nov-18 |
1.14 |
1.29 |
66.39 |
8.45 |
1.32 |
1.38 |
Oct-18 |
1.15 |
1.30 |
65.85 |
8.26 |
1.30 |
1.41 |
Sep-18 |
1.17 |
1.31 |
67.65 |
8.24 |
1.30 |
1.39 |
Aug-18 |
1.16 |
1.29 |
66.42 |
8.34 |
1.30 |
1.36 |
4Q 2018 |
1.14 |
1.30 |
66.12 |
8.35 |
1.31 |
1.39 |
3Q 2018 |
1.16 |
1.31 |
64.01 |
8.19 |
1.31 |
1.35 |
2Q 2018 |
1.19 |
1.36 |
62.00 |
8.02 |
1.29 |
1.32 |
1Q 2018 |
1.23 |
1.39 |
56.91 |
7.84 |
1.27 |
1.27 |
4Q 2017 |
1.18 |
1.33 |
58.43 |
8.17 |
1.27 |
1.30 |
3Q 2017 |
1.17 |
1.31 |
58.94 |
7.96 |
1.25 |
1.27 |
2018 |
1.18 |
1.34 |
62.26 |
8.10 |
1.29 |
1.33 |
2017 |
1.13 |
1.29 |
58.25 |
8.23 |
1.29 |
1.30 |
2016 |
1.11 |
1.35 |
67.01 |
8.40 |
1.33 |
1.35 |
2015 |
1.11 |
1.53 |
61.25 |
8.07 |
1.28 |
1.33 |
2014 |
1.33 |
1.63 |
38.55 |
6.51 |
1.11 |
1.12 |
2013 |
1.33 |
1.56 |
31.85 |
5.87 |
1.03 |
1.03 |
2012 |
1.29 |
1.59 |
31.12 |
5.82 |
1.00 |
0.97 |
2011 |
1.39 |
1.60 |
29.40 |
5.61 |
0.99 |
0.97 |
2010 |
1.33 |
1.55 |
30.37 |
6.05 |
1.03 |
1.09 |
2009 |
1.39 |
1.57 |
31.76 |
6.29 |
1.14 |
1.28 |
Source: Datastream
EUR/USD FX rate
1.6
1.5
1.4
1.3
1.2
1.1
1.0
Nov-11 Nov-12 Nov-13 Nov-14 Nov-15 Nov-16 Nov-17 Nov-18
Source: Datastream, Barclays Research
USD/RUB FX rate
100
80
60
40
20
0
Nov-11 Nov-12 Nov-13 Nov-14 Nov-15 Nov-16 Nov-17 Nov-18
GBP/USD FX rate
1.8
1.7
1.6
1.5
1.4
1.3
1.2
1.1
Nov-11 Nov-12 Nov-13 Nov-14 Nov-15 Nov-16 Nov-17 Nov-18
Source: Datastream, Barclays Research
USD/NOK FX rate
10.0
9.0
8.0
7.0
6.0
5.0
Nov-11 Nov-12 Nov-13 Nov-14 Nov-15 Nov-16 Nov-17 Nov-18
Source: Datastream, Barclays Research |
Source: Datastream, Barclays Research |
27 November 2018 |
9 |

vk.com/id446425943
Barclays | Oil & Gas Weekly
Sector share price performance
European Integrateds vs. European Market |
|
US Integrateds vs. US market |
|
|
|
|||||
130 |
|
|
|
|
|
110 |
|
|
|
|
120 |
|
|
|
|
|
105 |
|
|
|
|
|
|
|
|
|
|
|
|
|
|
|
110 |
|
|
|
|
|
100 |
|
|
|
|
|
|
|
|
|
|
|
|
|
|
|
|
|
|
|
|
|
95 |
|
|
|
|
100 |
|
|
|
|
|
90 |
|
|
|
|
|
|
|
|
|
|
|
|
|
|
|
90 |
|
|
|
|
|
85 |
|
|
|
|
|
|
|
|
|
|
|
|
|
|
|
80 |
|
|
|
|
|
80 |
|
|
|
|
Nov-17 |
Jan-18 Mar-18 May-18 |
Jul-18 |
Sep-18 |
Nov-18 |
Nov-17 |
Jan-18 Mar-18 May-18 |
Jul-18 |
Sep-18 |
Nov-18 |
|
GEM Integrateds vs. GEM market |
|
|
|
European E&P vs. European market |
|
|
||||
130 |
|
|
|
|
|
160 |
|
|
|
|
125 |
|
|
|
|
|
140 |
|
|
|
|
120 |
|
|
|
|
|
|
|
|
|
|
|
|
|
|
|
|
|
|
|
|
|
115 |
|
|
|
|
|
120 |
|
|
|
|
|
|
|
|
|
|
|
|
|
|
|
110 |
|
|
|
|
|
|
|
|
|
|
105 |
|
|
|
|
|
100 |
|
|
|
|
|
|
|
|
|
|
|
|
|
|
|
100 |
|
|
|
|
|
80 |
|
|
|
|
95 |
|
|
|
|
|
|
|
|
|
|
|
|
|
|
|
|
|
|
|
|
|
90 |
|
|
|
|
|
60 |
|
|
|
|
Nov-17 |
Jan-18 Mar-18 May-18 |
Jul-18 |
Sep-18 |
Nov-18 |
Nov-17 |
Jan-18 Mar-18 May-18 |
Jul-18 |
Sep-18 |
Nov-18 |
|
US Refiners vs. US market |
|
|
|
European Refiners vs. European market |
|
|
||||
125 |
|
|
|
|
|
115 |
|
|
|
|
120 |
|
|
|
|
|
110 |
|
|
|
|
115 |
|
|
|
|
|
105 |
|
|
|
|
|
|
|
|
|
|
|
|
|
|
|
110 |
|
|
|
|
|
100 |
|
|
|
|
105 |
|
|
|
|
|
|
|
|
|
|
|
|
|
|
|
95 |
|
|
|
|
|
100 |
|
|
|
|
|
|
|
|
|
|
|
|
|
|
|
|
|
|
|
|
|
95 |
|
|
|
|
|
90 |
|
|
|
|
|
|
|
|
|
|
|
|
|
|
|
90 |
|
|
|
|
|
85 |
|
|
|
|
85 |
|
|
|
|
|
80 |
|
|
|
|
Nov-17 |
Jan-18 |
Mar-18 May-18 |
Jul-18 |
Sep-18 |
Nov-18 |
Nov-17 |
Jan-18 Mar-18 May-18 |
Jul-18 |
Sep-18 |
Nov-18 |
US Services vs. US market |
|
|
|
European Services vs. European market |
|
|
||||
130 |
|
|
|
|
|
130 |
|
|
|
|
120 |
|
|
|
|
|
120 |
|
|
|
|
|
|
|
|
|
|
|
|
|
|
|
110 |
|
|
|
|
|
110 |
|
|
|
|
|
|
|
|
|
|
|
|
|
|
|
100 |
|
|
|
|
|
|
|
|
|
|
90 |
|
|
|
|
|
100 |
|
|
|
|
|
|
|
|
|
|
|
|
|
|
|
80 |
|
|
|
|
|
90 |
|
|
|
|
|
|
|
|
|
|
|
|
|
|
|
70 |
|
|
|
|
|
80 |
|
|
|
|
Nov-17 |
Jan-18 |
Mar-18 May-18 |
Jul-18 |
Sep-18 |
Nov-18 |
Nov-17 |
Jan-18 Mar-18 May-18 |
Jul-18 |
Sep-18 |
Nov-18 |
Source: Datastream, Barclays Research
The European Market is the Eurostoxx, the European Integrateds and the Services are the corresponding FTSE 300 indices. The US market is the S&P500 and US Integrateds, Refiners and Services are the corresponding sector indices. The Barclays European Refining Index is calculated using arithmetic averages for companies under coverage. The Barclays E&Ps Index is calculated based on an arithmetic average across our coverage. The GEM market is bespoke Global Emerging Markets index from Datastream and the GEM Integrateds index is the corresponding sector index.
27 November 2018 |
10 |