

- •The Week Ahead
- •The Long View
- •Ratings Round-Up
- •Market Data
- •Moody’s Capital Markets Research recent publications
- •Weekly Market Outlook Contributors:
- •Credit Markets Review and Outlook
- •Only the Baa3 Spread Was Wider than Its Long-Term Median as of the End of June
- •Corporate Bond Yields and EDFs Provide the Basis for Market Implied Ratings
- •Bond Implied Ratings Offer a Somewhat Negative View of Baa3 Credits
- •EDF-Derived Market Implied Ratings Offered a More Positive View of Baa3 Credits
- •Despite Thinner Spread since End of 2018, Bond Implied Ratings of Baa3 Group Softens
- •The Week Ahead – U.S., Europe, Asia-Pacific
- •Perception versus reality
- •Looking ahead
- •The key data next week include June retail sales, industrial production, business inventories, consumer confidence and jobless claims.
- •EUROPE
- •Asia-Pacific
- •The Long View
- •Credit spreads
- •The recent high-yield bond spread of 421 bp is thinner than what is suggested by both the accompanying long-term Baa industrial company bond yield spread of 186 bp but is wider than what ordinarily accompanies the recent VIX of 12.9 points.
- •Defaults
- •US CORPORATE BOND ISSUANCE
- •US Economic Outlook
- •United Kingdom
- •Asia Pacific
- •china
- •Japan
- •Ratings Round-Up
- •Moody’s Capital Markets Research recent publications

vk.com/id446425943 |
CAPITAL MARKETS RESEARCH |
|
Moody’s Capital Markets Research recent publications
Below-Trend Spreads Bank on Profits Growth, Lower Rates and Healthy Equities (Capital Markets Research)
Global Collapse by Bond Yields Stems from Worldwide Slowdown (Capital Markets Research)
Borrowing Restraint Likely Despite Lower Interest Rates (Capital Markets Research)
The Fed Cured 1998's Yield Curve Inversion (Capital Markets Research)
Extended Yield Curve Inversion Would Presage Wide Spreads and Many Defaults (Capital Markets Research) Business Debt's Mild Rise Differs Drastically from 2002-2007's Mortgage Surge (Capital Markets Research) Earnings Slump Would Unmask Dangers of High Leverage (Capital Markets Research)
Credit May Again Outshine Equities at Divining Markets' Near-Term Path (Capital Markets Research)
Not Even the Great Depression Could Push the Baa Default Rate Above 2% (Capital Markets Research) Benign Default Outlook Implies Profits Will Outrun Corporate Debt (Capital Markets Research)
Upside Risks to the U.S. Economy (Capital Markets Research)
Outstandings and Rating Changes Supply Radically Different Default Outlooks (Capital Markets Research) High Leverage Offset by Ample Coverage of Net Interest Expense (Capital Markets Research)
Subdued Outlook for Revenues and Profits Portend Lower Interest Rates (Capital Markets Research) Fed Will Cut Rates If 10-Year Yield Breaks Under 2.4% (Capital Markets Research)
Riskier Outlook May Slow Corporate Debt Growth in 2019 (Capital Markets Research)
Replay of Late 1998's Drop by Interest Rates May Materialize (Capital Markets Research)
High-Yield Might Yet Be Challenged by a Worsened Business Outlook (Capital Markets Research)
Default Outlook Again Defies Unmatched Ratio of Corporate Debt to GDP (Capital Markets Research) Equity Analysts' Confidence Contrasts with Economists' Skepticism
Fed's Pause May Refresh a Tiring Economic Recovery (Capital Markets Research)
Rising Default Rate May be Difficult to Cap (Capital Markets Research)
Baa-Grade Credits Dominate U.S. Investment-Grade Rating Revisions (Capital Markets Research)
Upper-Tier Ba Rating Comprises Nearly Half of Outstanding High-Yield Bonds (Capital Markets Research)
Stabilization of Equities and Corporates Requires Treasury Bond Rally (Capital Markets Research)
High Leverage Will Help Set Benchmark Interest Rates (Capital Markets Research)
Medium-Grade's Worry Differs from High-Yield's Complacency (Capital Markets Research) Slower Growth amid High Leverage Lessens Upside for Interest Rates (Capital Markets Research) Core Profit's Positive Outlook Lessens Downside Risk for Credit (Capital Markets Research)
Unprecedented Amount of Baa-Grade Bonds Menaces the Credit Outlook (Capital Markets Research) Gridlock Stills Fiscal Policy and Elevates Fed Policy (Capital Markets Research)
Navigating Choppy Markets: Safety-First Equity Strategies Based on Credit Risk Signals Net Stock Buybacks and Net Borrowing Have Yet to Alarm (Capital Markets Research)
19 |
JULY 11, 2019 |
CAPITAL MARKETS RESEARCH / MARKET OUTLOOK / MOODYS.COM |

vk.com/id446425943 |
CAPITAL MARKETS RESEARCH |
|
To order reprints of this report (100 copies minimum), please call 212.553.1658.
Report Number: 1185076 |
Contact Us |
|
|
|
Americas: |
1.212.553.4399 |
|
|
Europe: |
+44 (0) 20.7772.5588 |
|
Editor |
|||
|
|
||
Reid Kanaley |
Asia: |
813.5408.4131 |
|
help@economy.com |
|
|
20 |
JULY 11, 2019 |
CAPITAL MARKETS RESEARCH / MARKET OUTLOOK / MOODYS.COM |

vk.com/id446425943 |
CAPITAL MARKETS RESEARCH |
|
© 2019 Moody’s Corporation, Moody’s Investors Service, Inc., Moody’s Analytics, Inc. and/or their licensors and affiliates (collectively, “MOODY’S”). All rights reserved.
CREDIT RATINGS ISSUED BY MOODY'S INVESTORS SERVICE, INC. AND ITS RATINGS AFFILIATES (“MIS”) ARE MOODY’S CURRENT OPINIONS OF THE RELATIVE FUTURE CREDIT RISK OF ENTITIES, CREDIT COMMITMENTS, OR DEBT OR DEBT-LIKE SECURITIES, AND MOODY’S PUBLICATIONS MAY INCLUDE MOODY’S CURRENT OPINIONS OF THE RELATIVE FUTURE CREDIT RISK OF ENTITIES, CREDIT COMMITMENTS, OR DEBT OR DEBT-LIKE SECURITIES. MOODY’S DEFINES CREDIT RISK AS THE RISK THAT AN ENTITY MAY NOT MEET ITS CONTRACTUAL FINANCIAL OBLIGATIONS AS THEY COME DUE AND ANY ESTIMATED FINANCIAL LOSS IN THE EVENT OF DEFAULT OR IMPAIRMENT. SEE MOODY’S RATING SYMBOLS AND DEFINITIONS PUBLICATION FOR INFORMATION ON THE TYPES OF CONTRACTUAL FINANCIAL OBLIGATIONS ADDRESSED BY MOODY’S RATINGS. CREDIT RATINGS DO NOT ADDRESS ANY OTHER RISK, INCLUDING BUT NOT LIMITED TO: LIQUIDITY RISK, MARKET VALUE RISK, OR PRICE VOLATILITY. CREDIT RATINGS AND MOODY’S OPINIONS INCLUDED IN MOODY’S PUBLICATIONS ARE NOT STATEMENTS OF CURRENT OR HISTORICAL FACT. MOODY’S PUBLICATIONS MAY ALSO INCLUDE QUANTITATIVE MODEL-BASED ESTIMATES OF CREDIT RISK AND RELATED OPINIONS OR COMMENTARY PUBLISHED BY MOODY’S ANALYTICS, INC. CREDIT RATINGS AND MOODY’S PUBLICATIONS DO NOT CONSTITUTE OR PROVIDE INVESTMENT OR FINANCIAL ADVICE, AND CREDIT RATINGS AND MOODY’S PUBLICATIONS ARE NOT AND DO NOT PROVIDE RECOMMENDATIONS TO PURCHASE, SELL, OR HOLD PARTICULAR SECURITIES. NEITHER CREDIT RATINGS NOR MOODY’S PUBLICATIONS COMMENT ON THE SUITABILITY OF AN INVESTMENT FOR ANY PARTICULAR INVESTOR. MOODY’S ISSUES ITS CREDIT RATINGS AND PUBLISHES MOODY’S PUBLICATIONS WITH THE EXPECTATION AND UNDERSTANDING THAT EACH INVESTOR WILL, WITH DUE CARE, MAKE ITS OWN STUDY AND EVALUATION OF EACH SECURITY THAT IS UNDER CONSIDERATION FOR PURCHASE, HOLDING, OR SALE.
MOODY’S CREDIT RATINGS AND MOODY’S PUBLICATIONS ARE NOT INTENDED FOR USE BY RETAIL INVESTORS AND IT WOULD BE RECKLESS AND INAPPROPRIATE FOR RETAIL INVESTORS TO USE MOODY’S CREDIT RATINGS OR MOODY’S PUBLICATIONS WHEN MAKING AN INVESTMENT DECISION. IF IN DOUBT YOU SHOULD CONTACT YOUR FINANCIAL OR OTHER PROFESSIONAL ADVISER.
ALL INFORMATION CONTAINED HEREIN IS PROTECTED BY LAW, INCLUDING BUT NOT LIMITED TO, COPYRIGHT LAW, AND NONE OF SUCH INFORMATION MAY BE COPIED OR OTHERWISE REPRODUCED, REPACKAGED, FURTHER TRANSMITTED, TRANSFERRED, DISSEMINATED, REDISTRIBUTED OR RESOLD, OR STORED FOR SUBSEQUENT USE FOR ANY SUCH PURPOSE, IN WHOLE OR IN PART, IN ANY FORM OR MANNER OR BY ANY MEANS WHATSOEVER, BY ANY PERSON WITHOUT MOODY’S PRIOR WRITTEN CONSENT.
CREDIT RATINGS AND MOODY’S PUBLICATIONS ARE NOT INTENDED FOR USE BY ANY PERSON AS A BENCHMARK AS THAT TERM IS DEFINED FOR REGULATORY PURPOSES AND MUST NOT BE USED IN ANY WAY THAT COULD RESULT IN THEM BEING CONSIDERED A BENCHMARK.
All information contained herein is obtained by MOODY’S from sources believed by it to be accurate and reliable. Because of the possibility of human or mechanical error as well as other factors, however, all information contained herein is provided “AS IS” without warranty of any kind. MOODY'S adopts all necessary measures so that the information it uses in assigning a credit rating is of sufficient quality and from sources MOODY'S considers to be reliable including, when appropriate, independent third-party sources. However, MOODY’S is not an auditor and cannot in every instance independently verify or validate information received in the rating process or in preparing the Moody’s publications.
To the extent permitted by law, MOODY’S and its directors, officers, employees, agents, representatives, licensors and suppliers disclaim liability to any person or entity for any indirect, special, consequential, or incidental losses or damages whatsoever arising from or in connection with the information contained herein or the use of or inability to use any such information, even if MOODY’S or any of its directors, officers, employees, agents, representatives, licensors or suppliers is advised in advance of the possibility of such losses or damages, including but not limited to: (a) any loss of present or prospective profits or (b) any loss or damage arising where the relevant financial instrument is not the subject of a particular credit rating assigned by MOODY’S.
To the extent permitted by law, MOODY’S and its directors, officers, employees, agents, representatives, licensors and suppliers disclaim liability for any direct or compensatory losses or damages caused to any person or entity, including but not limited to by any negligence (but excluding fraud, willful misconduct or any other type of liability that, for the avoidance of doubt, by law cannot be excluded) on the part of, or any contingency within or beyond the control of, MOODY’S or any of its directors, officers, employees, agents, representatives, licensors or suppliers, arising from or in connection with the information contained herein or the use of or inability to use any such information.
NO WARRANTY, EXPRESS OR IMPLIED, AS TO THE ACCURACY, TIMELINESS, COMPLETENESS, MERCHANTABILITY OR FITNESS FOR ANY PARTICULAR PURPOSE OF ANY CREDIT RATING OR OTHER OPINION OR INFORMATION IS GIVEN OR MADE BY MOODY’S IN ANY FORM OR MANNER WHATSOEVER.
Moody’s Investors Service, Inc., a wholly-owned credit rating agency subsidiary of Moody’s Corporation (“MCO”), hereby discloses that most issuers of debt securities (including corporate and municipal bonds, debentures, notes and commercial paper) and preferred stock rated by Moody’s Investors Service, Inc. have, prior to assignment of any rating, agreed to pay to Moody’s Investors Service, Inc. for ratings opinions and services rendered by it fees ranging from $1,000 to approximately $2,700,000. MCO and MIS also maintain policies and procedures to address the independence of MIS’s ratings and rating processes. Information regarding certain affiliations that may exist between directors of MCO and rated entities, and between entities who hold ratings from MIS and have also publicly reported to the SEC an ownership interest in MCO of more than 5%, is posted annually at www.moodys.com under the heading “Investor Relations — Corporate Governance — Director and Shareholder Affiliation Policy.”
Additional terms for Australia only: Any publication into Australia of this document is pursuant to the Australian Financial Services License of MOODY’S affiliate, Moody’s Investors Service Pty Limited ABN 61 003 399 657AFSL 336969 and/or Moody’s Analytics Australia Pty Ltd ABN 94 105 136 972 AFSL 383569 (as applicable). This document is intended to be provided only to “wholesale clients” within the meaning of section 761G of the Corporations Act 2001. By continuing to access this document from within Australia, you represent to MOODY’S that you are, or are accessing the document as a representative of, a “wholesale client” and that neither you nor the entity you represent will directly or indirectly disseminate this document or its contents to “retail clients” within the meaning of section 761G of the Corporations Act 2001. MOODY’S credit rating is an opinion as to the creditworthiness of a debt obligation of the issuer, not on the equity securities of the issuer or any form of security that is available to retail investors.
Additional terms for Japan only: Moody's Japan K.K. (“MJKK”) is a wholly-owned credit rating agency subsidiary of Moody's Group Japan G.K., which is wholly-owned by Moody’s Overseas Holdings Inc., a wholly-owned subsidiary of MCO. Moody’s SF Japan K.K. (“MSFJ”) is a wholly-owned credit rating agency subsidiary of MJKK. MSFJ is not a Nationally Recognized Statistical Rating Organization (“NRSRO”). Therefore, credit ratings assigned by MSFJ are Non-NRSRO Credit Ratings. Non-NRSRO Credit Ratings are assigned by an entity that is not a NRSRO and, consequently, the rated obligation will not qualify for certain types of treatment under U.S. laws. MJKK and MSFJ are credit rating agencies registered with the Japan Financial Services Agency and their registration numbers are FSA Commissioner (Ratings) No. 2 and 3 respectively.
MJKK or MSFJ (as applicable) hereby disclose that most issuers of debt securities (including corporate and municipal bonds, debentures, notes and commercial paper) and preferred stock rated by MJKK or MSFJ (as applicable) have, prior to assignment of any rating, agreed to pay to MJKK or MSFJ (as applicable) for ratings opinions and services rendered by it fees ranging from JPY125,000 to approximately JPY250,000,000.
MJKK and MSFJ also maintain policies and procedures to address Japanese regulatory requirements.
21 |
JULY 11, 2019 |
CAPITAL MARKETS RESEARCH / MARKET OUTLOOK / MOODYS.COM |

vk.Investingcom/id446425943 in emerging markets
A monthly guide to investing in emerging market financial assets
June 2019
29 May 2019 – 5:00 pm GMT
Chief Investment Office GWM Investment Research
Tweet quakes and their aftershocks
Equities: |
Credit: |
Currencies: |
Focus: |
Economy: |
Stay invested |
Trade war back in |
Collect carry in a |
Argentina: |
The economics of |
|
focus |
measured way |
Political waters |
US-China trade |
|
|
|
stirred by |
tensions |
|
|
|
Kirchner's |
|
|
|
|
announcement |
|
This report has been prepared by UBS AG, UBS Financial Services Inc. (UBS FS), and UBS Switzerland AG.
Please see important disclaimers and disclosures at the end of the document.

vk.com/id446425943
Contents
Investing in emerging markets
Editors-in-Chief
Alejo Czerwonko
Michael Bolliger
Project management
Brennan Azevedo
Editors
Abe De Ramos
Editorial deadline
28 May 2019
Desktop Publishing
Srinivas Addugula*
Contact wmrfeedback@ubs.com
* An employee of Cognizant Group. Cognizant staff provides support services to UBS.
Editorial |
|
Tweet quakes and their aftershocks............................................................. |
3 |
Global investment views......................................................................... |
5 |
Emerging market investment strategy |
|
Shifting from growth assets to carry assets.................................................. |
6 |
Focus |
|
Argentina: Political waters stirred by Kirchner’s announcement.................... |
8 |
Economy |
|
The economics of US-China trade tensions.................................................. |
9 |
Equities |
|
Stay invested............................................................................................. |
11 |
USD bonds strategy |
|
Trade war back in focus............................................................................. |
12 |
Currencies |
|
Collect carry in a measured way................................................................ |
13 |
Emerging market electoral monitor...................................................... |
14 |
Emerging markets publications............................................................. |
16 |
Important disclosure
Please note there may be changes to our house view and tactical asset allocation strategies prior to the next edition of Investing in Emerging Markets. For all updated views, please refer to the latest UBS House View.
UBS CIO GWM June 2019 2

vk.com/id446425943
Editorial
Tweet quakes and their aftershocks
Mark Haefele |
Alejo Czerwonko, Ph.D. |
|
Chief Investment |
||
Strategist |
||
Officer |
||
|
April economic data gave cause for cautious optimism on emerging economies. GDP growth trackers started to point to an improvement from modest levels; aggregate purchasing managers’ indices continued to indicate expansion; and lending conditions showed signs of easing. But then, President Donald Trump made his early May tweets. The result: higher tariffs on USD 200bn of US imports of Chinese goods from 10% to 25%.
Since then, volatility in foreign exchange has remained surprisingly low and emerging market currencies have been resilient, down less than 1% since 3 May. Lower benchmark interest rates and slightly wider yield spreads have also helped USD-denominated bonds post flat returns over the same period. But emerging market stocks have lost 8.5% (although they are still up over 3% year-to-date).
Our baseline scenario continues to envision a trade truce between the US and China. We believe both parties have their own incentives to agree to a ceasefire. President Trump’s 2020 reelection bid would be better supported by a strong economy than one stifled by tariffs, and Beijing policymakers want to be able to refocus on the rebalancing of the Chinese economy. Beijing’s retaliation measures have so far been disproportionally smaller, and its trade leaders continue to show willingness to negotiate.
We need to acknowledge, however, that when world leaders play with fire, they could get burned. We thus assign a 30% probability to a breakdown in the trade negotiations. Tensions have already escalated beyond trade and broadened to China’s access to US technology, largely through the telecom networking giant Huawei. The US Department of Commerce is reportedly looking at 14 technology categories that could be subject to export and investment controls involving China. And domestic rhetoric and sentiment in China is turning sour. “If the US wants to negotiate, the door is always open; if the US wants to fight, we will fight to the last,” said a recent piece in Chinese state media that was quickly amplified on social networks.
Presidents Trump and Xi will have an opportunity to meet at the G20 summit in Japan at the end of June, but we think it is unlikely that they will shake hands on a deal there. We will be on the lookout for new deadlines the US might announce
about imposing 25% tariffs on an additional c. USD 300bn of Chinese goods. As we have seen from the NAFTA renegotiations, such deadlines could bring about progress at the eleventh hour, but also come with obvious risk. We will also watch for any potential monetary or fiscal easing by global policymakers in reaction to the trade uncertainty.
The increased risk of a breakdown in talks and likely bumpy negotiation process and elevated uncertainty from here has made us reassess our outlook on emerging markets. Their economic recovery has likely been pushed out, as we discuss in the Economy section of this report. Emerging market equities are attractively valued, in our view, and should benefit from our base case of a global recovery in the second half of the year, but the path will likely be bumpy, given the trade dispute.
Outside of the trade uncertainty, domestic developments are also important drivers of emerging market assets. As recently as last week, we have seen market-friendly electoral outcomes in some of the larger countries. In India, after six weeks of voting for the general election, Prime Minister Narendra Modi officially clinched a stronger-than-expected mandate. In Indonesia, the election commission confirmed the second mandate for President Joko following the vote in April. And in South Africa, the ruling ANC retained its absolute majority in the legislature, extending the term of President Cyril Ramaphosa. Meanwhile, Brazil’s pension reform remains on track for approval this year despite some disaccord between Congress and the new government of Jair Bolsonaro.
The political outliers remain Argentina and Turkey. In the former, former populist President Cristina Kirchner announced she will participate in the August primary elections, running as vice president to a presidential candidate she handpicked. We delve deeper into the implications of this development in the Focus section. We also expect the rerun of the mayoral election in Istanbul to exacerbate political uncertainty.
As we look forward, the US-China dispute will remain the overriding driver for emerging market assets until its resolution, so investors must be appropriately positioned. In our view, trade uncertainty increases the chance that growth and inflation stay muted and central banks stay accommodative – this seems apt for carry strategies. We therefore overweight a basket of equally weighted high-yielding emerging market
UBS CIO GWM June 2019 3

vk.com/id446425943
Editorial
currencies (Indonesian rupiah, Indian rupee, South African rand) against a basket of low-yielding, high-beta ones (Australian, New Zealand, and Taiwan dollars). Our selection of currencies in the short basket is designed to mitigate the risk that a further escalation in trade tensions would represent for long positions in high-carry currencies.
We also see long-term value in USD-denominated emerging market bonds. For a historical understanding of this asset class, a recent NBER research paper examining 200 years of data shows that, notwithstanding defaults, wars, and global crises, a diversified portfolio of these bonds has delivered two centuries of attractive risk-adjusted returns.
We hope this report gives you the tools to navigate the tumultuous times in the emerging world and beyond.
Mark Haefele
Chief Investment Officer
Alejo Czerwonko
Strategist
UBS CIO GWM June 2019 4
vk.com/id446425943
Global investment views
Asset allocation
In our base case, global growth should stabilize in the second half of the year. However, the rhetoric around US-China trade has deteriorated recently, raising downside risk for the global economy and financial markets. In our base case, we expect a USChina trade deal or truce over the next six months, though only after a bumpy negotiation process that potentially leads to spikes in market volatility. In a scenario of prolonged uncertainty with lower consumer confidence and slowing investments, we see risk of the global economy growing below trend rather than above it. We recommend an overweight to equities, while managing downside risks through an overweight to long-duration Treasuries.
Bonds
We continue to hold an overweight to US long-duration Treasuries, which should help protect the portfolio against unanticipated equity market weakness. This month we closed our overweight to emerging market USD sovereign bonds. The spreads on emerging market bonds have remained resilient even as trade tensions have escalated, but spreads are likely to widen from here should additional tariffs raise concerns around the global growth outlook.
Equities
We overweight emerging market and Japanese equities versus US government bonds. We believe EM and Japan are set to play catch-up, having been the weakest equity markets so far in 2019. Since the start of the year, Japanese and EM stocks are both up about 3%, compared to nearly 12% for global equities and almost 14% for the S&P 500. The rising trade tensions between the US and China has had a more adverse effect so far on EM and Japan. Uncertainty about the impact of trade negotiations on global growth is likely to weigh on sentiment in the near term. But assuming the risk scenarios we are monitoring do not materialize, we believe EM and Japanese equities offer the best upside. Both are heavily geared to the global cycle and improvements in China‘s growth, and we don’t think either have priced in a macro recovery, whereas US equities have already priced in the recent improvement in economic data.
Foreign exchange
With our FX strategy we add a basket of EM currencies (South African rand, Indian rupee, Indonesian rupiah) vs developed market currencies (Australian dollar, New Zealand dollar, Taiwanese dollar) to harvest the interest rate advantage without being too strongly exposed to US-China trade tensions and other global risk-on vs. risk-off considerations. We keep our short AUD vs long USD. The AUD is a cyclical currency that tends to suffer when risk aversion rises and foreign investors repatriate assets. Australia is also heavily exposed to Chinese trade flows, and with a slowing Australian economy we think the RBA may be preparing for a rate cut. We maintain our overweights in the Norwegian krone against the Canadian dollar and the Swiss franc, and our overweight in the euro vs the Swiss franc.
UBS CIO GWM June 2019 5

vk.com/id446425943
Emerging market investment strategy
Michael Bolliger
Head of EM Asset
Allocation
Shifting from growth assets to carry assets
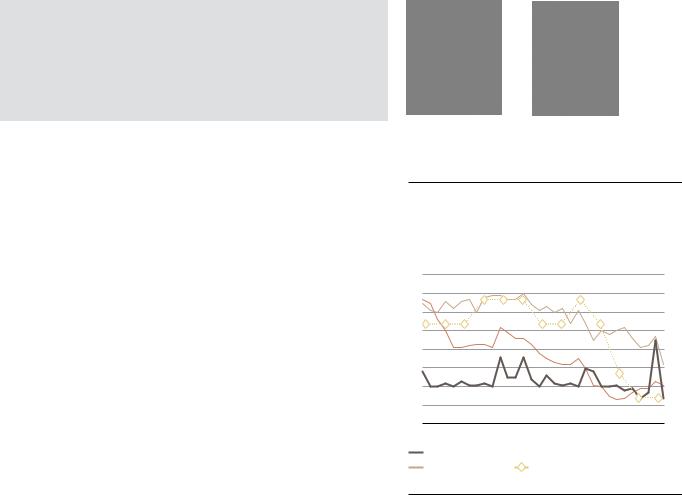
Renewed tensions between the US and China have been weighing on the global growth outlook and risk appetite lately. That’s not an environment for growth assets—such as emerging market equities and currencies—to do well. Emerging market stocks have corrected meaningfully (–8%) over the last month, followed by fixed income assets in local currency (around –2%). Sovereign and corporate bonds in US dollars were once more the bright spot, up roughly 0.5%, mainly thanks to the rally in US Treasury yields. If we look at the bigger picture, however, it’s worth recognizing that emerging market assets have had a good year so far, with all of them posting positive returns year-to-date.
US-China trade tensions to weigh on assets through various channels
The renewed escalation in the US-China trade conflict took markets by surprise; coming after a significant rally, it resulted in a meaningful correction. An imminent solution, such as an agreement at the G20 leaders’ summit in June, looks less and less likely, so we expect the prolonged period of uncertainty to weigh on sentiment.
A second channel of contagion is through more muted economic growth. While economic data for April showed signs of stabilization, the recovery started from a soft and fragile base. The renewed tensions will likely delay the recovery well into the second half of 2019 and lead to lower growth for the full year than previously expected. This lukewarm growth picture is not favorable for emerging market stocks, despite their more favorable valuations now. Absent a further escalation, however, we think the trade conflict will not lead to a sharp, global growth slowdown.
Beyond China: Turkey, Argentina, South Africa, Brazil, and India
Lately, Argentina and Turkey have brought back not-too-distant memories from 2018, when they were both exposed to market turmoil. Their situation remains challenging—both countries are in recession and struggling with rising unemployment and high inflation—although some things have improved, most notably their current account balances, which used to be their Achilles’ heel. We wouldn’t rule out more downside in local assets, especially in the run-up to their respective elections (23 June in Turkey; 27 October and 24 November in Argentina), but we think they are unlikely to trigger a broader emerging market crisis. Investors
Tactical asset allocation deviations from benchmark*
underweight |
neutral |
overweight |
Equities |
|
EM equities total |
|
|
|
||
|
|
|
|
|
EM Asia |
|
|
|
|
|
|
|
|
EM LatAm |
|
|
|
|
|
|
|
|
|
|
|
EM EMEA |
|
|
|
|
|
|
|
|
|
|
|
|
|
|
|
EM sovereign bonds (USD) |
|
|
|
|
|
USD |
|
EM sovereign bonds IG (USD) |
|
|
EM sovereign bonds HY (USD) |
|
|
in |
|
|
|
|
|
|
|
Bonds |
|
EM corporate bonds (USD) |
|
|
|
|
|
|
|
EM corporate bonds IG (USD) |
|
|
|
|
|
|
|
|
|
|
|
EM corporate bonds HY (USD) |
|
|
|
|
|
|
|
|
|
|
|
|
|
|
instruments |
EM currencies / money market |
|
currency |
|
||
Local |
|
EM government bonds |
|
|
|
||
|
|
|
|
|
|
|
|
EM in ation-linked bonds
new old
Most Preferred |
|
|
Least Preferred |
|
••China |
|
|
••Thailand |
|
••Malaysia |
|
|
••HongKong |
|
••High yield sovereigns |
|
••Investment grade sovereigns |
||
••GCC sovereign and quasi- |
|
|
||
sovereign bonds |
|
|
|
|
••Select LatAm corporates |
|
|
||
|
|
|
||
EM FX |
|
• Long ZAR vs. short USD |
||
|
||||
|
• Long basket of IDR, INR, ZAR vs. |
|||
Views |
|
|||
|
short basket AUD, NZD, TWD |
|||
|
|
|||
|
|
|
|
|
**Short-term recommendation (1–2 months) |
||||
Source: UBS, as of 23 May 2019. Green/Red arrows indicate new upgrades/downgrades. Grey up/down arrows indicate increase/reduction to existing positions.
* Please note that the bar charts show total portfolio preferences. Thus, it can be interpreted as the recommended deviation from the relevant portfolio benchmark for any given asset class and sub-asset class. These charts were formulated at the Emerging Markets Investment Committee. These preferences are designed for global investors. For models that are tailored to US investors, please see our flagship publication, UBS House View.
UBS CIO GWM June 2019 6
vk.com/id446425943
Emerging market investment strategy
should stay fairly selective and focus on short-duration instruments from higher-quality issuers. We caution against exposure to currencies like the Turkish lira, despite the high interest rates.
On the more positive side, we highlight South Africa, India, and Brazil, where reforms should support local assets. To be clear, the road to successful reforms is long and winding in all three countries. For South Africa and India, however, our conviction is high enough to increase exposure following their benign election outcomes. The victory for the ruling party and the incumbent head of state—the ANC and Cyril Ramaphosa in South Africa in March, and the BJP and Narendra Modi in India in May—bodes well for policy continuity and further reforms in both countries. For this reason, we favor the rand and selected South African bonds in US dollars, and have a favorable view of the Indian rupee. For Brazil, we still believe that pension reform will pass this year, but we are more cautious given increased uncertainty around politics (which could affect the pace of reforms), the economic recovery, and a more dovish central bank.
Three safety nets in place
The combination of prolonged uncertainty, slower growth, and idiosyncratic risks on one hand, and fair to attractive—but not cheap—valuations for emerging market assets on the other, provides a challenging backdrop for investors. Still, we see several safety nets in place that provide downside protection.
First, the Federal Reserve, the European Central Bank, and the Bank of Japan have tilted their policy stance from tightening to easing. This has relaxed financial conditions, which should help cushion the potential decline in economic growth.
Second, a weaker economy might bring forth more stimulus measures in China, according to policymakers. Compared to previous downturns, such measures are likely to be less generous and more targeted toward domestic sectors, but they should be enough to support market and business sentiment.
Third, we think that ultimately Presidents Donald Trump and Xi Jinping are interested in a resolution. Trump has shown he is sensitive to US stock market corrections, and the US will hold general elections about a year from now. We also think China would welcome a deal to ensure domestic stability.
How to invest in a measured way: FX carry, leverage in bonds
Investors can take shelter from higher volatility by moving to a more defensive allocation and adding emphasis on investment strategies that benefit from interest rate carry. In our asset allocation, we moved to a more defensive allocation by closing our overweight in emerging market hard currency sovereign bonds versus US government bonds.
Harvesting interest rate carry, however, should remain an attractive approach, if done in the right way. In the emerging markets, we have identified two opportunities:
First, we add a long/short basket of currencies for carry in our FX strategy. On the long side, we include selected high-yielding emerging market currencies: the Indonesian rupiah, the Indian rupee, and the South African rand. On the short side, we choose low-yielding, high-beta currencies: the Australian, New Zealand, and Taiwan dollars. The trade has one distinct objective: to harvest the interest rate carry in markets where we expect stable to stronger currencies over the next six months. We protect the downside of the basket by positioning in currencies that would cushion the impact from potential global headwinds like an escalation in the US-China trade spat.
Second, we advise investors to also consider leverage as an additional dimension of how to increase yields in emerging market bonds. Using leverage, investors can achieve similarly high yields with a better average credit quality and a lower duration risk. Moreover, we find that the low and flat US interest rate curve provides a favorable opportunity to lock in benign funding conditions. The bottom-up selection is of course important, especially for investors who follow a buy-and-hold strategy.
Finding Value in EM equities: Although valuation metrics still favor EM value stocks over growth stocks by a significant margin, the more uncertain global outlook and the large sectoral mismatch make it more difficult to find clear catalysts for value to outperform growth in emerging markets. As we no longer expect value stocks to systematically outperform growth peers, we are closing our investment theme and advise investors to move back to a benchmark allocation in emerging market equities. Investors looking for a thematic angle to their equity allocation should consider our “Sustainable value creation in emerging markets” investment theme.
UBS CIO GWM June 2019 7

vk.com/id446425943
Focus
Argentina: Political waters stirred by Kirchner’s announcement
For Argentina, the most likely outcome of the election is policy continuity toward fiscal consolidation, tight monetary policy, cooperation with the IMF, and being current on debt obligations. But Cristina Kirchner is running, and the risk of her coming back to power is real.
In emerging market politics, figures from an unpleasant past tend to find interesting ways to rear their heads back in the present. This happened on 18 May in Argentina, when former President Cristina Kirchner announced she will participate in the August primary elections, running as vice president to a presidential candidate she handpicked. Cristina succeeded her late husband Nestor in 2007, and the policies they espoused during their combined 12year rule rendered the Argentine economy vulnerable to a crisis that helped precipitate a recession and ultimately resulted in a sizable rescue package from the IMF in mid-2018. It is therefore no surprise for observers to wonder if Kirchnerism could come back.
We don’t think Kirchner’s surprise candidacy will garner much traction with the electorate. How many marginal voters, who would not tolerate her as a presidential candidate, would do so as a running-mate of a relative unknown, considering it is obvious she is running the show? It may be inevitable, however, that Kirchner’s announcement will rejig the competing coalitions, forcing a number of centrist candidates to pick a side. This is what we are watching most closely since it will have an impact on the race. By sharing the ticket with a moderate and a former critic of her own administration, Kirchner is likely trying to attract influential centrist Peronist politicians into her coalition. Will they join her? Most have distanced themselves from her, so it’s unlikely, though possible. The ruling Cambiemos is also attempting to lure non-Kirchner Peronists into its own umbrella.
With five months to go, the presidential race remains wide open. In our baseline scenario, however, we expect a number of the policies implemented by incumbent President Mauricio Macri to remain in place under his successor, and of course if he is reelected. These include fiscal consolidation efforts toward a primary surplus, tight monetary policy to rein in inflation, and a cooperative relationship with the IMF, as well as “willingness” to remain current on debt obligations.
Kirchner’s ticket does not represent continuity, in our view. We see her odds of winning around 35% given that she is facing severe corruption allegations; Argentine macroeconomic numbers are set to look less dire in the coming months; the global macro and political backdrop is supportive, with key partners the US, Brazil, and Chile all backing policy continuity; and the fact that incumbent presidents in Latin America have historically had a distinct advantage in winning reelections.
In our view, current Argentine asset prices overestimate the likelihood of a return to populism in the upcoming elections. We maintain our favorable view of a number of Argentine US dollar-denominated bonds, though we warn against making too large of an allocation to the country. Our favorable view on its electoral outlook is far from guaranteed, and Argentina’s still-large twin deficits leave its assets vulnerable to sharp changes in the external financial environment in the near term. Longer term, the country will continue to face economic and political challenges.
Alejo Czerwonko, Ph.D. Ronaldo Patah
Strategist Analyst
Table 1
Argentina Political Calendar
Date |
Election type |
12-Jun-19 |
Deadline - Electoral alliances |
22-Jun-19 |
Deadline - Presidential candidates |
11-Aug-19 |
Presidential - Primary |
|
Legislative - Primary |
13-Oct-19 |
First debate |
20-Oct-19 |
Second debate |
27-Oct-19 |
Presidential - General |
|
Legislative - General |
24-Nov-19 |
Presidential - Runoff |
Ongoing |
C. Kirchner's corruption trials |
"Source: Ministerio del Interior, Obras Públicas y Vivienda, La Nación, UBS. As of May 2019."
Argentina and Brazil tied at the hip
Economic and political channels keep the fates of both countries aligned with each other. Although Brazil’s economy is over three times the size of Argentina’s, the 50% collapse in Argentine imports of Brazilian cars since the beginning of the year has been weighing on the industry. We don’t expect meaningful improvements in this area before the October elections, and 2020 looks markedly different depending on who wins. At the same time, Brazil’s muted economic activity so far this year—we expect a mere 1.1% GDP growth for the whole year—isn’t contributing to a faster rebound in Argentina, either.
On the political front, Argentine presidential hopefuls are surely studying Brazil’s 2018 elections, during which social media campaigns proved significantly more effective than traditional channels. The outcome of the crucial social-security vote in Brazil may also have an impact on Argentina’s election results. Its approval may be perceived through a “reformist against populist” lens, and Brazilian and Argentine financial assets would fare well, which may have an effect on voter preferences. The Argentine electoral result will influence Brazilian politics as well. A populist win could revive the opposition voice in Brazil, which could raise the bar for reform approvals in the coming years. A reformist win, in turn, would reinforce the strength of the current government in Brazil, increasing its political power in the region.
UBS CIO GWM June 2019 8
vk.com/id446425943
Economy
The economics of US-China trade tensions
The nascent optimism about growth in emerging economies, led by in China, has again been clouded by the sudden escalation of US-China trade tensions. Our baseline scenario foresees some kind of agreement over our six-month tactical horizon, but we still expect lower growth and more policy stimulus in China. Other emerging economies will also be negatively affected, but we don’t expect growth to deteriorate significantly. We favor smart carry strategies in this environment.
China: Lower growth, more stimulus
The US upped the ante in its continuing trade conflict with China by increasing its tariffs from 10% to 25% on USD 200bn of Chinese imports. It also threatens to impose additional tariffs of 25% on the remaining USD 300bn worth Chinese goods its buys. In our base case, we expect a trade deal or truce over the next six months, though only after a bumpy negotiation process. With new tariffs already in place and uncertainty running high, we downgraded our growth outlook for the Chinese economy from 6.4% to 6.2% for 2019.
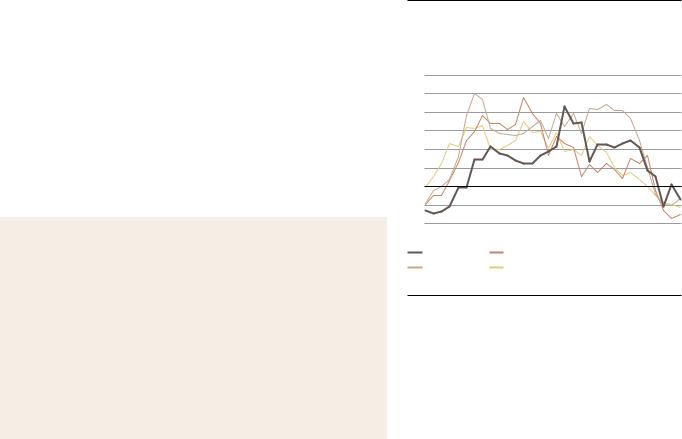
The renewed trade tensions come at a time when Chinese economic data for April failed to live up to the good March readings and the bet- ter-than-expected 1Q19 GDP. Manufacturing PMIs receded to levels just above 50; exports contracted compared to a year ago; and urban investments, industrial production, and retail sales growth came in weaker than feared. With the added weight of tariffs, China is likely to shift its policy bias in favor of easing again. The Chinese central bank may ease liquidity conditions through various channels, including additional cuts to the reserve requirement ratio for banks. Fiscal policy will likely become more expansive as well, with measures to stimulate consumption, speed up infrastructure spending, or further ease credit. This should help keep China’s economic growth running above 6%, despite the trade headwinds.
The situation changes if the US imposes the full suite of tariffs. Even with additional stimulus, Chinese GDP growth would likely fall below 6%. We assume a roughly 1-percentage-point decline in growth, with some uncertainty with regards to the potential multiplier impact on consumption and investment.
Other emerging markets: Affected by direct and indirect channels
A weaker China does not bode well for other emerging economies, specifically for export-driven countries with strong trade links to China, such as South Korea. Last year, the Korean economy grew 2.7%, the slowest pace in six years, marked by a decline in exports led mainly by semiconductors and other China-bound shipments. The fresh escalation of US-China trade tensions will also likely be felt by other export-oriented Asian economies that had shown signs of improvement toward the end of 1Q19. Accordingly, we have lowered our 2019 GDP forecasts for some economies, including Taiwan and Singapore.
Meanwhile, commodity exporters will feel the pinch if China’s hunger for raw materials weakens. And even among economies that have no meaningful direct links to China, softer risk sentiment could expose the external vulnerabilities of those that have high current account deficits or weak bud-
Tilmann Kolb |
Xingchen Yu |
Analyst |
Strategist |
Figure 1
Latest Chinese data have not sustained recent gains
Industrial production, retail sales, urban investment, and GDP growth (in % y/y)
12 |
6.9 |
11 |
6.8 |
|
|
10 |
|
9 |
6.7 |
|
|
8 |
6.6 |
7 |
6.5 |
|
|
6 |
|
5 |
6.4 |
|
|
4 |
6.3 |
Mar-16 Sep-16 Mar-17 Sep-17 Mar-18 Sep-18 Mar-19
Industrial production |
|
Urban investments |
|
||
Retail sales |
|
GDP (rhs) |
Source: Bloomberg, UBS, as of 24 May 2019.
UBS CIO GWM June 2019 9
vk.com/id446425943
Economy
get balances, or are highly dependent on portfolio capital inflows. Some of China’s stimulus may find its way into other emerging markets, but at this point we only expect marginal effects given its likely more domestic focus.
Investment implications: Look for carry amid uncertainty
What does this all mean for investors? An all-out trade war could trigger the end of the global growth cycle. Luckily, we’re not there yet, and we expect cooler heads to prevail in the end. In the meantime, moderate global growth, combined with the readiness of policymakers to step in when needed, favors smart carry trades, in our view. One such trade is our newly introduced basket of high-yielding emerging market currencies against a basket of low-yielding, high-beta currencies.
Winning losers
On a macro level, everybody loses from restrictions to trade. On a micro level, some may benefit. Recent reports and surveys show that some companies are already shifting their supply chains in response to the trade tensions. High-value-added products tend to relocate from China to Taiwan or Korea, while lower-value-added ones are more likely to move to Southeast Asia. The trade conflict, therefore, would probably only accelerate the already existing trend of migrating low-value manufacturing to China’s neighbors, while also reinforcing China’s goal to focus on more sophisticated production. Apart from Asia, other countries and companies may be able to book small wins, namely those that can serve as a substitute supplier of goods (e.g. Brazil for agricultural produce) or base of production (e.g. Mexico for the US, thanks to North American trade links).
Figure 2
Trade connects, in good and bad times
Export and import growth for China, South Korea, and Taiwan (in % y/y, 3mma)
30
25
20
15
10
5 |
|
0 |
|
–5 |
|
–10 |
|
Mar-16 Sep-16 |
Mar-17 Sep-17 Mar-18 Sep-18 Mar-19 |
China exports |
South Korea exports |
China imports |
Taiwan exports |
Source: Bloomberg, UBS, as of 24 May 2019.
UBS CIO GWM June 2019 10
vk.com/id446425943
Equities
Stay invested
Emerging market (EM) equities were positive in April, but the abrupt escalation of Sino-US trade tensions has negatively impacted the asset class this month. With the 12-month trailing P/E ratio at 12.3x, valuations look undemanding and offer a 25% discount to developed market (DM) counterparts. At the time of writing, about 50% of EM companies have reported 1Q19 earnings. Overall results have shown improvement, with the weighted average earnings beat standing above 2.5%. However, consensus earnings growth for the full year was downgraded to 4.9. Our baseline scenario calls for a de-escalation of US-China tensions within our tactical six-month investment horizon. De-escalation would eventually bring with it better earnings momentum within emerging markets and more positive data releases. Hence, while uncertainty about trade is likely to weigh on sentiment and growth in the near term, EM equities offer a good upside in our base case given the market is levered to an improving global cycle and its valuation is relatively attractive.
Elections results supportive; keep an eye on idiosyncratic factors
The outcome of recent elections in key emerging countries appears to favor their outlook. In India, Prime Minister Narendra Modi’s BJP and its coalition partners will lead a new government again. In South Africa, the ruling ANC has just won the general election and is set to lead the country beginning with a series of structural reforms. In Indonesia, the official tally confirmed President Joko Widodo’s reelection. Overall, a number of risks to emerging market assets remain in the horizon, including potential new sanctions against Russia, and political uncertainties in several Latin American countries.
Country and sector positioning
In our intra-EM equity strategy, we stay overweight China but have opened a new underweight on Hong Kong in order to hedge downside risks. We upgraded Malaysia to overweight because this defensive market should perform relatively well in an environment of high uncertainty and volatility. We remain underweight Thailand due to its sluggish macro outlook and the residual effect of the general election in March. We find no evident tactical opportunities in EMEA and Latin America at the moment.
At the sector level, within Asia ex-Japan, we like financial and select technology stocks to maximize the diversification benefits between value and growth; we also prefer stocks with sustainable cash flow generation and high dividend yield, which should hold up relatively well during volatile markets. In Mexico, we prefer defensive names with non-Mexican exposure to protect against foreign exchange volatility, slowing domestic growth, and higher political risk (consumer staples, utilities). We also favor interest-rate-sensitive stocks with high dividend yields. In Brazil, we favor high-quality domestic cyclical names (financials, consumer discretionary, industrials) that should benefit from a pickup in economic growth as well as cheap domestic defensives that offer about 5% dividend yield and protection in a potential market correction.
Xingchen Yu |
Gabriela Soni, CFA |
Strategist |
Strategist |
Figure 1
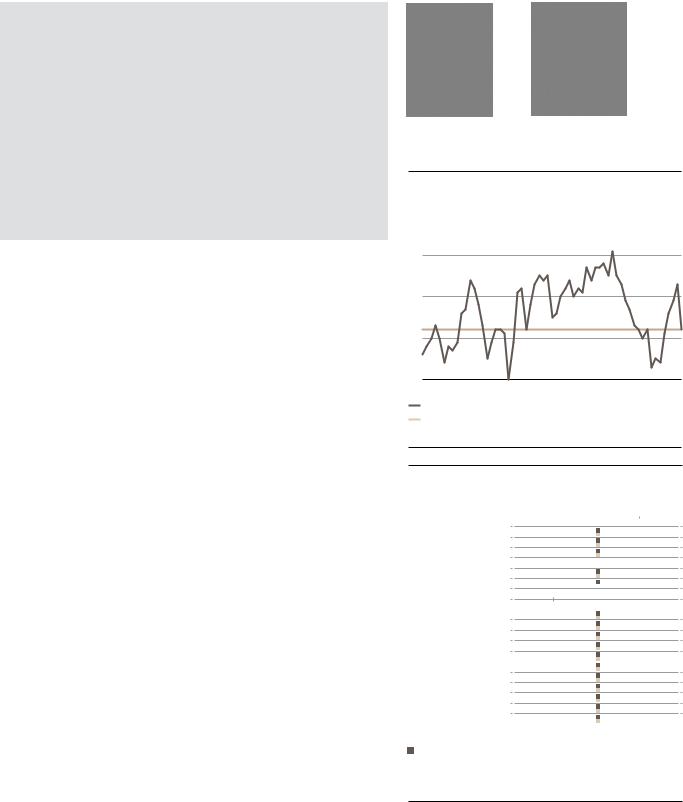
MSCI EM P/E ratio is falling towards its 10 year average
12-month forward P/E ratio
13
12
11
10
May-14 May-15 May-16 May-17 May-18 May-18 May-19
12M forward P/E
10Y Average
Source: Bloomberg, IBES, UBS, as of 21 May 2019
Figure 2
Emerging markets country equity preferences
|
China |
|
|
|
|
|
India |
|
|
|
|
|
|
|
|
|
|
|
Indonesia |
|
|
|
|
Asia |
South Korea |
|
|
|
|
|
Malaysia |
|
|
|
|
|
Philippines |
|
|
|
|
|
Taiwan |
|
|
|
|
|
Thailand |
|
|
|
|
|
Hong Kong* |
|
|
|
|
|
|
|
|
|
|
LatAm |
Brazil |
|
|
|
|
Chile |
|
|
|
|
|
|
|
|
|
|
|
|
Colombia |
|
|
|
|
|
Mexico |
|
|
|
|
|
Peru |
|
|
|
|
|
|
|
|
|
|
|
Czech Republic |
|
|
|
|
EMEA |
Hungary |
|
|
|
|
Poland |
|
|
|
|
|
|
|
|
|
|
|
|
Russia |
|
|
|
|
|
South Africa |
|
|
|
|
|
Turkey |
|
|
|
|
|
|
|
|
|
|
underweight |
neutral |
overweight |
New  Old
Old
*Hong Kong is not a constituent of MSCI EM. Note: All positions are relative to MSCI EM. Source: UBS CIO, as of May 2019.
UBS CIO GWM June 2019 11

vk.com/id446425943
USD bonds strategy
Trade war back in focus
The rally in emerging market (EM) USD-denominated bonds has shown signs of abating amid escalating US-China trade tensions. The asset class (JP Morgan EMBIG Diversified and CEMBI Diversified indexes) has posted a cumulative return of 6.5-7.5% year-to-date, but returns have been broadly flat since early April. Overall, declining US Treasury yields have helped mitigate the impact of widening credit spreads. That said, the high yield segment underperformed its investment grade peer, particularly in countries facing idiosyncratic issues such as Venezuela, Argentina, Sri Lanka, Lebanon, and Turkey. This reflects deterioration in global investor sentiment. Outperformers are lower-beta oil exporters outside of the Middle East (e.g., Kazakhstan, Malaysia), as well as Central Eastern Europe, which is seen as a relatively safe place.
Escalating trade tensions
US-China trade talks have taken a negative turn. The US raised tariffs on USD 200bn of Chinese imports. In return, China increased tariffs of up to 25% on USD 60bn of US imports, and accused the US of “unilateralism and trade protectionism.” Also, US officials said preparations were being made to apply new tariffs on the remaining USD 325bn of Chinese imports not yet covered by levies.
We continue to believe that a shared desire to avoid a global slowdown will eventually push the US and China toward a compromise. As of now, it seems likely that Presidents Donald Trump and Xi Jinping will meet at the next G20 summit in late June. Uncertainty has increased, however, and new tariffs may delay the recovery in global growth. More stimulus out of China and potentially a more dovish Federal Reserve are mitigating factors, but they may not fully offset the impact on growth of a full-blown trade war.
Credit views
Our base case remains for a recovery in global growth in the second half of the year, conditional to a de-escalation in trade tensions. Despite our more cautious view on EM credit, we expect credit spreads to remain range-bound over the next six months, implying 1–2% total returns. Trade uncertainties will keep volatility elevated, but the external backdrop for the asset class remains fairly supportive thanks to accommodative global central banks, higher commodity prices, very low default rates in EM high yield corporate credit (0.3% as of April), decent valuations, and favorable technicals. Against this backdrop, we keep a slight risk-on but selective stance in our allocation together with a short position on duration after the rally in US Treasuries.
What are we looking for next?
Key to monitor in the coming weeks are developments related to trade talks, particularly: whether trade negotiations continue or break down completely; how swiftly the US follows through on the president’s threat to impose duties on an additional USD 325bn of Chinese goods; whether China retaliates beyond the tariffs announced on 13 May; whether the US goes on to raise tariffs on auto imports; the monetary and fiscal policy response; and the spillover, if any, for global economic growth.
Jérôme Audran, |
Michael Bolliger |
CFA, FRM, Analyst |
Head of EM Asset |
|
Allocation |
UBS CIO GWM June 2019 12
vk.com/id446425943
Currencies
Collect carry in a measured way
US-China tensions over trade and technology hit global risk sentiment and affected emerging market currencies, though losses have been moderate so far. A sustainable uptick in emerging economies now looks likely to be delayed as we await more clarity on trade and potential policy responses. For now, our neutral outlook for global monetary policy benefits emerging market currencies, and we expect them to continue to trade broadly sideways. We think current and expected conditions for the coming quarters favor a selective exposure to high-yielding emerging market currencies.
After trending broadly sideways for most of the year, emerging market currencies have felt the weight of the escalating trade tensions between the US and China since the beginning of May and weakened moderately. We expect a trade deal, or at least a truce, at some point later this year, which should then limit the trade-related depreciation pressure on emerging market currencies. Until an agreement is reached, renewed spikes in market volatility are likely and these currencies may suffer temporarily.
Until the US-China tensions escalated, conditions for emerging markets were stabilizing. The neutral outlook for the Federal Reserve’s monetary policy (as well as other global central banks’) provided a more favorable backdrop compared to last year. And after a weak first quarter, emerging economies were showing signs of a growth turnaround. For their currencies to appreciate sustainably, their domestic growth outlook should improve. This will likely be delayed now as uncertainty reigns again.
In this situation of an expected benign global monetary policy backdrop, moderate but stable growth, and somewhat weaker emerging market currencies, we have added to our FX strategy a new diversified position consisting of a long basket of select high-yielding emerging market currencies (Indonesian rupiah, Indian rupee, South African rand), funded with low-yield- ing, high-beta currencies (Australian, New Zealand, and Taiwan dollar) to lower the sensitivity to global headwinds, in particular trade tensions. Please see “Opportunities in a low-volatility FX land,” published 23 May, for details.
This new position incorporates the favorable view we have had on the South African rand since April. We continue to expect President Cyril Ramaphosa to move the focus back on structural reforms after May’s general election, which should support the rand in the coming months, assuming manageable global headwinds.
Aside from the always-present idiosyncratic risks around domestic politics and policies, emerging market currencies will remain exposed to global growth and trade dynamics, benchmark yields, geopolitics, and oil prices, as well as related investor sentiment.
Tilmann Kolb, CFA |
Jonas David, CFA |
Analyst Analyst
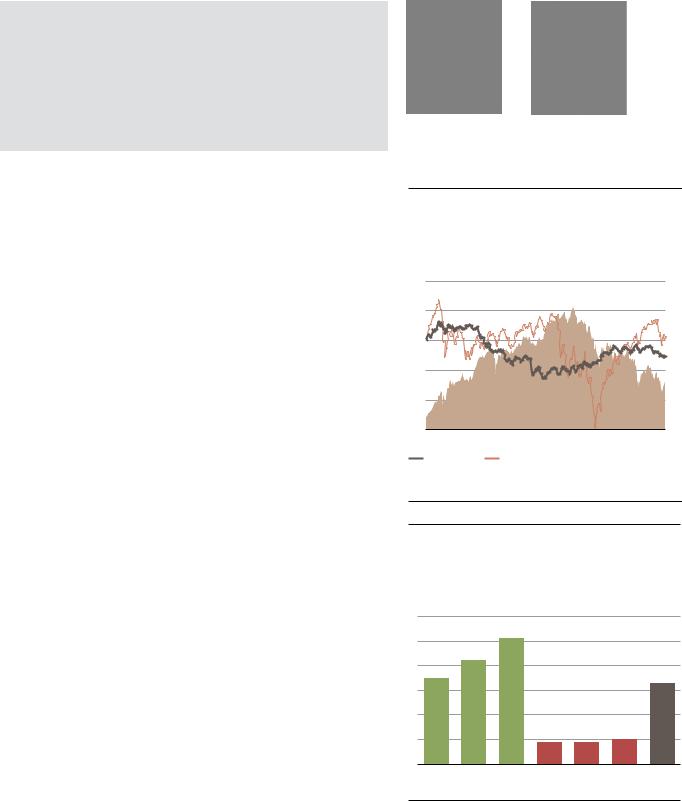
Figure 1
EM currencies only reacted moderately to additional trade tensions so far
ELMI+ and MSCI World, indexed to 100 on 1 January 2018 (lhs); 2-year US Treasury yield, in % (rhs)
110 |
|
|
|
|
3.2 |
105 |
|
|
|
|
3.0 |
|
|
|
|
|
|
|
|
|
|
|
2.8 |
100 |
|
|
|
|
2.6 |
|
|
|
|
|
|
95 |
|
|
|
|
2.4 |
|
|
|
|
|
|
|
|
|
|
|
2.2 |
90 |
|
|
|
|
2.0 |
|
|
|
|
|
|
85 |
|
|
|
|
1.8 |
Jan-18 |
Apr-18 |
Jul-18 |
Oct-18 |
Jan-19 |
Apr-19 |
ELMI+ |
|
MSCI World |
|
|
|
 UST 2yr (rhs)
Source: Bloomberg, UBS, as of 23 May 2019.
Figure 2
Choosing long and short currencies wisely unlocks carry with diminished risks
Interest rate carry for basket currencies over a six-month horizon, in %
6 |
|
|
|
|
|
|
5 |
|
|
|
|
|
|
4 |
|
|
|
|
|
|
3 |
|
|
|
|
|
|
2 |
|
|
|
|
|
|
1 |
|
|
|
|
|
|
0 |
|
|
|
|
|
|
ZAR |
INR |
IDR |
AUD |
NZD |
TWD |
Basket |
Source: Bloomberg, UBS, as of 23 May 2019. |
|
|
carry return |
|||
|
|
|
||||
UBS CIO GWM June 2019 13

14 2019 June GWM CIO UBS
What’s at stake? |
Economic & policy backdrop |
Candidates & key trends |
Scenarios & implications |
Throughout 2019, voters will elect the president, half of the representatives in the lower house, one-third of the senate, governors of 22 out of the country's 23 provinces, and the mayor of the City of Buenos Aires. Markets will focus on the outlook for the October presidential race.
Date |
Election type |
Province / |
|
National |
|||
|
|
||
2-Jun-19 |
Gubernatorial - General |
San Juan |
|
|
|
|
|
|
Gubernatorial - General |
Misiones |
|
|
|
|
|
9-Jun-19 |
Gubernatorial - General |
Entre Ríos |
|
|
|
|
|
|
Gubernatorial - General |
Tucumán |
|
|
|
|
|
|
Gubernatorial - General |
Chubut |
|
|
|
|
|
|
Gubernatorial - General |
Jujuy |
|
12-Jun-19 |
Deadline - Electoral |
National |
|
|
alliances |
|||
|
|
|
||
|
|
|
|
|
|
16-Jun-19 |
Gubernatorial - General |
Santa Fe |
|
|
|
|
|
|
|
|
Gubernatorial - General |
San Luis |
|
|
|
|
|
|
|
|
Gubernatorial - General |
Formosa |
|
|
|
|
|
|
|
|
Gubernatorial - General |
Tierra del Fuego |
|
|
|
|
|
|
|
22-Jun-19 |
Deadline - Presidential |
National |
|
Argentina |
candidates |
|||
|
|
|||
|
|
|
||
11-Aug-19 |
Presidential - Primary |
National |
||
|
|
|
|
|
|
|
Legislative - Primary |
National |
|
|
|
|
|
|
|
29-Sep-19 |
Gubernatorial - General |
Mendoza |
|
|
|
|
|
|
|
13-Oct-19 |
First debate |
National |
|
|
|
|
|
|
|
20-Oct-19 |
Second debate |
National |
|
|
|
|
|
|
|
27-Oct-19 |
Presidential - General |
National |
|
|
|
|
|
|
|
|
Legislative - General |
National |
|
|
|
|
|
|
|
|
Gubernatorial - General |
Buenos Aires |
|
|
|
|
|
|
|
|
Gubernatorial - General |
Catamarca |
|
|
|
|
|
|
|
|
Gubernatorial - General |
Santa Cruz |
|
|
|
|
|
|
|
|
Gubernatorial - General |
Caba |
|
|
|
|
|
|
|
10-Nov-19 |
Gubernatorial - General |
Salta |
|
|
|
|
|
|
|
24-Nov-19 |
Presidential - Runoff |
National |
|
|
|
|
|
|
|
TBD |
Gubernatorial - General |
Chaco |
|
|
|
|
|
|
|
TBD |
Gubernatorial - General |
La Rioja |
|
|
|
|
|
|
|
|
C. Kirchner's corruption |
|
Ongoing |
trials |
|
|
2.8 |
1.8 |
|
GDP |
|
|
|
-2.3 |
-2.0 |
||
(y/y in %) |
|||
|
|
|
|
47 |
|
|
25 |
27 |
18 |
Inflation |
|
|
|
|
|
|
|
(year end in %) |
|
|
|
|
|
|
|
Current account |
|
|
-1.7 |
-2.2 |
(% of GDP) |
-4.9 |
-4.0 |
||
|
|
|
||
Budget balance |
|
|
-3.1 |
-2.2 |
|
-5.6 |
|
||
(% of GDP) |
-6.1 |
|
|
|
|
'17 |
'18E |
'19E |
'20E |
Recent adjustments to the foreign-exchange intervention program have brought down currency volatility. We think the country's strict money base targets and foreign-exchange bands will eventually lead to better behaved inflation. Fiscally, the government delivered its target primary deficit of 2.7% of GDP in 2018, and aims to achieve additional savings in 2019. We believe it will gradually approach, but remain short of, a primary fiscal balance this year. Amid tight monetary and fiscal policy, economic activity will remain muted. The primary sector is one that will likely support overall activity as production stages a meaningful recovery from the depressed levels of 2018 due to drought conditions.
Mauricio Macri: Current president and member of Cambiemos party. His voter support levels have been suffering since the mid-2018 currency crisis, but seem to be bottoming out.
Maria Eugenia Vidal: Current governor of the Province of Buenos Aires. Were Macri’s polling numbers to worsen, she might step in as presidential candidate as she is among the most popular politicians in the country.
Macri's numbers would have to worsen materially from current levels for this to happen, though.
Cristina Fernandez de Kirchner: Former president and current senator for Buenos Aires Province. Despite widespread corruption allegations against her, she retains around 30% of voting intentions. She announced in May that she will participate in the August primary elections, running as vice president to presidential candidate Alberto Fernandez.
Alberto Fernandez: A political negotiator, his only election experience was in 2000 when he ran for the local congress of the city of Buenos Aires. His ticket lost and he came in second, though he still secured a legislature seat. Fernandez was chief-of-staff for Nestor Kirchner and Cristina Kirchner. He quit the role over disagreements with Cristina Kirchner. He was a critic of her second mandate, particularly relating to her more extreme policies. Fernandez maintains good relations with many Peronist leaders and segments of the private sector and the media. He led Massa’s presidential campaign in 2015.
Peronist candidates not aligned with Cristina Kirchner. Roberto Lavagna, former economy minister under Duhalde’s administration; Juan Manuel Urtubery, current governor of Salta Province; Miguel Ángel Pichetto, senator for Río Negro province and leader of the Senate majority; Juan Schiaretti, governor of Córdoba. Despite clear differences among them, they all represent macroeconomic policy continuity.
Sergio Massa: Former chief-of-staff of Cristina Kirchner, former presidential candidate, and current congressman for Buenos Aires Province. He ran in the 2015 presidential race and came in third with 23% of the votes. He is ideologically ambiguous. We think he is closer in thinking to Kirchner than to the non-Kirchnerist Peronist candidates.
With five months to go, the presidential race remains wide open. In our baseline scenario, however, we expect a number of the policies of incumbent President Mauricio Macri to remain in place under his successor, and of course if he is reelected. These include fiscal consolidation efforts toward a primary surplus, tight monetary policy to rein in inflation, and a cooperative relationship with the IMF, as well as "willingness" to remain current on debt obligations.
Kirchner's ticket does not represent continuity, in our view. We see her odds of winning arouond 35% given that she is facing severe corruption allegations; Argentine economic numbers are set to look less dire in the coming months; the global macro and political backdrop is supportive, with key partners the US, Brazil, and Chile all backing policy continuity; and the fact that incumbent presidents in Latin America have historically had a distinct advantage in winning reelections.
In our view, current Argentine asset prices overestimate the likelihood of a return to populism in the upcoming elections. We maintain our favorable view of a number of Argentine US dollar-denominated bonds, though we warn against making too large of an allocation to the country. Our favorable view on its electoral outlook is far from guaranteed, and Argentina's still-large twin deficits leave its assets vulnerable to sharp changes in the external financial environment in the near term. Longer term, the country will continue to face economic and political challenges.
Libertarian economists: A number of libertarian economists intend to run, with Jose Luis Espert leading the pack. They enjoy limited voter support currently.
Google search trends
100%
80%
60%
40%
20%
0% |
|
|
|
|
|
|
|
|
|
|
|
|
|
Apr-2018 |
Jul-2018 |
Oct-2018 |
Jan-2019 |
Apr-2019 |
||
Mauricio Macri |
Cristina Kirchner |
Alberto Fernandez |
||||
María Eugenia Vidal |
Sergio Massa |
|
|
|
||
Polling trends:
A note on published polls: The majority of survey results published in the local press and influencing the market lately are of questionable quality. Most are based on landline phone interviews, often carried out by robots. In-person surveys are generally considered more trustworthy, but they are costly to execute, and the few agencies running them don’t usually make the results publicly available, selling them privately instead. The small print is key to assessing the believability of the surveys.
Social media following |
|
||
|
|||
|
likes |
followers |
|
|
|
|
|
Mauricio Macri |
4.4m |
4.8m |
|
Cristina Fernandez |
2.4m |
5.4m |
|
de Kirchner |
|||
|
|
||
Alberto Fernandez |
23k |
145k |
|
María Eugenia Vidal |
1.6m |
1.5m |
|
Sergio Massa |
951k |
1m |
|
Roberto Lavagna |
5.5k |
148k |
|
|
|
|
|
Source: Ministerio del Interior, Obras Publicas y Vivienda, La Nacion, UBS, as of May 2019
market Emerging |
com/id446425943.vk |
monitor electoral |
|
What’s at stake? |
Economic & policy backdrop |
Candidates & key trends |
Scenarios & implications |
October/November – Parliamentary elections |
|
4.9 |
5.1 |
4.4 |
3.8 |
460 members of the Sejm (lower house) and 100 members |
|
|
|||
|
|
|
|
||
|
|
|
|
|
|
of the Senate (upper house); proportional representation |
GDP |
|
|
|
|
with 5% single party threshold (Sejm) |
(y/y in %) |
|
|
|
|
|
Inflation |
2.1 |
1.1 |
2.3 |
2.6 |
|
|
|
|
(year end in %)
Sejm current composition:
Poland
Senate current composition:
Current account |
0.1 |
|
|
|
(% of GDP) |
|
|
|
|
|
|
-0.7 |
-1.0 |
-1.3 |
Budget balance |
|
-0.4 |
|
|
(% of GDP) |
|
|
|
|
|
-1.5 |
|
-1.6 |
-1.6 |
|
'17 |
'18E |
'19E |
'20E |
Poland benefited from an impressive growth spurt in recent years, allowing the government to boost fiscal spending while keeping the budget deficit contained. GDP growth should remain sound (2019: 4.4% y/y), thanks to solid private consumption; fiscal easing later this year supports this view. Still, high-frequency economic data remains mixed, and additional Eurozone weakness would muddy the Polish outlook as well. Risks persist also with regards to global trade and European politics.
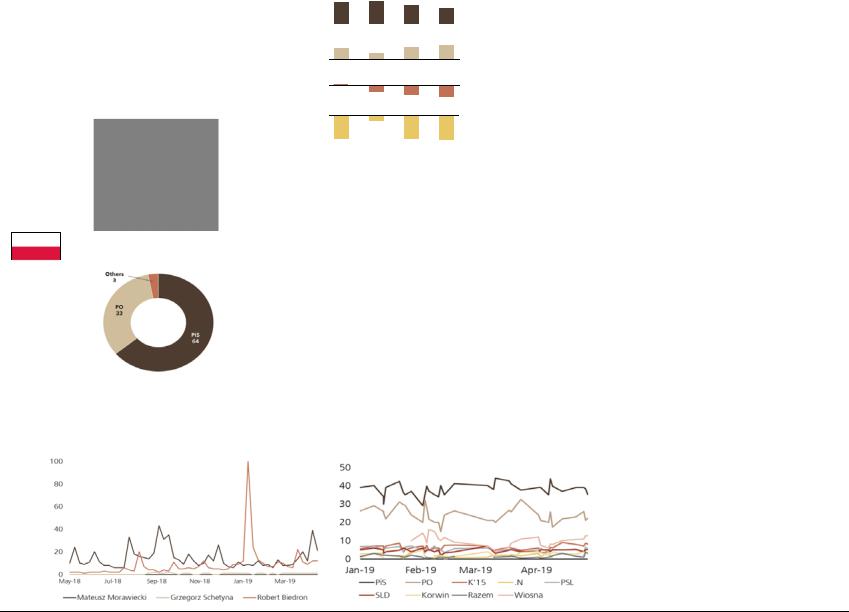
Law and Justice (PiS): PiS is the main nationalistconservative party in Poland. It won an absolute majority in 2015, and incumbent Prime Minister Mateusz Morawiecki leads the party into this year's election. Its fiscal spending programs over the past years were well received by large parts of the Polish population.
Civic Platform (PO): PO is the main opposition party, headed by Grzegorz Schetyna. Given its liberalconservative focus, it is perceived as more businessoriented than PiS. PO has a pro-European focus; the current president of the European Council, Donald Tusk, is a cofounder of PO and served as prime minister of the earlier PO-led government.
Wiosna: Formed only in early 2019 by Robert Biedroń, the social-democratic Wiosna already comes in third place in polls for the parliamentary election. Its platform is based on increases in social spending, better environmental protection, as well as pro-European and socially liberal values.
Kukiz'15: The right-wing political movement, led by Paweł Kukiz, received more than 8% in the last general election, but saw some members of parliament switch to other political groupings over the past years. It enjoys strong support from the younger populations.
Polling trends (below):
Law and Justice consistently polls as the strongest party, with Civic Platform in the second place. A number of parties do not currently surpass the electoral threshold of 5%, which may decide over Law and Justice’s ability to reach an absolute majority on its own. The performance of the European Coalition in the European Parliament election may offer an indication of the viability of collaboration between Polish opposition parties.
Base case:
We think the ruling Law and Justice is likely to remain in power. Another outright majority is in the realm of possibility if smaller parties fail to cross the electoral threshold. Polls show a PiS vote share of slightly below 40%, but with roughly five months to the election, these are still early indications. Strong economic growth, low unemployment, and past and planned social spending provide a supportive backdrop for campaigning.
A potential weakness may be the government’s ongoing disputes with the European Commission around the rule of law and judicial reform, especially if the opposition can link these disputes with Poland’s standing in the EU. The Polish population is highly supportive of EU membership, also given its large economic benefits in the form of EU structural funds.
In the case of another PiS (or PiS-led) government, we don’t expect a change in the current policy direction. Catering to the party’s base in terms social and socially conservative fiscal priorities will likely persist, as will clashes with European institutions over the rule of law. Over a multiyear horizon, the new government may have to find a way to finance fiscally expansive measures amid moderating economic growth.
Alternative scenarios:
We think it is unlikely that any of the opposition parties can overpower PiS and become the strongest force in the Sejm. However, the formation of a coalition for the European Parliament elections by several opposition parties may serve as a blueprint for the Polish parliamentary election. Should the main parties cooperate, the election may become quite contested. From a market perspective, a change in power may be greeted with some enthusiasm, as the deterioration in institutional quality will come to an end. However, different views and ideologies within the coalition may also lead to frictions.
market Emerging |
com/id446425943.vk |
monitor electoral |
|
15 2019 June GWM CIO UBS
Google search trends |
Polling trends |
Social media following |
|
||
|
|
|
|
||
|
|
|
|
likes |
followers |
|
|
|
|
|
|
|
|
|
Mateusz |
- |
112k |
|
|
|
Morawiecki |
||
|
|
|
|
|
|
|
|
|
GrzegorzSchetyna |
36k |
183k |
|
|
|
RobertBiedroń |
530k |
171k |
|
|
|
|
|
|
Source: Sejm (sejm.gov.pl), Wikipedia, Google, UBS, as of May 2019

vk.com/id446425943
Emerging markets publications
Investing in emerging markets
A monthly guide to investing in emerging market financial assets |
29 May 2019 – 4:00 pm GMT |
June 2019 |
Chief Investment Office GWM |
|
Investment Research |
Tweet quakes and their aftershocks
Equities: |
Credit: |
Currencies: |
Focus: |
Economy: |
Stay invested but |
Trade war back in |
Collect carry in a |
Argentina: |
The economics of |
use caution |
focus |
measured way |
Political waters |
US-China trade |
|
|
|
stirred by |
tensions |
|
|
|
Kirchner's |
|
|
|
|
announcement |
|
This report has been prepared by UBS AG, UBS Financial Services Inc. (UBS FS), and UBS Switzerland AG.
Please see important disclaimers and disclosures that begin on page 20.
Monthly flagship
Investing in emerging markets
Including investment views across asset classes and regions
10 October 2018
Chief Investment Office GWM
Investment Research
Thinking strategically about Emerging Markets
Economic, social and financial market changes over the last 20 years and investment implications
A previous version of this report displayed an incorrect version of the table in Figure 42.
White Papers
Thinking strategically about Emerging Markets
Africa
Cradle of Diversity
Russia
Back at Global Center Stage
Latin America
Beyond peak trade
Middle East
Prosperity beyond oil
Asset class publications |
Regional investment themes |
Currencies |
Long term investments (LTIs) |
• EM FX Monthly including currency preferences |
Thematic investments with a 5yr+ investment horizon |
• FX one-pagers (BRL, MXN, RUB, ZAR, TRY, CEE3, APAC) |
|
UBS CIO GWM June 2019 16
vk.com/id446425943
Appendix
Non-Traditional Assets
Non-traditional asset classes are alternative investments that include hedge funds, private equity, real estate, and managed futures (collectively, alternative investments). Interests of alternative investment funds are sold only to qualified investors, and only by means of offering documents that include information about the risks, performance and expenses of alter - native investment funds, and which clients are urged to read carefully before subscribing and retain. An investment in an alternative investment fund is speculative and involves significant risks. Specifically, these investments (1) are not mutual funds and are not subject to the same regulatory requirements as mutual funds; (2) may have performance that is volatile, and investors may lose all or a substantial amount of their investment; (3) may engage in leverage and other speculative investment practices that may increase the risk of investment loss; (4) are long-term, illiquid investments, there is generally no secondary market for the interests of a fund, and none is expected to develop; (5) interests of alternative investment funds typically will be illiquid and subject to restrictions on transfer; (6) may not be required to provide periodic pricing or valuation information to investors; (7) gener - ally involve complex tax strategies and there may be delays in distributing tax information to investors; (8) are subject to high fees, including management fees and other fees and expenses, all of which will reduce profits.
Interests in alternative investment funds are not deposits or obligations of, or guaranteed or endorsed by, any bank or other insured depository institution, and are not federally insured by the Federal Deposit Insurance Corporation, the Federal Reserve Board, or any other governmental agency. Prospective investors should understand these risks and have the financial ability and willingness to accept them for an extended period of time before making an investment in an alternative investment fund and should consider an alternative investment fund as a supplement to an overall investment program.
In addition to the risks that apply to alternative investments generally, the following are additional risks related to an investment in these strategies:
•Hedge Fund Risk: There are risks specifically associated with investing in hedge funds, which may include risks associated with investing in short sales, options, small-cap stocks, “junk bonds,” derivatives, distressed securities, non-U.S. securities and illiquid investments.
•Managed Futures: There are risks specifically associated with investing in managed futures programs. For example, not all managers focus on all strategies at all times, and managed futures strategies may have material directional elements.
•Real Estate: There are risks specifically associated with investing in real estate products and real estate investment trusts. They involve risks associated with debt, adverse changes in general economic or local market conditions, changes in governmental, tax, real estate and zoning laws or regulations, risks associated with capital calls and, for some real estate products, the risks associated with the ability to qualify for favorable treatment under the federal tax laws.
•Private Equity: There are risks specifically associated with investing in private equity. Capital calls can be made on short notice, and the failure to meet capital calls can result in significant adverse consequences including, but not limited to, a total loss of investment.
•Foreign Exchange/Currency Risk: Investors in securities of issuers located outside of the United States should be aware that even for securities denominated in U.S. dollars, changes in the exchange rate between the U.S. dollar and the issuer’s “home” currency can have unexpected effects on the market value and liquidity of those securities. Those securities may also be affected by other risks (such as political, economic or regulatory changes) that may not be readily known to a U.S. investor.
UBS CIO GWM June 2019 17
vk.com/id446425943
Appendix
UBS Chief Investment Office’s (“CIO”) investment views are prepared and published by the Global Wealth Management business of UBS Switzerland AG (regulated by FINMA in Switzerland) or its affiliates (“UBS”).
The investment views have been prepared in accordance with legal requirements designed to promote the independence of investment research.
Generic investment research – Risk information:
This publication is for your information only and is not intended as an offer, or a solicitation of an offer, to buy or sell any investment or other specific product. The analysis contained herein does not constitute a personal recommendation or take into account the particular investment objectives, investment strategies, financial situation and needs of any specific recipient. It is based on numerous assumptions. Different assumptions could result in materially different results. Certain services and products are subject to legal restrictions and cannot be offered worldwide on an unrestricted basis and/or may not be eligible for sale to all investors. All information and opinions expressed in this document were obtained from sources believed to be reliable and in good faith, but no representation or warranty, express or implied, is made as to its accuracy or completeness (other than disclosures relating to UBS). All information and opinions as well as any forecasts, estimates and market prices indicated are current as of the date of this report, and are subject to change without notice. Opinions expressed herein may differ or be contrary to those expressed by other business areas or divisions of UBS as a result of using different assumptions and/or criteria.
In no circumstances may this document or any of the information (including any forecast, value, index or other calculated amount (“Values”)) be used for any of the following purposes (i) valuation or accounting purposes; (ii) to determine the amounts due or payable, the price or the value of any financial instrument or financial contract; or (iii) to measure the performance of any financial instrument including, without limitation, for the purpose of tracking the return or performance of any Value or of defining the asset allocation of portfolio or of computing performance fees. By receiving this document and the information you will be deemed to represent and warrant to UBS that you will not use this document or otherwise rely on any of the information for any of the above purposes. UBS and any of its directors or employees may be entitled at any time to hold long or short positions in investment instruments referred to herein, carry out transactions involving relevant investment instruments in the capacity of principal or agent, or provide any other services or have officers, who serve as directors, either to/for the issuer, the investment instrument itself or to/for any company commercially or financially affiliated to such issuers. At any time, investment decisions (including whether to buy, sell or hold securities) made by UBS and its employees may differ from or be contrary to the opinions expressed in UBS research publications. Some investments may not be readily realizable since the market in the securities is illiquid and therefore valuing the investment and identifying the risk to which you are exposed may be difficult to quantify. UBS relies on information barriers to control the flow of information contained in one or more areas within UBS, into other areas, units, divisions or affiliates of UBS. Futures and options trading is not suitable for every investor as there is a substantial risk of loss, and losses in excess of an initial investment may occur. Past performance of an investment is no guarantee for its future performance. Additional information will be made available upon request. Some investments may be subject to sudden and large falls in value and on realization you may receive back less than you invested or may be required to pay more. Changes in foreign exchange rates may have an adverse effect on the price, value or income of an investment. The analyst(s) responsible for the preparation of this report may interact with trading desk personnel, sales personnel and other constituencies for the purpose of gathering, synthesizing and interpreting market information.
Tax treatment depends on the individual circumstances and may be subject to change in the future. UBS does not provide legal or tax advice and makes no representations as to the tax treatment of assets or the investment returns thereon both in general or with reference to specific client’s circumstances and needs. We are of necessity unable to take into account the particular investment objectives, financial situation and needs of our individual clients and we would recommend that you take financial and/or tax advice as to the implications (including tax) of investing in any of the products mentioned herein.
This material may not be reproduced or copies circulated without prior authority of UBS. Unless otherwise agreed in writing UBS expressly prohibits the distribution and transfer of this material to third parties for any reason. UBS accepts no liability whatsoever for any claims or lawsuits from any third parties arising from the use or distribution of this material. This report is for distribution only under such circumstances as may be permitted by applicable law. For information on the ways in which CIO manages conflicts and maintains independence of its investment views and publication offering, and research and rating methodologies, please visit www.ubs.com/research. Additional information on the relevant authors of this publication and other CIO publication(s) referenced in this report; and copies of any past reports on this topic; are available upon request from your client advisor.
Important Information about Sustainable Investing Strategies: Incorporating environmental, social and governance (ESG) factors or Sustainable Investing considerations may inhibit the portfolio manager’s ability to participate in certain investment opportunities that otherwise would be consistent with its investment objective and other principal investment strategies. The returns on a portfolio consisting primarily of ESG or sustainable investments may be lower than a portfolio where such factors are not considered by the portfolio manager. Because sustainability criteria can exclude some investments, investors may not be able to take advantage of the same opportunities or market trends as investors that do not use such criteria. Companies may not necessarily meet high performance standards on all aspects of ESG or sustainable investing issues; there is also no guarantee that any company will meet expectations in connection with corporate responsibility, sustainability, and/or impact performance.
Distributed to US persons by UBS Financial Services Inc. or UBS Securities LLC, subsidiaries of UBS AG. UBS Switzerland AG, UBS Europe SE, UBS Bank, S.A., UBS Brasil Administradora de Valores Mobiliarios Ltda, UBS Asesores Mexico, S.A. de C.V., UBS Securities Japan Co., Ltd, UBS Wealth Management Israel Ltd and UBS Menkul Degerler AS are affiliates of UBS AG. UBS Financial Services Incorporated of Puerto Rico is a subsidiary of UBS Financial Services Inc. UBS Financial Services Inc. accepts responsibility for the content of a report prepared by a non-US affiliate when it distributes reports to US persons. All transactions by a US person in the securities mentioned in this report should be effected through a US-registered broker dealer affiliated with UBS, and not through a non-US affiliate. The contents of this report have not been and will not be approved by any securities or investment authority in the United States or elsewhere. UBS Financial Services Inc. is not acting as a municipal advisor to any municipal entity or obligated person within the meaning of Section 15B of the Securities Exchange Act (the “Municipal Advisor Rule”) and the opinions or views contained herein are not intended to be, and do not constitute, advice within the meaning of the Municipal Advisor Rule.
External Asset Managers / External Financial Consultants: In case this research or publication is provided to an External Asset Manager or an External Financial Consultant, UBS expressly prohibits that it is redistributed by the External Asset Manager or the External Financial Consultant and is made available to their clients and/or third parties. For country disclosures, click here.
Version 04/2019. CIO82652744
© UBS 2019.The key symbol and UBS are among the registered and unregistered trademarks of UBS. All rights reserved.
UBS CIO GWM June 2019 18