

рынок моды экономика
.pdfvk.com/id446425943
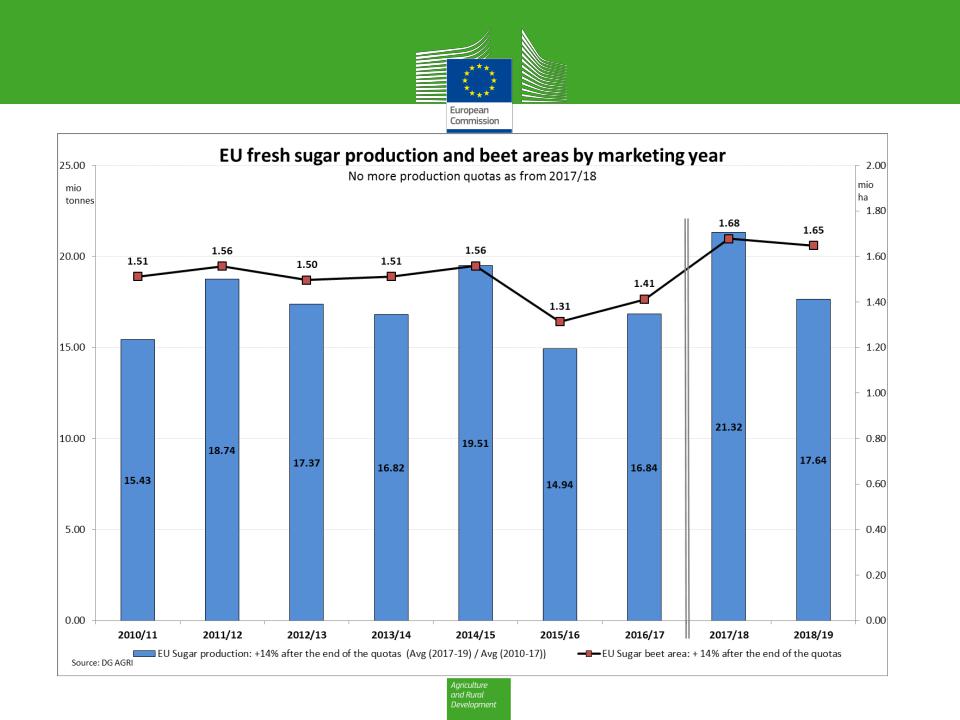
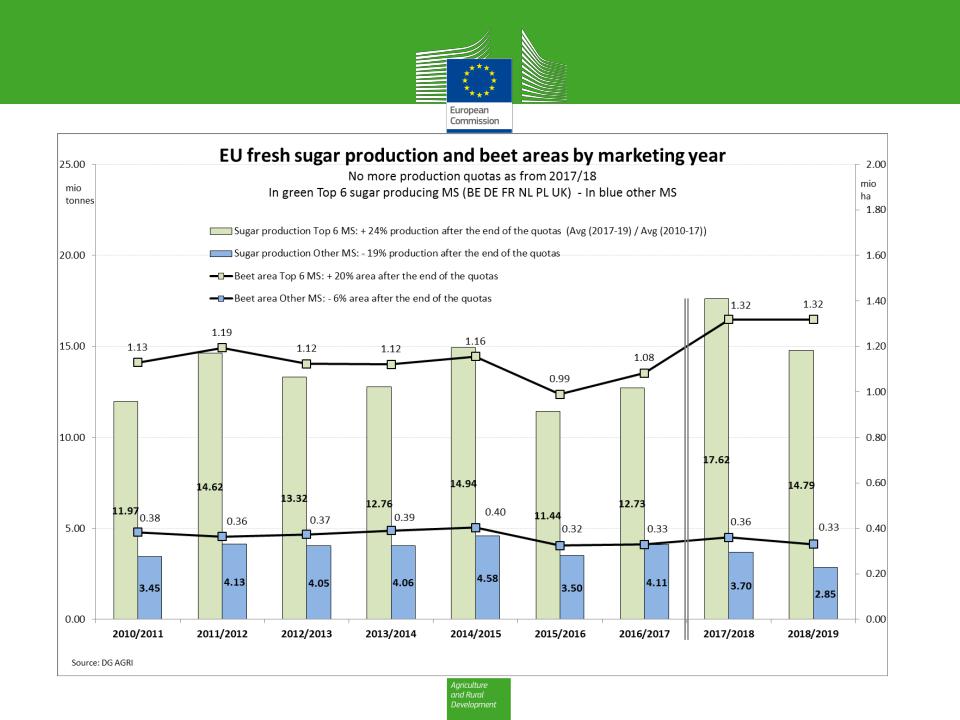
EU Sugar Production
vk.com/id446425943
2017/2018 - Sugar Production
Final data January 2019
|
SUGAR Final production 2017/18 |
SUGAR Final production 2017/18 |
||||||||
|
|
|
|
|
|
|
|
|
|
|
tonnes |
|
|
|
Production |
|
tonnes |
|
|
Production |
|
white sugar |
|
areas |
yield |
of the |
% increase |
white sugar |
areas |
yield |
of the |
% increase |
equivalent |
|
'000 ha |
t/ha |
campaign |
compared to |
equivalent |
'000 ha |
t/ha |
campaign |
compared to |
|
|
(a) |
(b)=( c)/(a) |
( c) |
2016/2017 |
|
(a) |
(b)=( c)/(a) |
( c) |
2016/2017 |
BE |
|
64.7 |
15.1 |
978 608 |
34% |
HU |
15.3 |
9.3 |
142 000 |
|
BG |
|
|
|
|
|
NL |
86.2 |
15.4 |
1 324 023 |
52% |
CZ |
|
58.1 |
11.3 |
655 468 |
10% |
AT |
42.8 |
11.0 |
471 914 |
|
DK |
|
34.4 |
11.5 |
396 893 |
|
PL |
231.7 |
10.0 |
2 313 542 |
18% |
DE |
|
384.8 |
13.4 |
5 157 787 |
45% |
PT (Continent) |
|
|
|
|
EL |
|
6.2 |
5.9 |
36 514 |
|
PT (Açores) |
0.1 |
0.0 |
0 |
|
ES |
|
36.8 |
15.0 |
552 016 |
18% |
RO |
27.6 |
7.9 |
218 477 |
28% |
FR (Met.) |
|
442.9 |
14.1 |
6 236 738 |
38% |
SK |
22.5 |
8.0 |
179 734 |
-19% |
FR (Dom.) |
|
|
|
243 644 |
|
FI |
10.5 |
6.1 |
64 022 |
-54% |
HR |
|
22.3 |
10.3 |
229 143 |
-37% |
SE |
30.8 |
10.0 |
306 906 |
|
IT |
|
38.0 |
8.0 |
305 254 |
-19% |
UK |
107.0 |
12.7 |
1 363 546 |
49% |
LT |
|
15.2 |
9.3 |
140 615 |
-14% |
TOTAL |
1 678 |
12.7 |
21 316 841 |
27% |

vk.com/id446425943
2018/2019 - Sugar Production
Provisional sugar production - April 2019
SUGAR Provisinal production 2018/19 |
SUGAR Provisinal production 2018/19 |
||||||||
|
|
|
|
|
|
|
|
|
|
tonnes |
|
|
Production |
|
tonnes |
|
|
Production |
|
white sugar |
areas |
yield |
of the |
% increase |
white sugar |
areas |
yield |
of the |
% increase |
equivalent |
'000 ha |
t/ha |
campaign |
compared to |
equivalent |
'000 ha |
t/ha |
campaign |
compared to |
|
(a) |
(b) = ( c) / (a) |
( c) |
2017/2018 |
|
(a) |
(b) = ( c) / (a) |
( c) |
2017/2018 |
BE |
64.0 |
13.0 |
830 316 |
-15% |
HU |
14.0 |
7.8 |
110 143 |
-22% |
BG |
|
|
|
|
NL |
85.2 |
13.4 |
1 138 018 |
-14% |
CZ |
57.9 |
9.9 |
572 797 |
-13% |
AT |
32.0 |
10.2 |
324 845 |
-31% |
DK |
34.3 |
10.3 |
351 849 |
|
PL |
239.0 |
9.2 |
2 191 294 |
-5% |
DE |
391.9 |
10.7 |
4 195 019 |
-19% |
PT (Continent) |
|
|
0 |
|
EL (forecast) |
1.3 |
6.7 |
8 424 |
|
PT (Açores) |
|
|
0 |
|
ES |
36.8 |
10.6 |
390 685 |
|
RO |
24.6 |
4.4 |
107 744 |
-51% |
FR (Met.) |
440.0 |
11.6 |
5 104 556 |
-18% |
SK |
22.5 |
7.4 |
166 228 |
-8% |
FR (Dom.) |
|
|
198 108 |
|
FI |
10.3 |
5.2 |
53 228 |
|
HR |
16.6 |
7.2 |
119 487 |
-48% |
SE |
30.7 |
9.1 |
279 488 |
-9% |
IT |
34.3 |
6.3 |
216 244 |
|
UK |
97.2 |
11.7 |
1 133 456 |
-17% |
LT |
16.2 |
9.1 |
147 085 |
5% |
TOTAL |
1 649 |
10.7 |
17 639 015 |
-17% |
vk.com/id446425943
vk.com/id446425943

vk.com/id446425943
Thank you for your attention
vk.com/id446425943 2018
The State
of Fashion

vk.com/id446425943
Copyright The Business of Fashion and McKinsey & Company © 2017

vk.com/id446425943The State of Fashion 2018The State of Fashion 2018
An emerging sense of optimism by Craig & Karl
vk.com/id446425943
The State of Fashion 2018 was created to provide a comprehensive view of the fashion industry. Its principal aim remains to lay out the interconnectedness of the entire fashion ecosystem across regions, market segments and product categories by distilling the industry’s current and projected performance, and addressing the factors shaping and driving fashion today and in the year to come.
To accomplish this, the report relies on extensive qualitative and quantitative analyses, drawing on industry and proprietary sources, including executive interviews, the BoF-McKinsey Global Fashion Survey, and the McKinsey Global Fashion Index, which tracks industry sales, operating profit and economic profit (value creation).
The report is split into two sections: Section 1 provides an overview of some of the massive long-term changes in the fashion industry that serve as a backdrop for everything that is happening. These are overarching, interconnected forces that will drive and shape the trends in years to come. Section 2 provides an outlook for 2018, forecasting the expected growth for the fashion industry across regions, market segments and product categories, highlighting the top priorities for executives, and defining the ten trends that we believe will set the agenda for the industry over the next 12 months.
In order to present a full picture of the ecosystem and bring to life the complex and multifaceted aspects of the industry, the report also includes a series of deep dives and executive interviews on some of the most exciting developments, including the the impact of artificial intelligence on ecommerce platforms and a once in a generation tipping point that could change the balance of power in the global fashion industry.
The State of Fashion 2018
FOREWORD |
6 |
EXECUTIVE SUMMARY |
10 |
FORCES SHAPING FASHION |
14 |
INDUSTRY OUTLOOK 2018 |
20 |
McKINSEY GLOBAL FASHION INDEX |
74 |
GLOSSARY & END NOTES |
80 |