4.3 Math Review Geometry
Once a function f (x) is defined, it is useful to think of the variable x as an input and f (x) as the corresponding output. In any function there can be no more than one output for any given input. However, more than one input can give the same output; for example, if h (x) = |x + 3|, then
h (–4) = 1 = h (–2).
The set of all allowable inputs for a function is called the domain of the function. For f and g defined above, the domain of f is the set of all real numbers and the domain of g is the set of all numbers greater than –1. The domain of any function can be arbitrarily specified, as in the function defined by “h(x) = 9x – 5 for 0 ≤ x ≤ 10.” Without such a restriction, the domain is assumed to be all values of x that result in a real number when substituted into the function.
The domain of a function can consist of only the positive integers and possibly 0. For example,
a(n) = n 2 + n for n = 0, 1, 2, 3, . . . .
5
Such a function is called a sequence and a(n) is denoted by an. The value of the sequence an at n = 3
is 


 . As another example, consider the sequence defined by bn = (–1)n(n!) for
n = 1, 2, 3, . . . . A sequence like this is often indicated by listing its values in the order b1, b2, b3 , . . . , bn, . . . as follows:
–1, 2, –6, . . . , (–1)n(n!), . . . , and (–1)n(n!) is called the nth term of the sequence.
4.3 Geometry
1.Lines
In geometry, the word “line” refers to a straight line that extends without end in both directions.
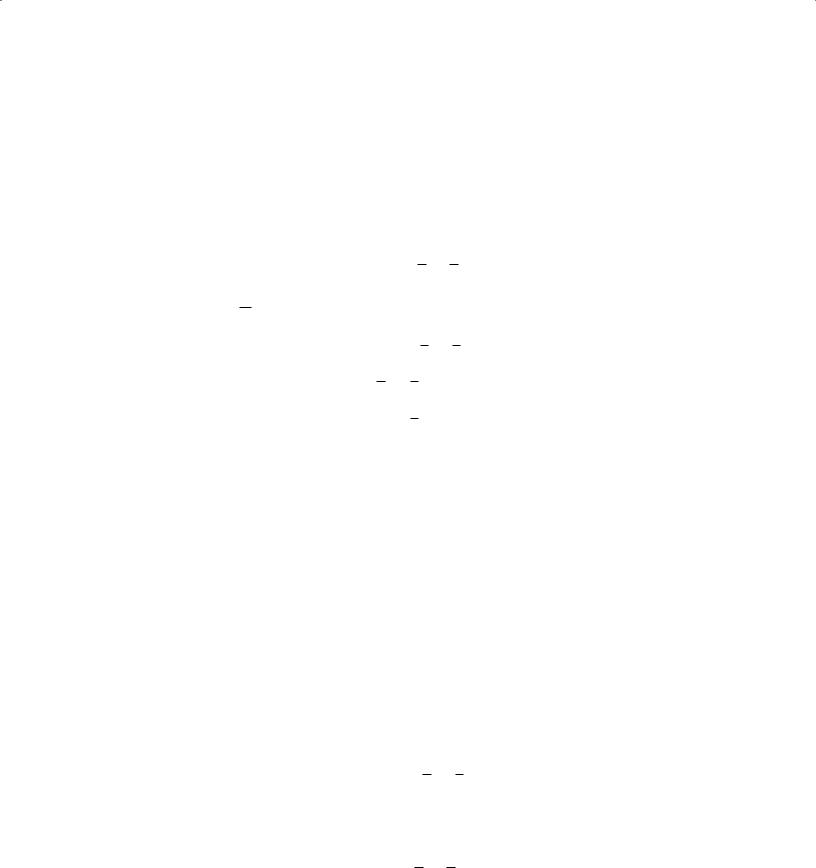
The line above can be referred to as line PQ or line C . The part of the line from P to Q is called a line segment. P and Q are the endpoints of the segment. The notation PQ is used to denote line segment PQ and PQ is used to denote the length of the segment.
2.Intersecting Lines and Angles
If two lines intersect, the opposite angles are called vertical angles and have the same measure. In the figure
PRQ and SRT are vertical angles and QRS and PRT are vertical angles. Also, x + y = 180 since PRS is a straight line.
127
The Official Guide for GMAT® Review 12th Edition
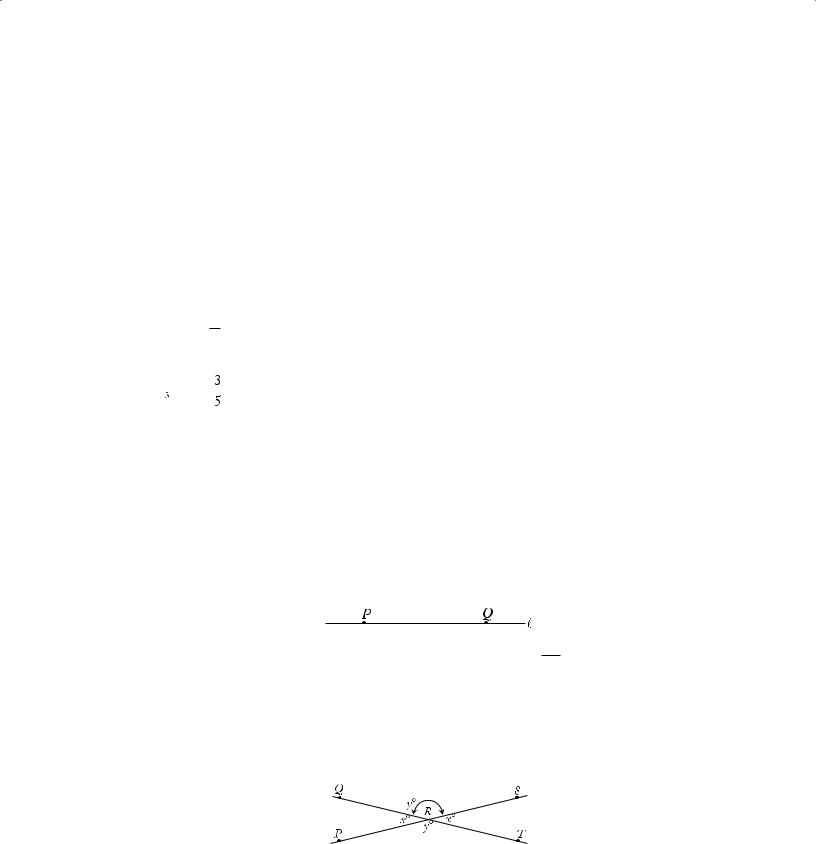
3.Perpendicular Lines
An angle that has a measure of 90° is a right angle. If two lines intersect at right angles, the lines are perpendicular. For example:
C1 and C2 above are perpendicular, denoted by C1 C2. A right angle symbol in an angle of intersection indicates that the lines are perpendicular.
4.Parallel Lines
If two lines that are in the same plane do not intersect, the two lines are parallel. In the figure
lines C1 and C2 are parallel, denoted by C1 ( C2. If two parallel lines are intersected by a third line, as shown below, then the angle measures are related as indicated, where x + y = 180.
|
|
|
|
y°x° |
|
||
|
|
|
x |
° |
y |
° |
|
|
|
|
|
|
|
||
|
y°x° |
|
|
|
|||
x |
° |
y |
° |
|
|
|
|
|
|
|
|
|
|
||
5.Polygons (Convex)
A polygon is a closed plane figure formed by three or more line segments, called the sides of the polygon. Each side intersects exactly two other sides at their endpoints. The points of intersection of the sides are vertices. The term “polygon” will be used to mean a convex polygon, that is, a polygon in which each interior angle has a measure of less than 180°.
The following figures are polygons:
The following figures are not polygons:
128
4.3 Math Review Geometry
A polygon with three sides is a triangle; with four sides, a quadrilateral; with five sides, a pentagon; and with six sides, a hexagon.
The sum of the interior angle measures of a triangle is 180°. In general, the sum of the interior angle measures of a polygon with n sides is equal to (n – 2)180°. For example, this sum for a pentagon is (5 – 2)180 = (3)180 = 540 degrees.
Note that a pentagon can be partitioned into three triangles and therefore the sum of the angle measures can be found by adding the sum of the angle measures of three triangles.
The perimeter of a polygon is the sum of the lengths of its sides.
The commonly used phrase “area of a triangle” (or any other plane figure) is used to mean the area of the region enclosed by that figure.
6.Triangles
There are several special types of triangles with important properties. But one property that all triangles share is that the sum of the lengths of any two of the sides is greater than the length of the third side, as illustrated below.
x |
y |
z
x + y > z, x + z > y, and y + z > x
An equilateral triangle has all sides of equal length. All angles of an equilateral triangle have equal measure. An isosceles triangle has at least two sides of the same length. If two sides of a triangle have the same length, then the two angles opposite those sides have the same measure. Conversely, if two angles of a triangle have the same measure, then the sides opposite those angles have the same length. In isosceles triangle PQR below, x = y since PQ = QR.
Q
10 10
x° y°
P R
129
The Official Guide for GMAT® Review 12th Edition
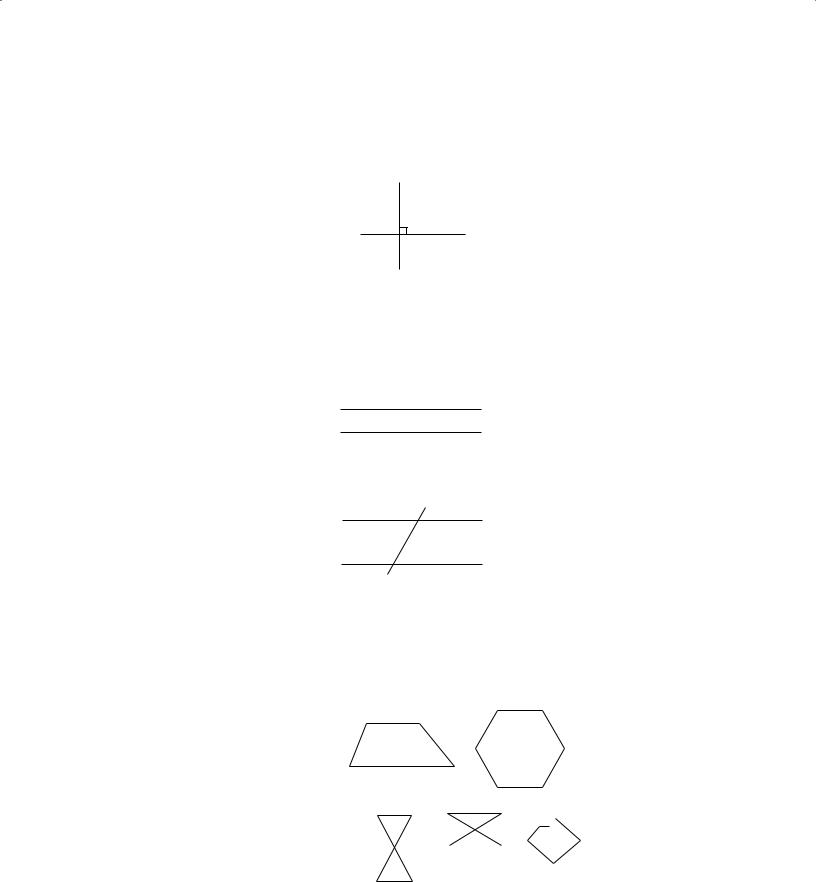
A triangle that has a right angle is a right triangle. In a right triangle, the side opposite the right angle is the hypotenuse, and the other two sides are the legs. An important theorem concerning right triangles is the Pythagorean theorem, which states: In a right triangle, the square of the length of the hypotenuse is equal to the sum of the squares of the lengths of the legs.
S |
|
|
6 |
|
|
R |
8 |
T |
|
|
In the figure above, ∆RST is a right triangle, so (RS)2 + (RT)2 = (ST )2. Here, RS = 6 and RT = 8, so ST = 10, since 62 + 82 = 36 + 64 = 100 = (ST )2 and ST = 100 . Any triangle in which the lengths of the sides are in the ratio 3:4:5 is a right triangle. In general, if a, b, and c are the lengths of the sides of a triangle and a 2+ b 2 = c 2, then the triangle is a right triangle.
|
|
|
|
Y |
|
|
K |
|
|
|
|
|
|
|
45º |
|
|
30º |
|
|
J |
45º |
L |
X |
60º |
Z |
|
2 |
3 |
|||||
|
|
|
|
In 45°–45°–90° triangles, the lengths of the sides are in the ratio 1:1: 2 . For example, in ∆ JKL, if JL = 2, then JK = 2 and KL = 2 2 . In 30°–60°–90° triangles, the lengths of the sides are in the ratio 1: 3: 2. For example, in ∆XYZ, if XZ = 3, then XY = 3 3 and YZ = 6.
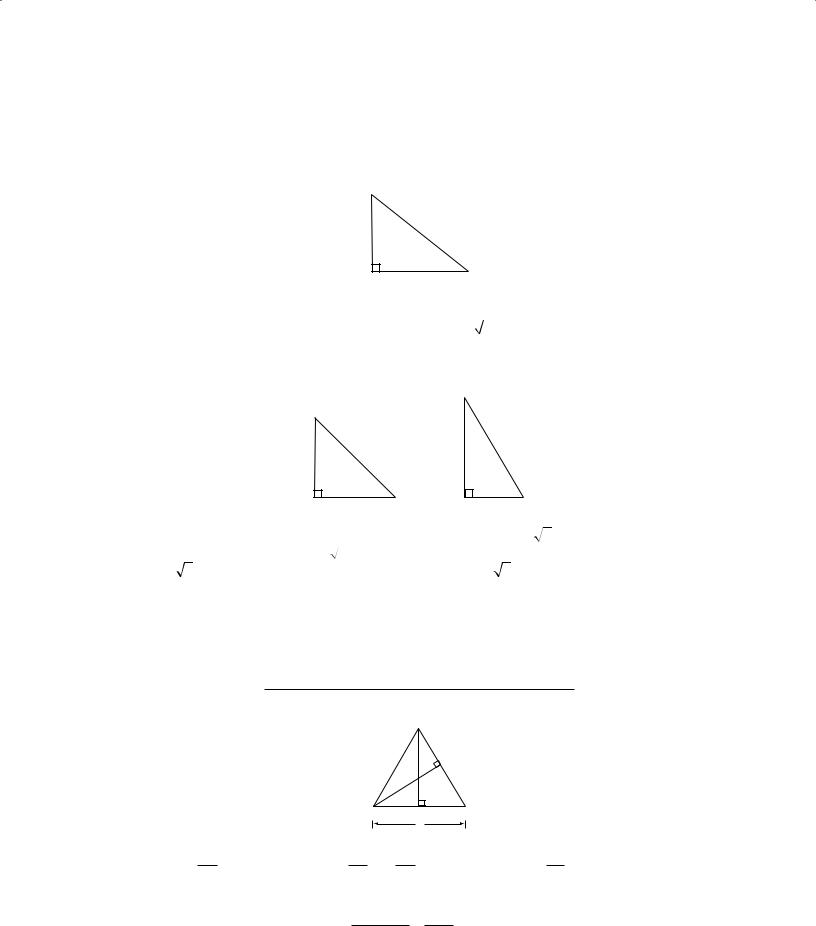
The altitude of a triangle is the segment drawn from a vertex perpendicular to the side opposite that vertex. Relative to that vertex and altitude, the opposite side is called the base.
The area of a triangle is equal to:
(the length of the altitude) × (the length of the base)
2
B
E
A D C
8
BD = 5
In ∆ABC, BD is the altitude to base AC and AE is the altitude to base BC. The area of ∆ABC is equal to
BD × AC = 5 × 8 =
20 .
22
130
4.3 Math Review Geometry
AE × BC. If ∆ABC above is isosceles and AB = BC, then altitude BD 2
bisects the base; that is, AD = DC = 4. Similarly, any altitude of an equilateral triangle bisects the side to which it is drawn.
|
E |
|
6 |
30º |
|
D 60º |
G |
F |
|
|
In equilateral triangle DEF, if DE = 6, then DG = 3 and EG = 3 3 .The area of ∆DEF is equal
to |
3 3 6 = 9 3 . |
|
2 |
7.Quadrilaterals
A polygon with four sides is a quadrilateral. A quadrilateral in which both pairs of opposite sides are parallel is a parallelogram. The opposite sides of a parallelogram also have equal length.
|
|
|
|
K |
|
|
L |
|
|
|
|
|
4 |
||
J |
|
|
|
|
N |
||
|
|
|
M |
||||
|
|
6 |
|
|
|
||
|
|
|
|
|
|
|
|
In parallelogram JKLM, JK ( LM and JK = LM; KL ( JM and KL = JM.
The diagonals of a parallelogram bisect each other (that is, KN = NM and JN = NL). The area of a parallelogram is equal to
(the length of the altitude) × (the length of the base).
The area of JKLM is equal to 4 × 6 = 24.
A parallelogram with right angles is a rectangle, and a rectangle with all sides of equal length is a square.
X |
|
Y |
3 |
|
|
W |
7 |
Z |
|
|
The perimeter of WXYZ = 2(3) + 2(7) = 20 and the area of WXYZ is equal to 3 × 7 = 21. The diagonals of a rectangle are equal; therefore WY = XZ = 9 + 49 = 58.
131
The Official Guide for GMAT® Review 12th Edition
Q |
12 |
R |
|
|
|
|
|
|
|||||
|
|
|
|
|
|
|
|
|
8 |
||||
P |
16 |
S |
|
|
|
|
|
||||||
|
|
|
||||
|
|
|
|
|
|
|
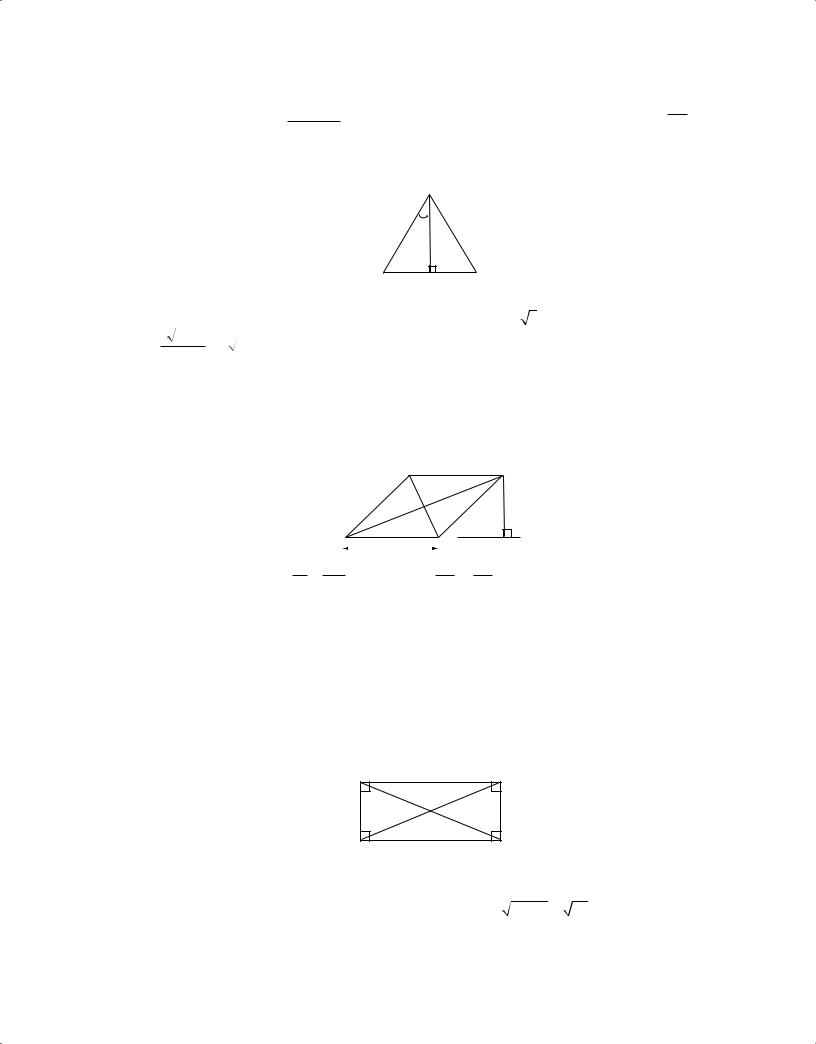
A quadrilateral with two sides that are parallel, as shown above, is a trapezoid. The area of trapezoid PQRS may be calculated as follows:
1 (the sum of the lengths of the bases)(the height) = 1 (QR + PS)(8) = 1 (28 × 8) = 112.
2 |
2 |
2 |
8.Circles
A circle is a set of points in a plane that are all located the same distance from a fixed point (the center of the circle).
A chord of a circle is a line segment that has its endpoints on the circle. A chord that passes through the center of the circle is a diameter of the circle. A radius of a circle is a segment from the center of the circle to a point on the circle. The words “diameter” and “radius” are also used to refer to the lengths of these segments.
The circumference of a circle is the distance around the circle. If r is the radius of the circle, then the
circumference is equal to 2πr, where π is approximately equal to πr2.
J |
7 |
O |
|
P |
|
22 or 3.14. The area of a circle of radius r is 7
K
R
In the circle above, O is the center of the circle and JK and PR are chords. PR is a diameter and OR is a radius. If OR = 7, then the circumference of the circle is 2π (7) = 14π and the area of the circle is π(7)2 = 49π.
The number of degrees of arc in a circle (or the number of degrees in a complete revolution) is 360.
132
4.3 Math Review Geometry
|
|
R |
|
|||
O |
xº |
S |
|
|||
|
|
T |
|
|||
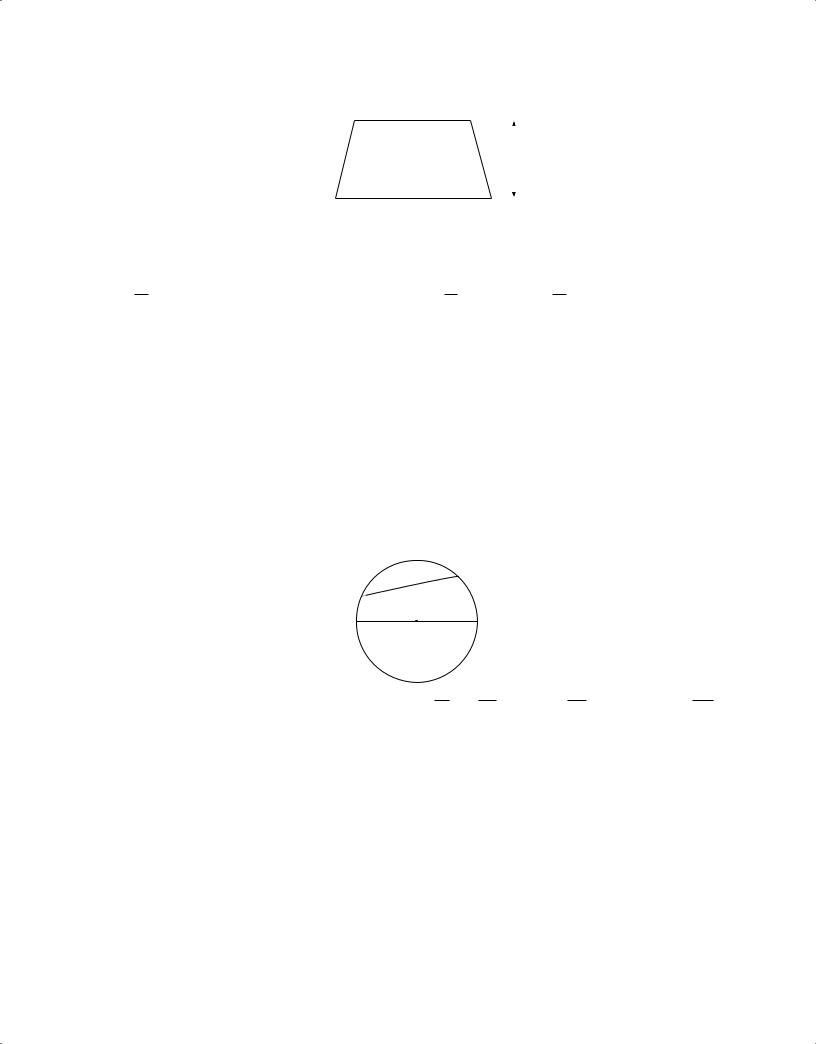
In the circle with center O above, the length of arc RST is |
|
x |
of the circumference of the circle; |
|||
360 |
||||||
|
1 |
|
|
|||
for example, if x = 60, then arc RST has length |
of the circumference of the circle. |
|||||
6 |
||||||
|
|
|
|
|
||
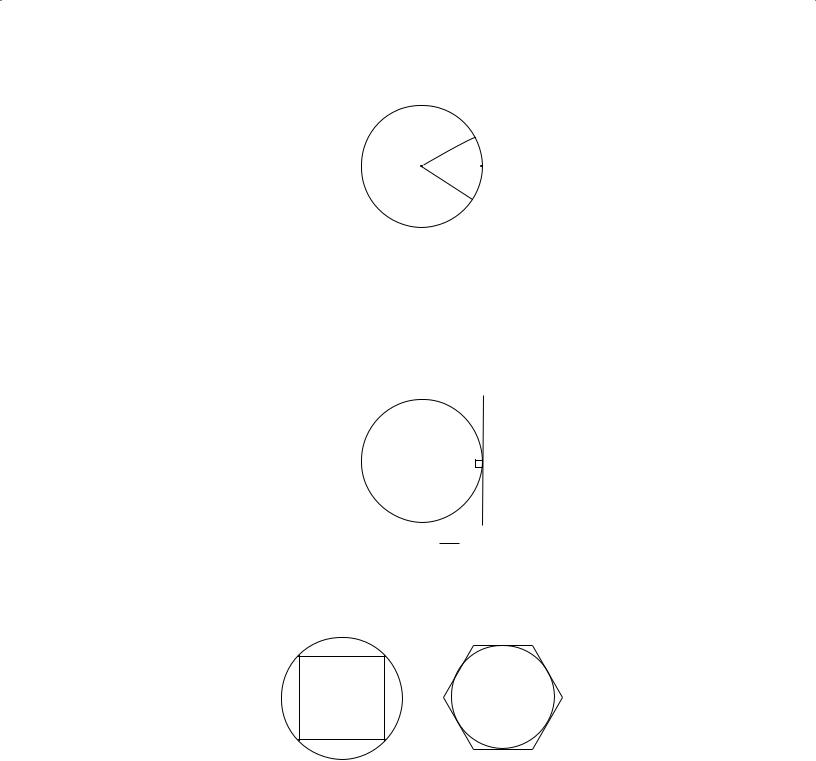
A line that has exactly one point in common with a circle is said to be tangent to the circle, and that common point is called the point of tangency. A radius or diameter with an endpoint at the point of tangency is perpendicular to the tangent line, and, conversely, a line that is perpendicular to a diameter at one of its endpoints is tangent to the circle at that endpoint.
O
 T
T
The line C above is tangent to the circle and radius OT is perpendicular to C.
If each vertex of a polygon lies on a circle, then the polygon is inscribed in the circle and the circle is circumscribed about the polygon. If each side of a polygon is tangent to a circle, then the polygon is circumscribed about the circle and the circle is inscribed in the polygon.
Q |
R |
C |
D |
|
|
||
|
|
B |
E |
P |
S |
A |
F |
|
|
In the figure above, quadrilateral PQRS is inscribed in a circle and hexagon ABCDEF is circumscribed about a circle.
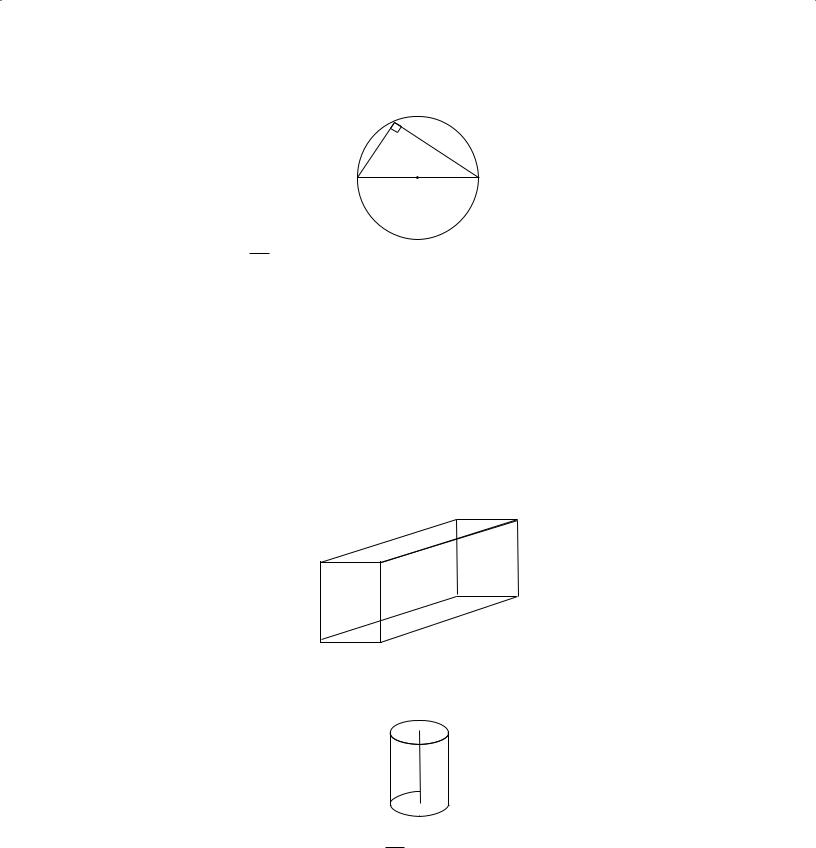
If a triangle is inscribed in a circle so that one of its sides is a diameter of the circle, then the triangle is a right triangle.
133
The Official Guide for GMAT® Review 12th Edition
Y
X Z
O
In the circle above, XZ is a diameter and the measure of XYZ is 90°.
9.Rectangular Solids and Cylinders
A rectangular solid is a three-dimensional figure formed by 6 rectangular surfaces, as shown below.
Each rectangular surface is a face. Each solid or dotted line segment is an edge, and each point at which the edges meet is a vertex. A rectangular solid has 6 faces, 12 edges, and 8 vertices. Opposite faces are parallel rectangles that have the same dimensions. A rectangular solid in which all edges are of equal length is a cube.
The surface area of a rectangular solid is equal to the sum of the areas of all the faces. The volume is equal to
(length) × (width) × (height);
in other words, (area of base) × (height).
U V
QR
4 |
T |
W |
P |
8 |
|
3 S |
|
In the rectangular solid above, the dimensions are 3, 4, and 8. The surface area is equal to 2(3 × 4) + 2(3 × 8) + 2(4 × 8) = 136. The volume is equal to 3 × 4 × 8 = 96.
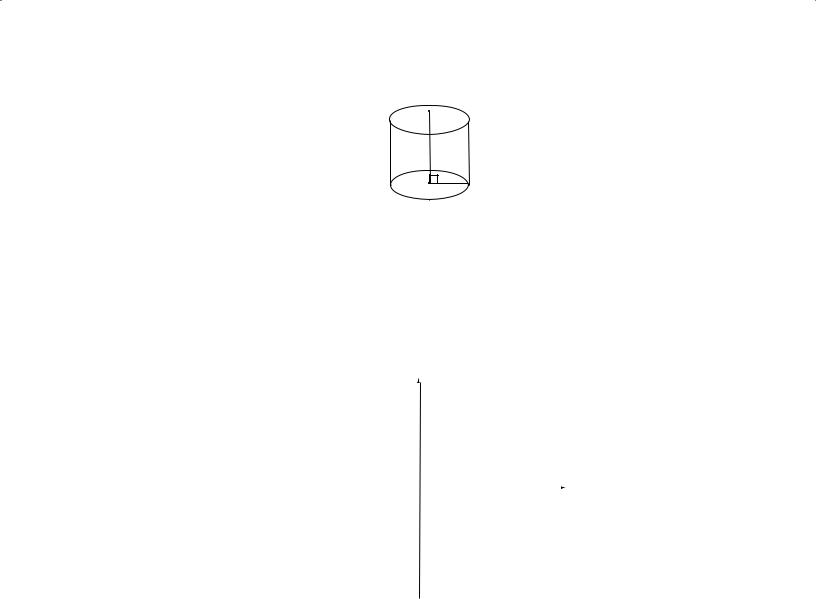
 P
P
O

The figure above is a right circular cylinder. The two bases are circles of the same size with centers
O and P, respectively, and altitude (height) OP is perpendicular to the bases. The surface area of a right circular cylinder with a base of radius r and height h is equal to 2(πr 2) + 2πrh (the sum of the areas of the two bases plus the area of the curved surface).
The volume of a cylinder is equal to πr 2h, that is,
(area of base) × (height).
134
4.3 Math Review Geometry
8
5
In the cylinder above, the surface area is equal to
2(25π) + 2π(5)(8) = 130π,
and the volume is equal to
25π(8) = 200π.
10. Coordinate Geometry
|
|
|
|
|
|
|
y |
|
|
|
|
|
|
|
|
|
|
|
|
|
|
|
|
|
3 |
|
|
|
|
|
|
|
|
|
|
|
|
|
|
|
|
|
|
|
|
|
|
|
|
|
|
|
|
|
||
|
|
|
|
II |
2 |
|
|
|
|
|
|
I |
|
|
|
|||
|
|
|
|
|
|
|
|
|
|
|
|
|
||||||
|
|
|
|
1 |
|
|
|
|
|
|
|
|
|
|||||
|
|
|
|
|
|
|
|
|
|
|
|
|
|
|
|
|
||
|
|
|
|
|
|
|
|
|
|
|
|
|
|
|
|
|
||
|
|
|
|
|
|
|
|
|
|
|
|
|
|
|
|
|
|
|
–4 |
|
–3 |
|
|
|
|
|
|
|
|
|
|
|
|
|
|
|
|
|
|
–2 |
–1 O |
1 |
2 |
3 |
4 x |
|||||||||||
|
|
|
|
III |
|
–1 |
|
|
|
|
|
|
IV |
|
|
|
||
|
|
|
|
|
|
|
|
|
|
|
|
|
|
|||||
|
|
|
|
|
–2 |
|
|
|
|
|
|
|
|
|
||||
|
|
|
|
|
|
|
|
|
|
|
|
|
|
|||||
|
|
|
|
|
|
|
–3 |
|
|
|
|
|
|
|
|
|
|
|
|
|
|
|
|
|
|
|
|
|
|
|
|
|
|
|
|
|
|
The figure above shows the (rectangular) coordinate plane. The horizontal line is called the x-axis and the perpendicular vertical line is called the y-axis. The point at which these two axes intersect, designated O, is called the origin. The axes divide the plane into four quadrants, I, II, III, and IV, as shown.
Each point in the plane has an x-coordinate and a y-coordinate. A point is identified by an ordered pair (x,y) of numbers in which the x-coordinate is the first number and the y-coordinate is the second number.
135
The Official Guide for GMAT® Review 12th Edition
y
5
4
3 
 P
P
2
1
|
|
|
|
|
|
|
|
|
|
|
|
|
|
|
|
–5 –4 –3 |
–2 –1 O |
|
1 2 3 4 5 x |
||||||||||||
|
|
|
|
|
|
–1 |
|
|
|
|
|
|
|
|
|
|
|
|
|
|
|
–2 |
|
|
|
|
|
|
|
|
|
|
|
|
|
|
|
|
|
|
|
|
|
|
|
|
|
|
Q |
|
|
–3 |
|
|
|
|
|
|
|
|
|
||
|
|
|
|
|
|
|
|
|
|
|
|
||||
|
|
|
|
|
|
–4 |
|
|
|
|
|
|
|
|
|
|
|
|
|
|
|
|
|
|
|
|
|
|
|
|
|
|
|
|
|
|
|
–5 |
|
|
|
|
|
|
|
|
|
|
|
|
|
|
|
|
|
|
|
|
|
|
|
|
|
In the graph above, the (x,y ) coordinates of point P are (2,3) since P is 2 units to the right of
the y-axis (that is, x = 2) and 3 units above the x-axis (that is, y = 3). Similarly, the (x,y ) coordinates of point Q are (–4,–3). The origin O has coordinates (0,0).
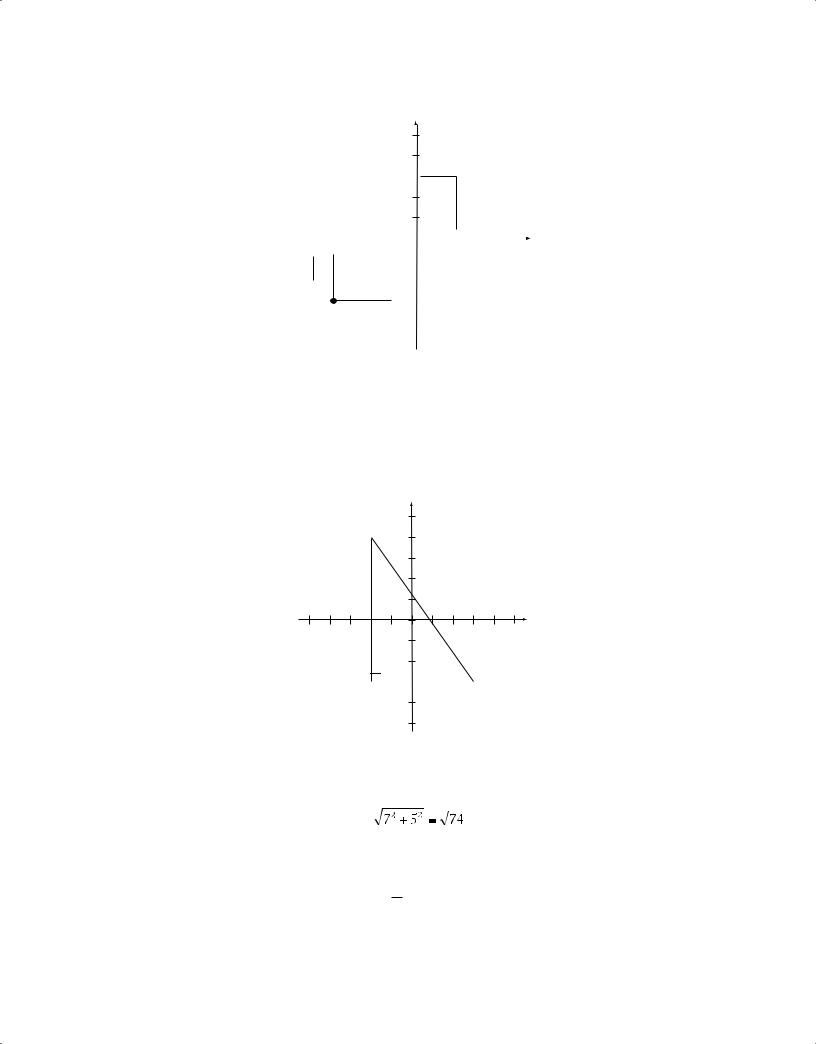
One way to find the distance between two points in the coordinate plane is to use the Pythagorean theorem.
y
(–2,4)
R
x
O
Z 


 S
S
(3,–3)
To find the distance between points R and S using the Pythagorean theorem, draw the triangle as shown. Note that Z has (x,y) coordinates (–2,–3), RZ = 7, and ZS = 5. Therefore, the distance between R and S is equal to
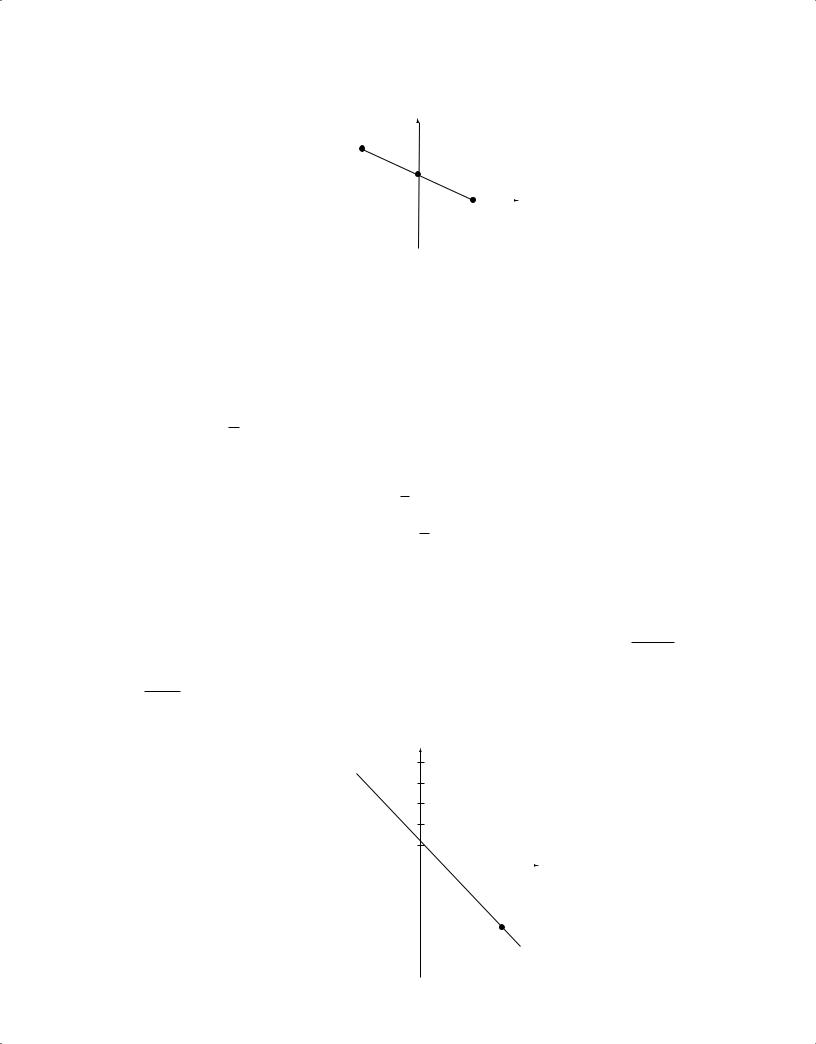
For a line in the coordinate plane, the coordinates of each point on the line satisfy a linear equation of the form y = mx + b (or the form x = a if the line is vertical). For example, each point on the line
on the next page satisfies the equation y = – 1 x + 1. One can verify this for the points (–2,2), (2,0), 2
and (0,1) by substituting the respective coordinates for x and y in the equation.
136
 4
4