

ManualOperator
.pdf
|
Table Of Contents |
Data Trend Center |
420 |
What "Data Trend Center" function is? |
420 |
Modifying "Data Trend Center" parameters |
421 |
The "Data Trend Center" graph |
423 |
Customize the display |
425 |
27. Weather Routing ___________________________________________________________________________ 427
What Weather Routing is ? |
427 |
What Weather Routing is ? |
427 |
Open a Weather Forecast File |
428 |
Plot the Waypoint to reach |
428 |
Calculate a Weather Routing |
429 |
Calculate Routing From a Selected Point |
430 |
Weather Routing displayed on the Chart |
430 |
Edit and Modify the Weather Routing |
432 |
Displaying the Routing Center |
434 |
Calculating Weather Routing with Tidal current |
435 |
Create and Choose "Routing Area" Layer File |
436 |
Create and Play a Weather Routing Animation |
437 |
Weather Routing Properties |
437 |
28. Professional Weather Routing________________________________________________________________ 441
What is a Professional Weather Routing is ? |
441 |
What is a Professional Weather Routing is ? |
441 |
Before Calculating a Professional Weather Routing |
441 |
Displaying Pro Routing on the Chart |
444 |
Initializing Weather Routing |
447 |
Customizing Routing |
447 |
Displaying the Routing Center |
449 |
Selecting an optimal routing |
450 |
Modifying the Weather Forecast |
451 |
29. Logbook__________________________________________________________________________________ 453
Navigation logbook |
453 |
Displaying the logbook on the chart |
453 |
Displaying the logbook center |
454 |
Trip Logbook Center |
455 |
Creating an event |
456 |
Configuring the logbook |
457 |
Archiving the logbook |
459 |
Opening an archived logbook |
460 |
Importing previous logbook |
461 |
Closing archived logbooks |
462 |
Catching logbook |
462 |
Tuna fishing logbook |
462 |
Plotting a catching entry |
462 |
Viewing a purse seine |
464 |
Create a new catching logbook |
464 |
30. Chart Window Controls _____________________________________________________________________ 465
Configuring your Workspace |
465 |
Choosing the Chart Desktop Display |
466 |
Modifying Chart Windows location |
467 |
Customizing Toolbars display |
468 |
Customizing the Data Cursor display |
468 |
xi

MaxSea Operator Manual version 12.6
Nav Data Palette Display |
469 |
Displaying Tide & Tidal Current window |
470 |
Center display and controls... |
471 |
North Up auto center mode display |
473 |
Course Up auto center mode display |
474 |
Head Up auto center mode display |
474 |
Display screen lighting level |
475 |
Context Menus |
476 |
Keyboard shortcuts |
476 |
Virtual Keyboard |
479 |
Print Charts |
480 |
Saving Chart as... |
480 |
31. Software Options __________________________________________________________________________ 481
Setting Up PBG/2D/3D |
481 |
Personal Bathy Generator settings |
481 |
Bathy 2D settings |
481 |
3D settings |
483 |
Setting up GPS and Track |
484 |
Setting Up Display |
486 |
Two categories of Distances Measurement between the Great circle or Rhumb line calculations |
487 |
Palette data font size |
487 |
Display chart outlines |
487 |
Antemeridian |
487 |
Display geographic grid |
488 |
Display TD grids |
488 |
Scale |
488 |
Setting Up Units |
488 |
Setting Up Coordinate System |
489 |
Setting Up Magnetic Variation |
489 |
Setting Up Fuel Consumption |
491 |
Customizing Icons |
491 |
Setting Up Route |
491 |
Setting Up Targets |
494 |
Setting Up Text |
495 |
Setting Up TDs (Hyperbolic Networks) |
496 |
Setting Loran TDs corrections |
496 |
Setting Up Events |
497 |
Setting Up Data Source Input |
498 |
Setting Up Radar System |
499 |
Option : Sounder... |
500 |
32. Glossary _________________________________________________________________________________ 505
33. Index_____________________________________________________________________________________ 513
xii

1

MaxSea Operator Manual version 12.6
WELCOME
Running the cutting-edge of applied information technology, MaxSea software for all boaters who have been looking for a user friendly interface and a more comprehensive navigation tool.
Intuitive operation of MaxSea is achieved by its user-friendly interface and graphical toolbar.
MaxSea is an Electronic Chart System (ECS) based on the International Maritime Organization's (IMO) ECDIS standards. It integrates electronic charts, GPS, AIS and provides complete voyage planning and vessel-monitoring functions..
Here are some features of MaxSea Professional Recreational and AIS :
1.MapMedia mm2 raster charts
2.BSB compatible (install NOAA raster charts or Install Maptech raster charts)
3.C-Map compatible (Install Electronic Charts)
4.Unlimited Waypoints and Routes
5.Route plan information
6.Follow Active Route
7.Unlimited Waypoints layers (to keep your screen un-cluttered)
8.Print Chart and route plan
9.MaxSea provides an overview of vessels transmitting AIS signals.
10.GPS Transfer of waypoints and routes (compatible with Furuno GPS, Magellan…) Please be sure that your computer fits the System Requirements
You will find accurate explanations of all MaxSea features, including the external modules(*) like :
MaxSea 2D / 3D import and PBG
MaxSea Seabed Analysis
MaxSea Dredge function
Weather forecast module
Automatic Identification System (AIS) module. Two New Functions are used to send AIS TX Message and to setup static data in AIS with the MaxSea's AIS MKD.
www.maxsea.com |
info@maxsea.fr |
Note that the presence of each module depends to your software configuration. To order or to obtain more information, please contact your dealer.
2

USER GUIDE: MaxSea New Faetures
3

MaxSea Operator Manual version 12.6
4
User Interface
Looking at the Chart Desktop
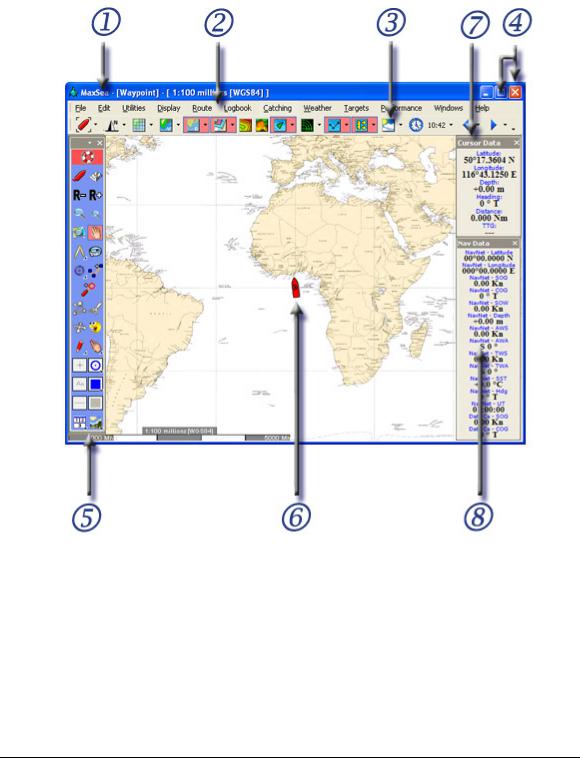
MaxSea opens into a familiar charting environment (Figure below). MaxSea will display many different types of charts simultaneously. The charts are ordered according to their geographical position and their scale of representation. Let's take a brief tour around the MaxSea Chart Desktop:
The Chart Desktop (1) is the open window and consists of six parts:
•The Chart Window is docked to the top of the open window, as above, by default. The datum, type of chart and
scale are displayed in the MaxSea/Chart title bar WGS84], [Raster 1:25 million]. Several chart windows can be opened at the same time. The GPS/vessel symbol (6) is drawn in each open chart window that contains the vessel’s position. It indicates the boat position displayed on the chart at the point currently indicated by the GPS system connected to the PC.
5
MaxSea Operator Manual version 12.6
•The Menu bar (2) organizes a number of drop-down menus which configure and manage MaxSea data, setups, and presentation.
•The Chart Toolbar (3) contains a series of buttons which toggle on/off or select different functions in the software. If a button is “grayed out,” the function is present but currently disabled, if a button is not present, the corresponding module has not been purchased.
•The Toolbar (5) is the tools control center. Each tool does a specific job and can be chosen with a left click of the mouse. The plot tool is configured here, screen palette chosen, and Full Screen Mode toggled on/off.
•The Cursor Data Palette (7) displays, regardless of active tool, data relative to the vessel’s position. By default this palette is displayed on the right or docked to the edge of the software window. Data information is latitude, longitude, Depth (if sounder is enabled), Route (course, vessel to cursor) and Distance between the cursor, the vessel, and the Time to Go (TTG) at the present speed.
•The Nav Data Palette (8) displays GPS data and any instrument input you have chosen to show. This palette is displayed on the right by default or docked to the edge of the software window.
•Tool tips are temporarily shown when the cursor is placed on a Tool Palette item or button for a few seconds.
Use these tool tips when you want to see a brief description of Tools and Buttons.
Notes:
(1)- All the palettes in the chart desktop window can be displayed in two different modes, "Floating Palette" or "Docked". Refer to “Setting your work area” paragraph.
(2)- If raster chart data is not available for a selected scale, MaxSea will enlarge or "over-zoom" the available raster data of the larger scale chart. In this case, the text [Over Zoom] appears in the Chart window title bar.
6
User Interface
Toolbar
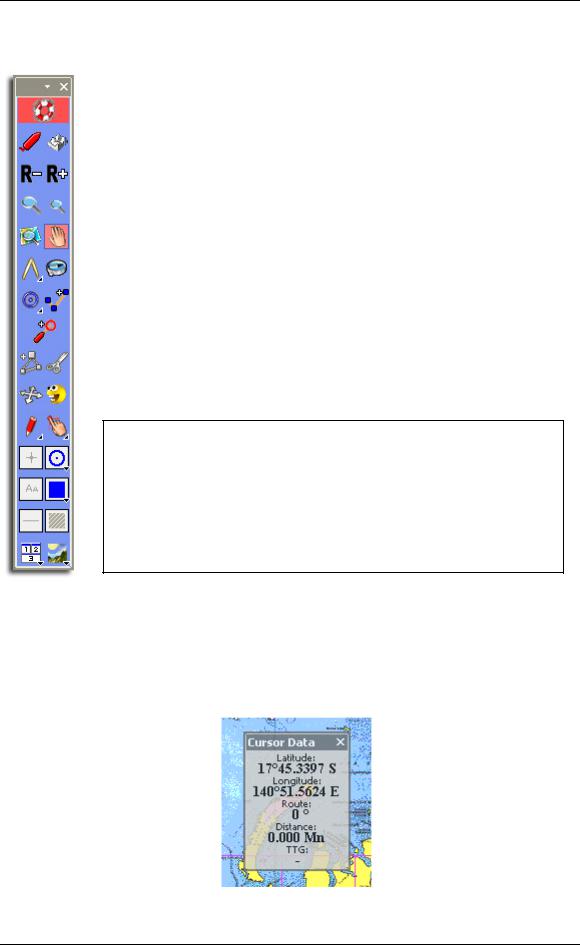
MaxSea uses tools and buttons to make operation simple and easy. The "Tools Bar” displayed on the left side of the screen will be used most often.
The toolbar is displayed by default vertically on the left-hand side of the screen. It includes both tools and buttons and allows working on an electronic chart as you would do on a paper chart with a pencil and navigational protractor.
Select any tool or activate any button on the palette by simply clicking on it.
The Toolbar consists in six parts:
1.Title Bar with accessing the display configuration parameters,
2.Activation Buttons (some more Activation buttons will appear in the Toolbar according to the software configuration),
3.Navigation Tools
4.Capture and Modification tools
5.Plotting Set Up objects
6.Additional Display options
TIPS – Understanding the difference between a tool and a button will make using MaxSea much easier. When selecting a tool from the tools palette, the mouse cursor will change accordingly and its function will change. For example, when the chart panning tool is selected, (hand) the cursor changes to an open hand. Left mouse click (and hold) on the chart with the panning tool to drag the chart around. To enter a waypoint on the charts, change to the Waypoint tool by clicking on the Pencil. Then when the mouse is left clicked on the chart, a waypoint will be recorded. Some icons on the tools palette are buttons (Zoom in and Zoom out). When a button is clicked, MaxSea responds immediately. For example, click on the Zoom In button, MaxSea will magnify the chart immediately. Whichever tool has been selected (such as the panning or waypoint tool) will stay enabled and the function will not change when clicking on a button
Cursor Data
The Cursor Data (mouse pointer) is displayed at the upper right-hand corner of the Chart window. It contains data pertaining to cursor location and shows real-time information as the cursor moves over the screen.
7
MaxSea Operator Manual version 12.6
Default layout Cursor Data
•To move the Cursor Data palette, left-click on its title bar, hold the mouse button down, drag to the new position and release the mouse button.
•Left-clicking on the cross in the upper right hand corner will close the cursor palette.
•To reopen the closed Cursor Data palette, go to [Display] on the menu bar and choose [Cursor Data].
The default layout Cursor Data window is shown in the right upper corner of the screen. Cursor Data shows the Latitude and Longitude, bearing/course and distance between the cursor and the vessel, and the time to go ( TTG ) at the present boat speed.
Configure the Cursor Data window layout by right clicking in its title bar:
1.Change its transparency,
2.Choose a specific font size
3.Choose between a full display mode (all data are shown) or reduced display mode (only data position are shown)
For more information see related topic under the HELP: "Customizing the Cursor Data display" to find out more about Cursor Data display.
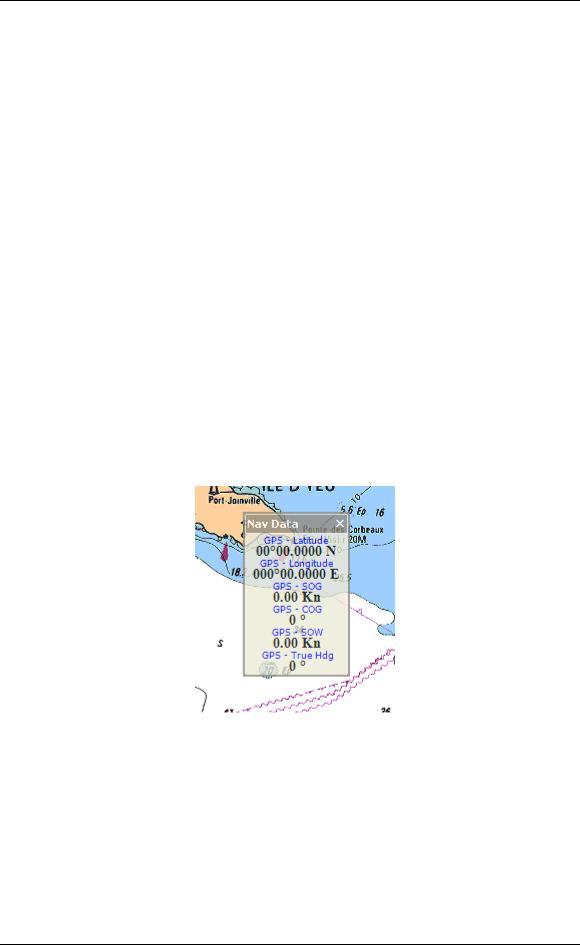
Nav Data
The Instrument Data Display palette (Nav Data) allows viewing information sent by electronic equipment connected to the input/output ports of the computer (GPS, central navigation equipment).
•To move the Nav Data palette, left-click on its title bar, hold the mouse button down, drag it to the new position and release the mouse button.
•Left-clicking on the cross in the upper right hand corner will close the Nav Data palette.
•To reopen closed the Nav Data palette go to [Display] on the menu bar and choose [Nav data].
For more information see related topic under the HELP: "Equipment Connection" to obtain more information regarding instrument displays.
8