

Название-Сеть в Играх 2006год_Язык-Eng
.pdf164 Networking and Online Games: Understanding and Engineering Multiplayer Internet Games
Inter-packet arrival distribution: Wolfenstein Enemy Territory snapshots
|
12 |
|
|
|
|
|
|
|
|
|
|
10 |
|
|
|
|
|
|
|
|
|
|
8 |
|
|
|
|
|
|
|
|
|
% |
6 |
|
|
|
|
|
|
|
|
|
|
4 |
|
|
|
|
|
|
|
|
|
|
2 |
|
|
|
|
|
|
|
|
|
|
0 |
40 |
50 |
60 |
70 |
80 |
90 |
100 |
110 |
120 |
|
30 |
Interval (milliseconds)
20 snapshots/sec |
10 snapshots/sec |
30 snapshots/sec |
15 snapshots/sec |
Figure 10.14 Inter-packet intervals for Wolfenstein ET snapshots towards a single client
10.4.1 Example: Wolfenstein Enemy Territory Snapshots
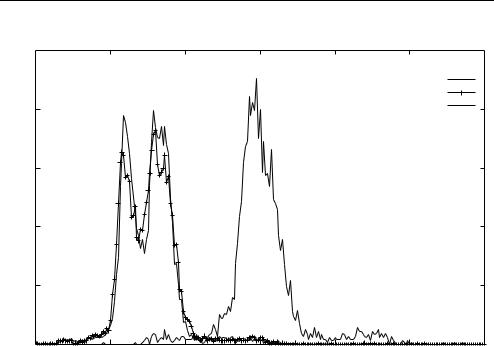
Figure 10.14 shows the inter-packet intervals for snapshot traffic from a Wolfenstein ET server to a single client. The client was approximately 12 hops and 15–20 ms away from the server over a regular (consumer grade) broadband Internet connection. Measurements were taken at the client end. There are four histograms, corresponding to the client requesting 10, 15, 20 and 30 snapshots per second. We can clearly see that the server has quantised the snapshot rate to an integer multiple of the server’s internal tick interval of 50 ms when 20 or 30 snapshots/second are requested, and 100 ms when 10 or 15 snapshots/second are requested.
Figure 10.15 shows the inter-packet intervals for command traffic from a Wolfenstein ET client to its server (measured at a server 15 hops from the client).
10.4.2 Example: Half-life 2 Snapshots and Client Commands
Figure 10.16 illustrates the difference between HL2’s snapshot transmission strategy and that of ET. As with Figure 10.14, the client is 12 hops (roughly 15–20 ms) from the server, inter-packet intervals are being measured at the client and the four histograms correspond to the client requesting 30 and 50 snapshots per second. At 30 snapshots per second, the HL2 server emits a stream of snapshot packets having a mixture of 30 ms and 45 ms intervals. At 50 snapshots per second, the actual snapshot stream is a mix of

Online Game Traffic Patterns |
165 |
|
|
Inter-packet interval distributions: Wolfenstein Enemy Territory client commands to server
25 |
|
|
|
|
|
|
20 |
|
|
|
|
|
|
15 |
|
|
|
|
|
|
% |
|
|
|
|
|
|
10 |
|
|
|
|
|
|
5 |
|
|
|
|
|
|
0 |
10 |
20 |
30 |
40 |
50 |
60 |
0 |
||||||
|
|
|
Interval (milliseconds) |
|
|
|
Figure 10.15 Inter-packet intervals for Wolfenstein ET command traffic from client to server
Inter-packet arrival distribution: Half-life 2 snapshots
|
4 |
|
|
|
|
|
|
|
3.5 |
|
|
|
|
50 snapshots/sec |
|
|
|
|
|
|
|
30 snapshots/sec |
|
|
3 |
|
|
|
|
|
|
|
2.5 |
|
|
|
|
|
|
% |
2 |
|
|
|
|
|
|
|
1.5 |
|
|
|
|
|
|
|
1 |
|
|
|
|
|
|
|
0.5 |
|
|
|
|
|
|
|
0 |
10 |
20 |
30 |
40 |
50 |
60 |
|
0 |
||||||
|
|
|
|
Interval (milliseconds) |
|
|
|
Figure 10.16 Inter-packet intervals for Half-life 2 snapshots to one client (30 and 50 snapshots per second)
166 Networking and Online Games: Understanding and Engineering Multiplayer Internet Games
Inter-packet arrival distribution: Half-life 2 snapshots
5 |
|
|
|
|
|
|
|
|
|
|
|
80 snapshots/sec |
|
|
|
|
|
|
66 snapshots/sec |
|
4 |
|
|
|
|
33 snapshots/sec |
|
|
|
|
|
|
|
|
3 |
|
|
|
|
|
|
% |
|
|
|
|
|
|
2 |
|
|
|
|
|
|
1 |
|
|
|
|
|
|
0 |
|
|
|
|
|
|
0 |
10 |
20 |
30 |
40 |
50 |
60 |
|
|
|
Interval (milliseconds) |
|
|
|
Figure 10.17 Inter-packet intervals for Half-life 2 snapshots to one client (33, 66 and 80 per second)
15 ms and 30 ms intervals. The average snapshot rate is what the client requested, but the actual inter-packet interval distributions are bi-modal.
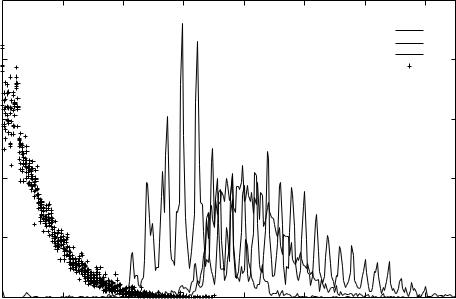
HL2’s inter-packet interval distributions for 33, 66 and 80 snapshots per second are shown in Figure 10.17. Since 33 snapshots per second is an even multiple of the tick timer, the distribution has a single peak at 30 ms. At 66 and 80 snapshots per second, we see identical distributions around 15 ms. Because of the way HL2 orders updates to individual clients per tick, the nominal 15 ms peak in the histogram appears as two peaks closely straddling 15 ms ( 12 ms and 18 ms).
Figure 10.18 shows the inter-packet interval distributions of client-to-server HL2 traffic as measured at a server. In this case, there were eight clients playing at the same time. We have plotted the inter-packet intervals of three representative clients and of the aggregate traffic from all eight clients as seen by the network link coming into the server. Two things are noteworthy.
•Each client has quite a distinct distribution of its own (because of client-side settings, CPU speed, graphics cards and player activity).
•The aggregate distribution is clustered well below the mean interval of each client
(because client-to-server command traffic is not synchronised across clients).
Online Game Traffic Patterns |
167 |
|
|
Inter-packet interval distributions: Half-life 2 client commands to server
5 |
|
|
|
|
|
|
|
|
|
|
|
|
|
Client 1 |
|
|
|
|
|
|
|
Client 2 |
|
4 |
|
|
|
|
|
Client 3 |
|
|
|
|
|
|
All 8 Clients |
|
|
|
|
|
|
|
|
|
|
3 |
|
|
|
|
|
|
|
% |
|
|
|
|
|
|
|
2 |
|
|
|
|
|
|
|
1 |
|
|
|
|
|
|
|
0 |
10 |
20 |
30 |
40 |
50 |
60 |
70 |
0 |
|||||||
|
|
|
Interval (milliseconds) |
|
|
|
|
Figure 10.18 Inter-packet intervals for Half-life 2 client commands towards the server (three clients and aggregate of eight clients)
10.5 Estimating the Consequences
Many discussions of online games characterise game traffic in average ‘packet per second’ (pps) or ‘bits per second’ (bps) rates. Average packets per second is the inverse of the average inter-packet interval (for example, a 50 ms inter-packet interval equates to 20 packets per second). Bits per second represents the length of the average packet multiplied by the number of packets per second.
Unfortunately, the attractive simplicity of such single-value metrics hides the packet-by-packet realities revealed in packet-size distribution and inter-packet interval distributions.
For example, consider a Quake III Arena server with 15 players sending update packets every 50 ms to each client (default client settings). This server is transmitting 300 packets per second for an average inter-packet arrival time of 3.3 ms. If the average packet size was160bytes (not unreasonable given Figure 10.7), that would equate to 384 Kbit/second. However, as we know from direct traffic measurement, this stream is not uniform. Every 50 ms the server sends 15 packets back to back, as fast as possible – limited only by the server’s hardware and local link speed.
Assume that link speed is the limiting factor, and the server is on a 100 Mbit/second ethernet connection. An average IP packet of 160 bytes translates to roughly 1472 bit-

168 Networking and Online Games: Understanding and Engineering Multiplayer Internet Games
times on the ethernet [add 12 bytes for source and destination media access control (MAC) address, 2 bytes for ethernet type field, 4 bytes ethernet cyclic redundancy check (CRC) and 64 bit-times inter-frame preamble]. This translates to 15 micro-seconds per IP packet, or 225 micro-seconds per burst. (Alternatively, this equates to a burst at roughly 67 K packets per second every 50 ms.)
The situation is substantially different if we consider the local server’s link to be a 1.522 Mbit/second T1 link. For simplicity, let us assume 8 bytes overhead (e.g. for Point to Point Protocol (PPP), encapsulation [RFC1661]), so the average 160byte packet becomes 168 bytes, or 1344 bits long. Each packet now takes 883 micro-seconds to transmit at 1.522 Mbit/second, and it takes 13.2 ms to send all 15 packets back-to-back. Thus, for 13.2 ms out of every 50 ms, the server transmits at 1136 packets per second.
These two examples show that the server’s local link speed has a big impact on how bursty the server’s outbound traffic will appear at early router hops along the path out towards the clients. In neither case does the server impose an even load of 300 packets per second on the network. In the latter case the regular update packets for the 1st and 15th clients are almost 12 ms apart.
Of course, the mean packet size can be quite misleading too. As Figure 10.7 suggests, depending on map type and number of players, a Quake III Arena server might easily find itself sending a burst of 300 byte packets at any given moment. Assume that at a particular instant the server update sends 15 packets of 350 bytes each. This translates to a worstcase instantaneous link bandwidth requirement of more like 840 Kbit/second – rather more than the nominal 384 Kbit/second calculated previously using average packet sizes. (The burst length would be 449 micro-seconds and 28 ms long at 100 Mbit/second and 1.522 Mbit/second respectively.)
The probability of such a worst-case burst happening depends on correlation (or lack of it) between the packet-size distributions of each server-to-client stream. Establishing this knowledge requires the kind of detailed traffic measurement discussed in section 10.1. Nevertheless, we can see that, for example, a 15-player Quake III Arena server could not reliably send client update packets with predictable latency if the local link was under 840 Kbit/second. (If you had provisioned a 512 Kbit/second link instead, there would be occasions when the Quake III Arena server would be unable to transmit all 15 update packets within a 50 ms update interval. Most likely this would cause update packets to briefly queue up inside the operating system of the server’s host machine, adding temporary jitter to some of the server-to-client packet streams.)
10.6 Simulating Game Traffic
When an ISP wishes to explore the consequences of new network designs or deployment of new applications, it is generally impractical to simply build the new network and test it. The alternative is to simulate the interactions between new network configurations and new types of networked applications. Two questions arise from measurement of actual game traffic. First, can we create simulated traffic generators with similar statistical properties. Second, can we reasonably extrapolate from small numbers of clients to simulate the consequences of large client populations.
At least for a number of FPS games, it is not difficult to construct reasonably accurate statistical traffic generator functions. Some of the earliest work analysed Doom

Online Game Traffic Patterns |
169 |
|
|
[BORELLA99] without quite taking it to the level of simulation tool traffic generators. Subsequent work ([LANG2003, LANG2004] and [ZANDER2005a]) developed models for Half-life, Quake III Arena and Halo 2 respectively that could be used to specify ns-2 [NS2SIM] traffic generators.
Our aim is to approximate empirically observed traffic characteristics with a pre-existing statistical model that is both ‘good enough’ and simple to implement. (All other things being equal, simple traffic generator functions increase the speed with which simulations run and the scale of network topologies that can be simulated.)
10.6.1 Examples from Halo 2 and Quake III Arena
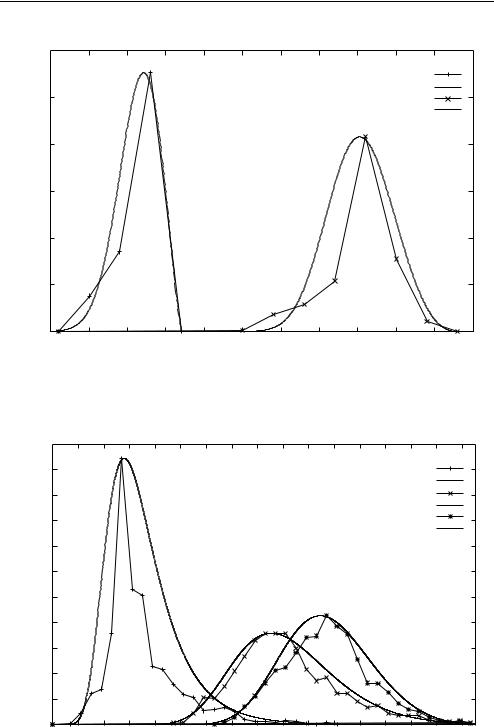
As an example, Halo 2’s client-to-server inter-packet arrival times can be modelled as a normal distribution, while the server-to-client times were better approximated by an extreme distribution [ZANDER2005a]. Figure 10.19 shows the relationship between measured and synthesised intervals using the normal distribution for client-to-server traffic. (QQ-plots in [ZANDER2005a] show that errors in the synthesised distributions become noticeable only for 2 % of client-to-server traffic in the tails and 5 % of server-to-client traffic in the tails.)
Extreme distributions create a good match to packet sizes in each direction (Figure 10.20 and Figure 10.21).
Measured versus synthesised Halo 2 client-to-server inter-packet arrival distributions
14 |
|
|
|
|
|
|
|
|
|
|
|
Measured |
|
12 |
|
|
|
|
Synthesised |
|
|
|
|
|
|
|
|
10 |
|
|
|
|
|
|
8 |
|
|
|
|
|
|
% |
|
|
|
|
|
|
6 |
|
|
|
|
|
|
4 |
|
|
|
|
|
|
2 |
|
|
|
|
|
|
0 |
|
|
|
|
|
|
34 |
36 |
38 |
40 |
42 |
44 |
46 |
|
|
Inter-packet interval (milliseconds) |
|
|
||
Figure 10.19 Measured and synthesised Halo 2 inter-packet arrival times for client-to-server traffic
170 Networking and Online Games: Understanding and Engineering Multiplayer Internet Games
Measured versus synthesised Halo 2 client-to-server packet size distributions
|
60 |
|
|
|
|
|
|
|
|
|
|
|
|
|
|
|
|
|
|
|
|
1 player (measured) |
|
||
|
50 |
|
|
|
|
|
|
|
1 player (synthesised) |
|
||
|
|
|
|
|
|
|
|
4 players (measured) |
|
|||
|
|
|
|
|
|
|
|
4 players (synthesised) |
|
|||
|
40 |
|
|
|
|
|
|
|
|
|
|
|
% |
30 |
|
|
|
|
|
|
|
|
|
|
|
|
20 |
|
|
|
|
|
|
|
|
|
|
|
|
10 |
|
|
|
|
|
|
|
|
|
|
|
|
0 |
60 |
70 |
80 |
90 |
100 |
110 |
120 |
130 |
140 |
150 |
160 |
|
50 |
|||||||||||
|
|
|
|
|
|
Packet size (bytes) |
|
|
|
|
|
|
Figure 10.20 Measured and synthesised Halo 2 packet sizes for client-to-server traffic
Measured versus synthesised Halo 2 server-to-client packet size distributions
22 |
|
|
|
|
|
|
|
|
|
|
|
|
|
20 |
|
|
|
|
|
|
|
|
3 players (measured) |
|
|||
|
|
|
|
|
|
|
|
|
3 players (synthesised) |
|
|||
18 |
|
|
|
|
|
|
|
|
8 players (measured) |
|
|||
|
|
|
|
|
|
|
|
|
8 players (synthesised) |
|
|||
16 |
|
|
|
|
|
|
|
|
11 players (measured) |
|
|||
|
|
|
|
|
|
|
11 players (synthesised) |
|
|||||
|
|
|
|
|
|
|
|
|
|||||
14 |
|
|
|
|
|
|
|
|
|
|
|
|
|
12 |
|
|
|
|
|
|
|
|
|
|
|
|
|
% |
|
|
|
|
|
|
|
|
|
|
|
|
|
10 |
|
|
|
|
|
|
|
|
|
|
|
|
|
8 |
|
|
|
|
|
|
|
|
|
|
|
|
|
6 |
|
|
|
|
|
|
|
|
|
|
|
|
|
4 |
|
|
|
|
|
|
|
|
|
|
|
|
|
2 |
|
|
|
|
|
|
|
|
|
|
|
|
|
0 |
|
|
|
|
|
|
|
|
|
|
|
|
|
70 |
90 |
110 |
130 |
150 170 |
190 |
210 |
230 250 |
270 |
290 310 |
330 |
350 |
370 |
390 |
Packet size (bytes)
Figure 10.21 Measured and synthesised Halo 2 packet sizes for server-to-client traffic
Online Game Traffic Patterns |
171 |
|
|
// client to server traffic model setMillisecondTimer(Random::normal(40,1))
...
timerExpired() {
case numberOfPlayers == 1 :
pktSize = Random::extreme(71.2, 5.7) case numberOfPlayers == 2 :
pktSize = Random::extreme(86.9, 5.1)
...
// round to nearest 8 byte packet size pktSize = round((pktSize-52)/8)*8 + 52 sendPkt(pktSize)
}
Figure 10.22 ns-2 code fragment for generating Halo 2 client-to-server traffic
An ns-2 code fragment to generate client-to-server packet traffic would look something like Figure 10.22 [ZANDER2005a]. (In this case the code utilises extreme distributions with different parameters depending on the number of players on the simulated client. The ns-2 code also mimics Halo 2’s generation of packet lengths rounded to specific multiples of eight.)
A similar example is the analysis of Quake III Arena traffic performed in [LANG2004]. The authors ascertained that server-to-client packet-size distribution could be modelled as a lognormal (‘. . . with mean 79.340,543 and standard deviation 0.24,507,092’) for a two-client game, plus one additional exponential (with mean 13) for every additional client.
The code fragment in Figure 10.23 shows how easy this is to incorporate into ns-2. Here we simplistically assume that the packet generation occurs precisely every 50 ms (timer interval) and focus on the random variation in packet size depending on the number of clients. We also assume that every client receives a packet of the same size in each update interval. A more sophisticated ns-2 traffic generator model would randomise the packet size for each client, and slightly randomise the inter-packet intervals to match observed jitter in server-to-client transmissions.
It is not possible to itemise every possible traffic generator. What we should take from the preceding section is the knowledge that it is quite easy to simulate new network scenarios with relatively accurate models of game traffic.
/* the packet size is dependent on the number of players */ /* it is the base packet size distribution (for 2 players) */
/* plus a negative exponential with mean 13 for every additional player */ size_ = int (Random::lognormal(79.340543, 0.24507092));
for (int i=3; i<=nrOfPlayers; i++)
size_ += int (Random::exponential(13)); /* send one packet to each player */ for (int i=1; i<=nrOfPlayers; i++)
send(size_);
/* schedule the next transmission */ /* interval_ is 0.05 sec */
timer_.resched(interval_);
Figure 10.23 ns-2 code fragment for generating Quake III Arena server-to-client traffic

172 Networking and Online Games: Understanding and Engineering Multiplayer Internet Games
10.6.2 Extrapolating from Measurements with Few Clients
Recent analysis of FPS traffic models suggests that we can plausibly synthesise traffic with many clients from the models developed by measuring traffic for only a small number of clients [BRANCH2005].
Given n clients connected to the server, each server-to-client snapshot packet carries state-change information derived from all n client-to-server command messages received in the previous snapshot interval (roughly speaking). Thus, the size distribution of the server-to-client snapshot packets can be approximated by the convolution of n client- to-server packet-size distributions plus a small negative exponential function. Analysis in [BRANCH2005] showed that, starting with a simple client-to-server packet-distribution model we could reasonably predict the server-to-client packet-size distributions actually measured for four, six and eight-player games of Quake III Arena. This principle is expected to hold for higher numbers of players and similar FPS games (since the logical extrapolation makes very limited assumptions about the underlying game engine design).
References
[BELLOVIN2002] S. Bellovin, “A Technique for Counting NATted Hosts”, Proceedings of Second Internet Measurement Workshop, November 2002.
[RFC1661] W. Simpson (editor), “The Point-to-Point Protocol (PPP),” STD 51, RFC 1661, July 1994. [BORELLA99] M.S. Borella, “Source models of network game traffic”, Proceedings of networld+interop ’99,
Las Vegas, NV, May 1999.
[BRANCH2005] P. Branch and G. Armitage, “Towards a General Model of First Person Shooter Game Traffic”, CAIA Technical Report 050928A, Centre for Advanced Internet Architectures, Swinburne University of Technology, Australia, September 2005. (http://caia.swin.edu.au/reports/050928A/CAIA-TR- 050928A.pdf)
[ETHEREAL] Ethereal, “Ethereal: A Network Protocol Analyzer”, http://www.ethereal.com/ as of July 2005.
[FREEBSD] FreeBSD, “FreeBSD: The Power to Serve”, The FreeBSD Project, http://www.freebsd.org as of July 2005.
[HALFLIFE] Planet Half-Life, http://www.planethalflife.com/half-life/, Accessed 2006. [HALFLIFE2004] H A L F – L I F E 2, http://half-life2.com, 2004.
[HALO2004] Bungie.net, “Bungie.net : Games : Halo 2”, http://www.bungie.net/Games/Halo2/, 2004. [HL2NTWK] “Source Multiplayer Networking”, http://developer.valvesoftware.com/wiki/Source Multiplayer
Networking, as of August 2005.
[LANG2003] T. Lang, G. Armitage, P. Branch and H-Y. Choo, “A Synthetic Traffic Model for Half Life”, Australian Telecommunications Networks & Applications Conference 2003, (ATNAC 2003), Melbourne, Australia, December 2003.
[LANG2004] T. Lang, P. Branch and G. Armitage, “A Synthetic Traffic Model for Quake 3”, ACM SIGCHI ACE2004 conference, Singapore, June 2004.
[LINUX] Linux Online Inc, “Linux Online!”, http://www.linux.org as of July 2005.
[NS2SIM] “The Network Simulator–ns–2”, http://www.isi.edu.nsnam/ns/ (as of January 2006).
[QUAKE3] id Software, “id Software: Quake III Arena,” http://www.idsoftware.com/games/quake/quake3arena/, Accessed 2006.
[TCPDUMP] “tcpdump/libpcap,” http://www.tcpdump.org as of July 2005.
[WET2005] “Wolfenstein,” http://games.activision.com/games/wolfenstein as of October 2005.
Online Game Traffic Patterns |
173 |
|
|
[WINDOWS] Microsoft, http://www.microsoft.com as of July 2005.
[ZANDER2005a] S. Zander and G. Armitage, “A Traffic Model for the XBOX Game Halo 2”, 15th ACM International Workshop on Network and Operating System Support for Digital Audio and Video (NOSSDAV 2005), Washington, USA, June 2005.