

Название-Сеть в Играх 2006год_Язык-Eng
.pdf144 Networking and Online Games: Understanding and Engineering Multiplayer Internet Games
9.2.2 An Example Using Wolfenstein Enemy Territory
Figure 9.8 shows broadly similar daily variations experienced by two small Wolfenstein Enemy Territory (ET) servers [WET2005] hosted on the east coast of Australia during late 2004 (data collected over 20 weeks, with each server allowing a maximum of 20 players) [ZANDER2005b]. Usage is revealed by plotting the average number of IP flows associated with actual game play in any given hour of the day. The volume of traffic (in Mbytes) associated with these game-play flows shows the same cyclical fluctuation.
One of the ET servers was located at Swinburne University of Technology (Swinburne) in Melbourne, Australia. The other server was located in Canberra, Australia, on GrangeNet (an experimental, high-speed research network [GRANGE2005]). The CAIA server shows distinct use every afternoon and early evening that drops off by midnight. The GrangeNet server saw only intermittent activity, some days having no players at all. Yet the cycle, such as it is, follows a similar afternoon/evening pattern.
9.2.3 Relationship to Latency Tolerance
As noted in Chapter 7, most players of highly interactive games will come from within a certain ‘radius’ of tolerable latency. More latency-tolerant games are likely to see their usage cycles spread out somewhat over any given 24-hour period. Latency tolerance translates to a greater number of time zones that might find a given server to be within
Average IP flows (game-play) per hour (Wolfenstein Enemy Territory)
|
12 |
|
|
|
|
|
|
|
|
|
|
|
|
|
10 |
|
|
|
|
|
|
|
|
|
|
|
|
flows |
8 |
|
|
|
|
|
|
|
|
|
|
|
|
of IP |
|
|
|
|
|
|
|
|
|
|
|
|
|
number |
6 |
|
|
|
Swinburne server |
|
|
|
|
|
|
|
|
|
|
|
|
Grangenet server |
|
|
|
|
|
|
|
||
|
|
|
|
|
|
|
|
|
|
|
|
|
|
Average |
4 |
|
|
|
|
|
|
|
|
|
|
|
|
|
|
|
|
|
|
|
|
|
|
|
|
|
|
|
2 |
|
|
|
|
|
|
|
|
|
|
|
|
|
0 |
2 |
4 |
6 |
8 |
10 |
12 |
14 |
16 |
18 |
20 |
22 |
24 |
|
0 |
||||||||||||
Hour of the day (East coast Australia)
Figure 9.8 Average number of game-play IP flows per hour on two Wolfenstein Enemy Territory servers in Australia
Where Do Players Come from and When? |
145 |
|
|
an acceptable latency of the players. Consequently, there is a better chance that someone somewhere might find your server(s) interesting enough to play on regardless of local time at the server.
9.3 Server-discovery (Probe Traffic) Trends
Compared to the traffic generated by actual game play, it is easy to overlook the networkwide traffic caused by in-client and third-party server-discovery mechanisms. This probe traffic rises and falls as people turn their game clients on and off, because it derives simply from the act of seeking out servers rather than actually playing on them. It is the ‘background microwave radiation’ of online game networks, and reveals something about where potential (rather than actual) players reside.
9.3.1 Origins of Probe Traffic
Many First Person Shooter (FPS) games provide an in-game server-discovery function to assist players in finding active game servers on the Internet. The game’s publisher typically establishes one or more ‘master servers’ to hold lists of currently active game servers. The addresses of these master servers are encoded into the game client software.
A player may trigger an automated search process to find game servers of interest. The client queries an appropriate master server, gets back a list of IP addresses representing current game servers, and then proceeds to automatically query each and every server in the list. The queries return information such as server type, current map, number of players and/or teams, number of available player slots, and so on.
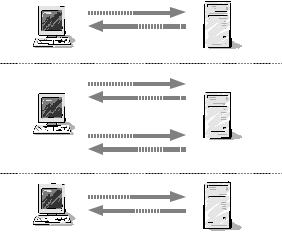
Using Wolfenstein ET as the example, Figure 9.9 illustrates how a client discovers active game servers. First, a short UDP packet containing the text ‘getservers’ is transmitted to etmaster.idsoftware.com:27950. This triggers a reply of one or more UDP packets containing ‘getserversResponse’ followed by a list of IP address, port number pairs in
Retrieve list of |
|
getservers |
Master server |
|
|
||
all current |
Client |
|
|
|
etmaster.idsoftware.com |
||
game servers |
|
getserversResponse |
UDP port 27950 |
|
|
||
|
|
1...N |
|
|
|
getinfo |
|
Probe some or |
Client |
infoResponse |
Game server(s) |
all current |
|||
game servers |
|
getstatus |
1...N |
|
|
||
|
|
statusResponse |
|
Begin playing |
|
connect |
|
on a selected |
Client |
|
Game server |
game server |
|
||
|
|
|
(game begins)
Figure 9.9 Sources of probe traffic: Finding and joining a Wolfenstein Enemy Territory server
146 Networking and Online Games: Understanding and Engineering Multiplayer Internet Games
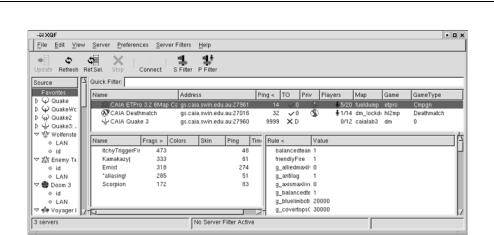
Figure 9.10 XQF – An open-source server-discovery tool
binary format. (These pairs represent the IP addresses and UDP port numbers of remote Wolfenstein ET game servers that have registered with the master server.)
Armed with the getserversResponse list, the client then proceeds to interrogate each listed game server. First, ‘getinfo’ elicts an ‘infoResponse’ containing basic server configuration information. Then ‘getstatus’ elicits a ‘statusResponse’ containing a detailed list of current players and game information.
The same basic approach is used by other FPS games such as Half-life, Quake III Arena, Half-life 2, etc. Packet sniffing tools (such as tcpdump and ethereal, noted earlier) can be used to observe and dissect the server-discovery packet exchange. (Ethereal has one advantage over tcpdump in this situation – it can decode Quake III Arena/Wolfenstein ET probe traffic.)
An extremely useful tool is the open-source program QStat [QSTAT05]. With Qstat, you can easily probe a wide range of master servers and game servers, archiving the parsed and interpreted replies in text files or piping them to other programs for real-time display. For example, the open-source program ‘xqf’ [XQF05] provides a GUI front-end for QStat under X11/UNIX and knows about a wide collection of current and old FPS games (Figure 9.10).
9.3.2 Probe Traffic Trends
Although the individual query/response packets are small and the exchange is brief, thousands of clients per day across the planet can create a substantial ‘background traffic’ over days and weeks.
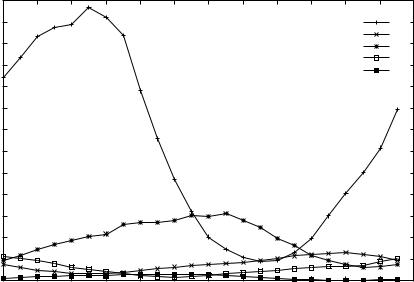
Some insight into probe traffic patterns can be obtained from the previously mentioned study of two Wolfenstein ET servers in Australia. Figure 9.11 shows the daily cycle of probe traffic seen by the Swinburne server broken out by approximate source region – Europe, Australia, North America, Asia and South America [ZANDER2005b]. (GrangeNet’s results were virtually identical.)
Where Do Players Come from and When? |
147 |
|
|
Average IP flows (probes) per hour (Wolfenstein Enemy Territory)
|
6500 |
|
|
|
|
|
|
|
|
|
|
|
|
|
6000 |
|
|
|
|
|
|
|
|
|
Europe |
|
|
|
5500 |
|
|
|
|
|
|
|
|
|
Australia |
|
|
|
|
|
|
|
|
|
|
|
North America |
|
|
||
|
5000 |
|
|
|
|
|
|
|
|
|
Asia |
|
|
|
|
|
|
|
|
|
|
|
South America |
|
|
||
IP flows |
|
|
|
|
|
|
|
|
|
|
|
||
4500 |
|
|
|
|
|
|
|
|
|
|
|
|
|
4000 |
|
|
|
|
|
|
|
|
|
|
|
|
|
of |
3500 |
|
|
|
|
|
|
|
|
|
|
|
|
number |
|
|
|
|
|
|
|
|
|
|
|
|
|
3000 |
|
|
|
|
|
|
|
|
|
|
|
|
|
|
|
|
|
|
|
|
|
|
|
|
|
|
|
Average |
2500 |
|
|
|
|
|
|
|
|
|
|
|
|
2000 |
|
|
|
|
|
|
|
|
|
|
|
|
|
|
|
|
|
|
|
|
|
|
|
|
|
|
|
|
1500 |
|
|
|
|
|
|
|
|
|
|
|
|
|
1000 |
|
|
|
|
|
|
|
|
|
|
|
|
|
500 |
|
|
|
|
|
|
|
|
|
|
|
|
|
0 |
2 |
4 |
6 |
8 |
10 |
12 |
14 |
16 |
18 |
20 |
22 |
24 |
|
0 |
||||||||||||
Hour of the day (East coast Australia)
Figure 9.11 Probe traffic per region on Wolfenstein Enemy Territory server in Australia
A number of things are interesting when considered in light of the game-play trends seen in Figure 9.8:
•Both servers saw virtually identical levels of probe traffic despite distinctly different levels of game play.
•Probe traffic trends follow an entirely different time line to the game-play trends.
•The number of probe flows vastly outnumbers the number of game-play flows (by a few orders of magnitude).
This can be explained by observing that probe traffic is dominated by clients who are searching for playable servers, whereas game play is dominated by clients who have found and joined an acceptable server. The former group depends on the demographics of game ownership whilst the latter is more affected by latency, location and server configuration. In Figure 9.11, the probe traffic was dominated by European clients (peaking around 5 am local time), with North American clients coming in distant second (peaking around 1:30 pm local time). Probes from any particular region peak when it is, broadly speaking, afternoon or evening in that particular region.
There is another lesson here. No matter how small you intend your public server to be, you will attract a certain level of probe traffic from around the world simply because you have registered with the master servers. Probe traffic is hard to predict or

148 Networking and Online Games: Understanding and Engineering Multiplayer Internet Games
control locally because it is unrelated to any configuration options on your server itself. (For example, despite their different popularities with actual players the Swinburne and GrangeNet servers each saw around 8 GB of probe traffic across 16 million IP flows during the 20-week period.)
9.4 Mapping Traffic to Player Locations
For marketing and customer-support purposes, it is useful to establish the geographic regions from which your players will (or do) originate. One server-side approach is to map the source IP addresses of clients back to approximate geographic regions (using one of the various ‘geo location’ services whose databases try to track which ISPs, and hence which locations, have been assigned different IP address ranges). Another approach is to establish the latency tolerance of players on a particular game type (as discussed in Chapter 7), and infer from this an upper limit on the physical distance players are likely to be from your server (a ‘latency radius’).
9.4.1 Mapping IP Addresses to Geographic Location
Client IP addresses can be extracted from both game play and probe traffic to approximately identify the client’s location. In Figure 9.11, the regions were identified using the services of MaxMind’s free GeoLite Country Database [MAX2005]. At the time of writing, this resource claimed 97 % accuracy in mapping IP addresses to country codes in their free offering, with higher levels of accuracy and resolution (to the level of states and cities) in their commercial offerings.
A similar service, Geobytes [GEO2005], was used in 2003 to create a world map showing geographic distributions of Half-life: Counter-strike players and servers around the planet [FEN2003]. By calculating the ‘great circle’ distance between clients (using latitude and longitude information returned by Geobytes) and a specific game server, the authors showed cyclical patterns consistent with the ‘people play in their local afternoon and evening’ evidence in Figure 9.6 and Figure 9.8.
A further technique is to reverse-lookup client IP addresses into their domain name form. An ISP’s own name will often be revealed. In addition, many ISPs embed regionspecific codes and names into the domain names of IP addresses attached to customer links. This method was used in [ARM2003] to confirm that players on the Californian and London servers in Figure 9.6 did come largely from ISPs based close to California and London, respectively.
These techniques are likely to be only modestly accurate and not always consistent. An ISP rarely has much commercial incentive for providing enough detailed internal topological knowledge for others to map the ISP’s IP addresses to geography. Nor can ISP domain naming schemes be relied upon. Since the names are only required to be useful to the ISP’s internal operations staff, there is no guarantee they would use geographically meaningful names or sub-domains. Consequently, IP to country/city mapping databases do, of necessity, include some approximations and guesses.
For example, on the day this chapter was written the author’s home broadband connection had been assigned IP address ‘144.133.92.248’. Doing a reverse DNS

Where Do Players Come from and When? |
149 |
|
|
lookup returned the domain name (customer premises equipment) ‘CPE-144-133-92- 248.vic.bigpond.net.au’. We might decode this as CPE device ‘144-133-92-248’ located in Victoria (the ‘vic’ service region) of the Bigpond ISP (owned by Telstra, Australia’s dominant telephone company). The geographic detail is ‘vic’ and the author was indeed in the city of Melbourne in the state of Victoria at the time. Interestingly, on the same day Geobytes reported this IP address was located in Sydney – about 713 kms away in a different Australian state of New South Wales. (The free MaxMind country database correctly identified the IP address range 144.130/16 to 144.140/16 as being in Australia. But this is far more coarsely grained information.)
9.4.2 Mapping by Latency Tolerance
Establishing latency tolerance requires either controlled lab trials or weeks of monitoring live game-play traffic patterns. (Probe traffic does not help much in this case. We know that someone has probed our server, but we do not know why they did or did not choose to subsequently join.)
Identifying the associated geographical boundaries on your likely player population is, however, non-trivial. A rough approximation would be as follows: Take Z to be some fraction of the speed of light and L to be the latency tolerance of your game. Thus, R = Z × L is the physical radius from your server that would encompass most of your happy players. We take Z as a fraction of the speed of light because, as discussed in Chapter 5, geographically close players experience additional latency due to convoluted IP layer paths, serialisation delays on slow links, and queuing delays in congested parts of the Internet.
Lab trials have the limitation that you only know a game’s latency tolerance, and are left with imprecise methods (such as that described above) to identify geographic areas. Measuring latency tolerance from public server usage patterns is slightly better because you also gain the IP addresses of actual clients who have played. A refined estimation of player location combines latency readings with IP-to-location mapping as discussed above. In addition, armed with the IP addresses of actual clients known to have frequented your server, you can use tools such as traceroute (as discussed in Chapter 5) to measure the paths back to each client. This information, along with time to live (TTL) data revealed in every client’s inbound packet to your server, can provide further insights into the relationship between latency tolerance and a player’s actual geographical location on the planet.
References
[ARM2003] G. Armitage, “An Experimental Estimation of Latency Sensitivity in Multiplayer Quake 3”, 11th IEEE International Conference on Networks (ICON 2033), Sydney, Australia, September 2003.
[ETHEREAL] “Ethereal: A Network Protocol Analyzer”, http://www.ethereal.com/ (as of July 2005). [FEN2003] Wu-chang Feng, Wu-chi Feng, “On the Geographic Distribution of Online Game Servers and Play-
ers”, In Proceedings of NetGames, 2003, May 2003.
[FREEBSD] The FreeBSD Project, “FreeBSD: The Power to Serve”, http://www.freebsd.org (as of July 2005). [GEO2005] Geobytes, “Geobytes Home Page”, http://www.geobytes.com/, 2005.
[GRANGE2005] GrangeNet, http://www.grangenet.net/ (as of July 2005).
[LINUX] Linux Online Inc,“Linux Online!”, http://www.linux.org (as of July 2005).
[MAX2005] MaxMind, “GeoLite Country Database IP Country”, http://www.maxmind.com/app/geoip country, 2005.

150 Networking and Online Games: Understanding and Engineering Multiplayer Internet Games
[QSTAT05] S. Jankowski, “Qstat – Real-time Game Server Status”, http://www.qstat.org/, 2005.
[QUAKE3] id Software, “id Software: Quake III Arena”, http://www.idsoftware.com/games/quake/quake3arena/, 2003.
[TCPDUMP] “tcpdump/libpcap”, http://www.tcpdump.org (as of July 2005).
[WET2005] Wolfenstein, http://games.activision.com/games/wolfenstein (as of October 2005). [WINDOWS] Microsoft, http://www.microsoft.com (as of July 2005).
[XQF05] XQF Game Server Browser, http://www.linuxgames.com/xqf/index.shtml, 2005.
[ZANDER2005b] S. Zander, D. Kennedy, G. Armitage, “Dissecting Server-Discovery Traffic Patterns Generated by Multiplayer First Person Shooter Games”, NetGames 2005, pages 10–11, New York, USA, October 2005.

10
Online Game Traffic Patterns
It is important to understand a number of online game traffic characteristics when planning new network services or trying to improve existing services. As noted in Chapter 9, many Internet-based games today use a client–server network communications model. The Internet Protocol (IP) service experienced by clients of an online game is influenced by the impact of the game’s own traffic patterns on the network. Keeping in mind the issues from Chapters 5 and 7, an Internet Service Provider (ISP) who wishes to keep its game playing customers happy requires insights into the competing traffic patterns on its network.
Online games exhibit different patterns and characteristics relative to non–real-time applications (such as email, web surfing and many streaming video/audio applications). Game developers must also consider how their game’s communication model translates to actual packet traffic pattern. Where possible, information flow should be smooth rather than bursty, to assist ISPs in managing their infrastructure to deliver better service to game players.
In Chapter 9, we looked at the daily and weekly trends reflecting aggregate join/play/ leave cycles of game players themselves. Such statistics help in the provisioning of game servers and long-term sizing of links close to the servers. In this chapter, we will take a closer look at packet-by-packet statistics during game play itself – packet-size distributions and inter-packet arrival times.
These provide an insight into the burstiness of game traffic as perceived by the network, and can be used to model the impact of game traffic on router queues that are being shared with other traffic.
Game traffic can also be divided along the following lines:
•Game-play traffic for which real-time interactivity requirements apply (during a game in progress).
•Signalling/support traffic for which best effort IP service is adequate (for example, server discovery probing, automated map and skin/avatar downloads and patch updates).
In the rest of this chapter we will look at how to measure in-game traffic, provide some examples of traffic patterns from some well-known First Person Shooter (FPS) games and look at how well the game traffic can be simulated and extrapolated from empirical measurements.
Networking and Online Games: Understanding and Engineering Multiplayer Internet Games
Grenville Armitage, Mark Claypool, Philip Branch 2006 John Wiley & Sons, Ltd

152 Networking and Online Games: Understanding and Engineering Multiplayer Internet Games
10.1 Measuring Game Traffic with Timestamping Errors
As noted in Chapter 9, it is |
remarkably easy |
to build free packet-sniffing tools |
using open-source UNIX-like |
operating systems |
and packet-capture software such |
as ethereal [ETHEREAL] or tcpdump [TCPDUMP]. However, unlike hourly or daily trends, realistic packet-by-packet pattern detection requires sub-millisecond timestamping accuracy. In this section we extend the discussion from Chapter 9 to include the issue of timestamping accuracy with modern, PC-based motherboards.
Most PC-based packet-capture software today will happily report timestamps in a numerical form that implies a resolution of 1 micro-second. The implication is often misleading. As noted earlier, the combination of non–real-time operating systems and PC motherboard clock inaccuracies leads to random (and not so random) variations in reported timestamps from one frame to the next.
There are two key points to remember when calibrating a low-cost PC+software traffic monitor and understanding its limitations:
•Modern PCs have hardware clocks that are not particularly accurate at the micro-second level.
•Operating systems such as FreeBSD [FREEBSD], Linux [LINUX] or Microsoft’s Windows [WINDOWS] are not designed to respond to external events (such as packet arrivals) consistently and in predictable time.
Hardware clocks provide the reference against which the software counts the passage of time. They are simply a counter that increments at a fixed, known rate. The operating system relies on knowing how many times the hardware clock increments (ticks) per second in order to know how long a second is. If the hardware clock ticks faster than expected, the operating system will overestimate time intervals. Conversely, if the clock ticks slower, the operating system will underestimate time intervals. Since packet-capture programs rely on the operating system for timestamping, the actual timestamps on every packet are subject to vagaries in the sniffing host’s on-board clock.
For example, consider a monitoring host whose local reference clock is specified to tick at 1 MHz but, in fact, runs 250 Hz faster (an error of 0.025 %). The operating system will assume that 1,000,000 increments of the clock counter represents one second of elapsed ‘real-time’, when, in fact, only 0.99,975 seconds have elapsed. Conversely, if packets are arriving over the network precisely 1 second apart, the monitoring software will report that the packets are arriving 1,000,250 micro-seconds apart instead.
Non–real-time operating systems also contribute to inaccuracies by providing no guaranteed response time when handling the arrival of packets. A finite period of time elapses between the ethernet interface hardware receiving a packet and that packet being copied into memory and timestamped. Depending on the operating system’s internal architecture for handling I/O (input/output) interrupts, the interval between a packet arriving and being timestamped may depend significantly on the system’s processing load at the time. Arriving packets are usually handled ‘quickly enough’, without any promises from the operating system of how quick that actually is. Consequently, the timestamp attached to every received packet is subject to the vagaries of processor load and interrupt handling at any given moment in time.
Online Game Traffic Patterns |
153 |
|
|
Despite all this, we can still use modern PCs and non–real-time operating systems to sniff traffic and report useful inter-packet arrival statistics. There are three things to consider.
•Calibrate your particular combination of hardware and software before putting it to use.
•Minimise unnecessary processor load on the sniffer host.
•Resynchronise the on-board clock regularly.
Calibration involves packet-sniffing a stream of packets from a known, precise source (a number of companies sell precision traffic generators for this purpose) and then comparing the measured spread of inter-packet intervals with the actual inter-packet intervals. This will reveal the bounds of likely error over different timescales and indicate whether a particular hardware and software combination can be trusted.
A trustworthy system might consistently generate timestamps that fluctuate, for example, 15 micro-second around a mean value that is 2 micro-seconds higher than the correct inter-packet interval. We would then attribute ±15 micro-second error bars, and adjust the means by 2 micro-seconds. Given that many games send packets that are spaced tens of milliseconds apart, this level of accuracy is quite sufficient.
Untrustworthy systems can have all sorts of oddball error modes. For example, we have seen situations where 7 ms deviation in the timestamp was introduced every second or so when an active ethernet cable was plugged into an entirely unrelated interface on the motherboard, or where the operating system only processed (and timestamped) packets from the ethernet card every 10 ms regardless of their arrival time.
Minimising processor load on the sniffer box is another reason it can be undesirable to perform packet capture on the actual game server or client hosts. It is also why you should carefully consider whether to do packet filtering (which incurs slightly more processing load) during or after capturing the traffic.
10.2 Sub-second Characteristics
The impact of network conditions on game traffic is more complex than simply measuring the average bit rate or packet-per-second rate between servers and clients. Many online games have quite low average bit rates. However, after the discussion of serialisation and queuing delays in Chapter 5, it should be clear that packet sizes and inter-packet intervals play an important part in how our game traffic will affect, and be affected by, other IP traffic in a network.
In this section, we will look at traffic examples from a number of FPS games. We focus on the in-game characteristics when players will be most sensitive to network service degradation (such as jitter and packet loss). The packet size and inter-arrival distributions between games (for example, during a map change) will not be covered.
10.2.1 Ticks, Snapshots and Command Updates
During game play, client-to-server transmissions keep the server informed of client actions, while server-to-client transmissions keep the client informed of global state changes in the game as a whole. Precisely how much information is sent, and how frequently, depends both on the game’s design and actual game activity at any given point in time.