


Chapter 11. Test Quality
Another form of static analysis is calculation of various code metrics, such as number of lines per class or per method, and the famous cyclomatic complexity7. They will generally tell you whether your code is too complex or not. Obviously, test classes and methods should stick to the same (or even stricter) rules than your production code, so verifying this seems like a good idea. But because you have no logic in your tests (as discussed in Section 10.2), the complexity of your test methods should be very low by default. Thus, such analysis will rarely reveal any problems in your test code.
To conclude, static analysis tools do not help much when it comes to tests code. No tool or metric will tell you if you have written good tests. Use them, listen to what they say, but do not expect too much. If you write your tests following the basic rules given in this section, then there is not much they can do for you.
11.3. Code Coverage
If you can not measure it, you can not improve it.
— William Thomson 1st Baron Kelvin
Having been seriously disappointed by what static code analysis tools have to offer with regard to finding test code smells (see Section 11.2), let us turn towards another group of tools, which are commonly used to assess test quality. Are they any better at finding test smells, and weaknesses of any kind, in your test code?
This section is devoted to a group of popular tools which utilize the code coverage technique8, and can provide a good deal of interesting information regarding your tests. We will discuss both their capabilities and limits. What we are really interested in is whether they can be used to measure, and hopefully improve, test quality. For the time being, we shall leave the technical issues relating to running them and concentrate solely on the usefulness of code coverage tools in the field of test quality measurement.
Code coverage measures which parts of your code were executed: i.e. which parts of the production code were executed during tests. They work by augmenting production code with additional statements, which do not change the semantics of the original code. The purpose of these additional instructions is to record information about executed fragments (lines, methods, statements) of code and to present it, later, as numerical data in coverage reports.
Code coverage tools also measure some other metrics, - e.g. cyclomatic complexity9. However, these do not really relate to test quality, so we shall not be discussing them in this section.
11.3.1. Line and Branch Coverage
"Code coverage" is a broad term which denotes a number of types of coverage measurement, sometimes very different from one another. Wikipedia10 describes them all in details. However, many of them are rather theoretical, and no tool supports them (mainly because their practical use is limited).
7http://en.wikipedia.org/wiki/Cyclomatic_complexity
8See http://en.wikipedia.org/wiki/Code_coverage
9See http://en.wikipedia.org/wiki/Software_metric, and especially http://en.wikipedia.org/wiki/Cyclomatic_complexity, for more information on this topic.
10See http://en.wikipedia.org/wiki/Code_coverage
238
Chapter 11. Test Quality
In this section I will present two types of code coverage measure provided by a popular Cobertura11 tool: line and branch coverage:
•Line coverage is a very simple metric. All it says is whether a particular line (or rather statement) of code has been exercised or not. If a line was "touched" during test execution, then it counts as covered. Simple, yet misleading - as will be discussed further. This kind of coverage is also known as statement coverage.
•Branch coverage focuses on decision points in production code, such as if or while statements with logical && or || operators. This is a much stronger measure than line coverage. In practice, to satisfy branch coverage, you must write tests such that every logical expression in your code gets to be evaluated to true and to false.
The difference between the two is very significant. While getting 100% line coverage is a pretty straightforward affair, much more effort must be made to obtain such a value for branch coverage. The following snippet of code illustrates this12.
Listing 11.1. A simple function to measure coverage
public boolean bar(boolean a, boolean b) { boolean result = false;
if (a && b) { result = true;
}
return result;
}
Table 11.1 shows calls to foo() methods, which should be issued from the test code, in order to obtain 100% line and branch coverage respectively.
Table 11.1. Tests required to obtain 100% coverage
line coverage |
branch coverage |
|
|
foo(true, true) |
foo(true, false) |
|
foo(true, true) |
|
foo(false,false) |
|
|
Now that we understand the types of code coverage provided by Cobertura, let us take a look at the results of its work.
11.3.2. Code Coverage Reports
After the tests have been run, code coverage tools generate a report on coverage metrics. This is possible thanks to the additional information previously added to the production code.
As we shall soon see, coverage reports can be used to gain an overall impression regarding code coverage, but also to scrutinize selected classes. They act as a spyglass and a microscope in one. We shall start with the view from 10,000 feet (i.e. project coverage), then move down to package level, and finally reach ground level with classes.
11http://cobertura.sourceforge.net/
12The code used to illustrate line and branch coverage is based on Wikipedia example: http://en.wikipedia.org/wiki/Code_coverage
239

Chapter 11. Test Quality
Figure 11.1. Code coverage - packages overview
Figure 11.1 presents an overview of some project coverage. For each package the following statistics are given:
•the percentage of line coverage, along with the total number of lines and number of lines covered,
•the percentage of branch coverage, along with the total number of branches and, for purposes of comparison, the number of branches covered.
As you might guess, a red color is used for those parts of the code not executed (not "covered") during the tests. So - the more green, the better? Well, yes and no - we will get to this soon.
Figure 11.2. Code coverage - single package
The report shown in Figure 11.2 gives an overview of code coverage for the whole package, and for individual classes of the package. As with the previous report, it gives information on line and branch coverage. Figure 11.3 provides an example.
240
Chapter 11. Test Quality
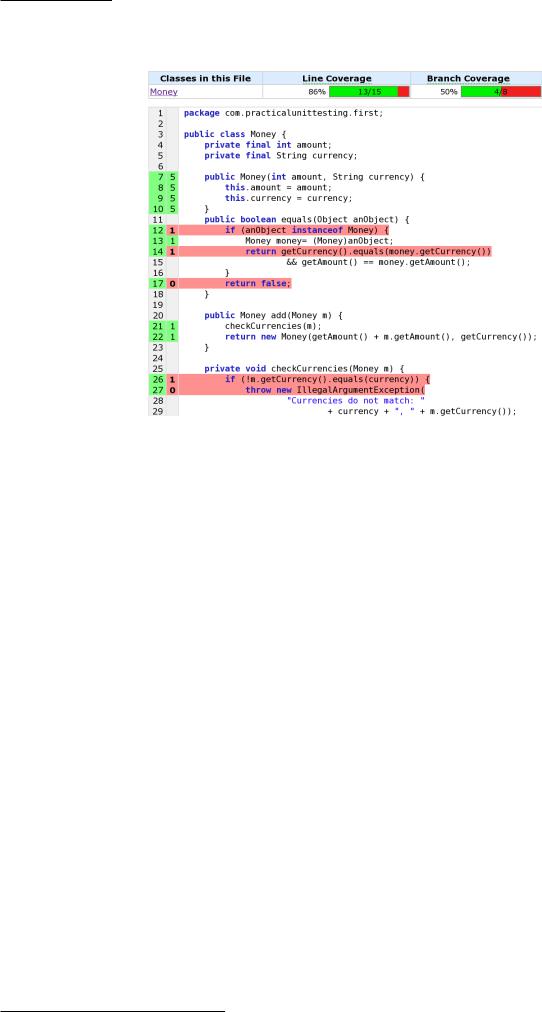
Figure 11.3. Single class coverage
Figure 11.3 presents code for our old friend - the Money class. This report shows precisely which parts of the Money class are covered by tests. The green color denotes parts that have been tested, the red those not executed during the tests. The first column of numbers is the line of code, while the second gives some additional information, about the number of times each line was "touched" during the testing. For example, in the case of line 12 (the if statement) the number on a red background says 1. This means that this if statement has only been executed once. We may guess that the current tests contain only one case, which makes this if evaluate to true. If we were to add another test which evaluated this Boolean expression to false, then the number 1 on a red background would change to 2 on a green background. Also, the coverage of line 17 would change from 0 to 1 (and from red to green).
11.3.3. The Devil is in the Details
Let us take a closer look at this last example of detailed code coverage of the Money class. Listing 11.2 shows tests which have been executed to obtain the following quite high level of coverage: 86% line coverage and 50% branch coverage.
241