

final_prep
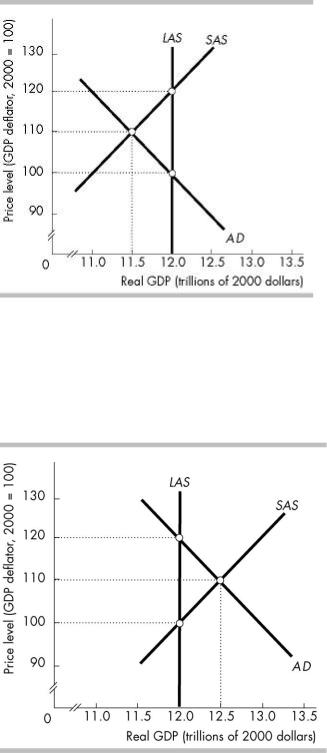
.pdf266) In the above figure, at the price level of 140 and real GDP of |
266) _____ |
A)$4 trillion, firms will not be able to sell all their output.
B)$12 trillion, firms will not be able to sell all their output.
C)$12 trillion, consumers will not be able to buy all the goods and services they demand.
D)$4 trillion, consumers will not be able to buy all the goods and services they demand.
267) |
Based on the figure above, short-run equilibrium occurs at the price level of |
|
267) |
_____ |
||
|
A) 130 and real GDP of $8 trillion. |
B) 120 and real GDP of $4 trillion. |
|
|
||
|
C) 140 and real GDP of $12 trillion. |
D) 130 and real GDP of $12 trillion. |
|
|
||
268) |
The data in the above figure indicate that the economy will be in a long-run macroeconomic |
268) |
_____ |
|||
|
equilibrium at a price level of |
|
|
|
|
|
|
A) 100. |
B) 130. |
C) 120. |
D) 140. |
|
|
269) |
Which of the following can be said about economic growth? |
|
269) |
_____ |
||
I.Economic growth is the result of increases in long-run aggregate supply.
II. Economic growth is the result of increases in aggregate demand. |
|
||
A) I only |
B) II only |
C) I and II |
D) neither I or II |
270) Economic growth |
|
|
270) _____ |
A)requires a compensating decrease in aggregate demand to offset the increase in aggregate supply.
B)occurs when the long-run aggregate supply curve shifts upward.
C)is an increase in potential GDP as the long-run aggregate supply curve shifts rightward.
D)All of the above answers are correct.
271) |
If aggregate demand grows only slightly faster than potential GDP, then the economy will |
271) |
_____ |
|
________. |
|
|
|
A) be at a business-cycle peak |
|
|
|
B) experience recession |
|
|
|
C) experience economic growth with low inflation |
|
|
|
D) experience economic growth with high inflation |
|
|
272) |
An above full-employment equilibrium is |
272) |
_____ |
|
A) a theoretical possibility but cannot happen in reality. |
|
|
B)the period of time when prices are falling.
C)when real GDP exceeds potential GDP.
D)the equilibrium in which the economy is in most of the time.
273) If real GDP exceeds potential GDP, |
273) _____ |
A)there can be a short-run equilibrium with an inflationary gap.
B)there is neither a long-run nor a short-run equilibrium.
C)there is a long-run and a short-run equilibrium.
D)there can be a short-run equilibrium with a recessionary gap.
274) If real GDP is less than potential GDP, then the economy is ________ equilibrium. |
274) |
_____ |
||||||
|
A) at a below full-employment |
B) at an above full-employment |
|
|
||||
|
C) not in short-run macroeconomic |
D) in long-run macroeconomic |
|
|
||||
275) An economy is at full employment. Which of the following events can create a recessionary gap? |
275) |
_____ |
||||||
|
A) a decrease in money wages |
B) an increase in foreign income |
|
|
||||
|
C) a decrease in the quantity of capital |
D) an increase in taxes |
|
|
||||
|
|
|
Real GDP supplied |
|
|
|
||
|
|
Rea |
|
|
|
|
|
|
|
|
l |
|
|
|
|
|
|
|
|
GD |
Sho |
Lon |
|
|
|
|
|
|
P |
|
|
|
|
||
Pric |
|
rt |
g |
|
|
|
|
|
|
de |
|
|
|
|
|||
e |
|
run |
run |
|
|
|
|
|
|
ma |
|
|
|
|
|||
lev |
|
(do |
(do |
|
|
|
|
|
|
nde |
|
|
|
|
|||
el |
|
llar |
llar |
|
|
|
|
|
|
d |
|
|
|
|
|||
|
|
s) |
s) |
|
|
|
|
|
|
|
(do |
|
|
|
|
||
|
|
|
|
|
|
|
|
|
|
|
llar |
|
|
|
|
|
|
|
|
s) |
|
|
|
|
|
|
90 |
700 |
|
300 |
600 |
|
|
|
|
100 |
600 |
|
400 |
600 |
|
|
|
|
110 |
500 |
|
500 |
600 |
|
|
|
|
120 |
400 |
|
600 |
600 |
|
|
|
|
276) |
The table above gives the aggregate demand and aggregate supply schedules in Lotus Land. The |
276) |
_____ |
|||
|
short-run macroeconomic equilibrium is a price level of ________ and a real GDP of ________. |
|
|
|||
|
A) 100; $400 |
B) 120; $400 |
C) 110; $500 |
D) 90; $400 |
|
|
277) |
The table above gives the aggregate demand and aggregate supply schedules in Lotus Land. In |
277) |
_____ |
|||
|
short-run equilibrium, there is ________. |
|
|
|
|
|
|
A) an inflationary gap of $200 |
B) a recessionary gap of $200 |
|
|
||
|
C) an inflationary gap of $100 |
D) a recessionary gap of $100 |
|
|
||
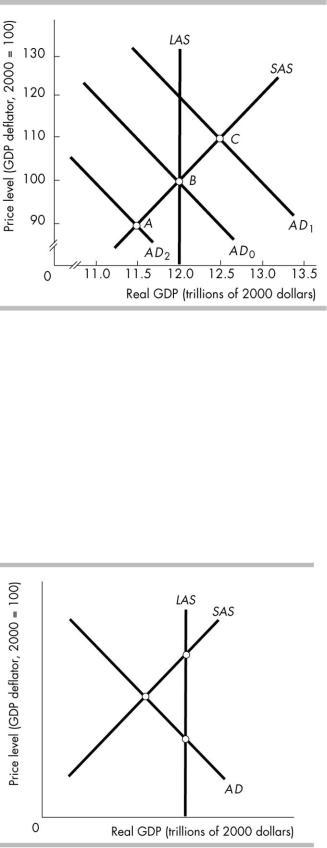
278) The above figure illustrates |
278) _____ |
A)a full-employment equilibrium.
B)an inflationary gap.
C)an equilibrium at the economy's physical limits.
D)a recessionary gap.
279) The above figure illustrates |
279) _____ |
A)an equilibrium at the economy's physical limits.
B)a full-employment equilibrium.
C)an inflationary gap.
D)a recessionary gap.
280) |
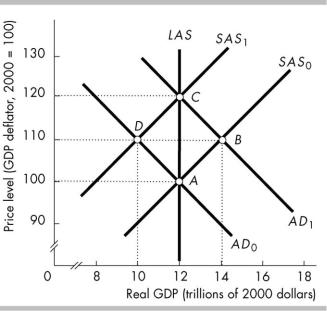
In the above figure, point A represents |
280) |
_____ |
|
A) an increase in aggregate demand. |
B) a full-employment equilibrium. |
|
|
C) a recessionary gap. |
D) an inflationary gap. |
|
281) |
In the above figure, point B represents |
281) |
_____ |
|
A) an inflationary gap. |
B) a recessionary gap. |
|
|
C) a full-employment equilibrium. |
D) a decrease in aggregate demand. |
|
282) |
In the above figure, point C represents |
282) |
_____ |
|
A) a recessionary gap. |
B) an inflationary gap. |
|
|
C) a full-employment equilibrium. |
D) a decrease in aggregate demand. |
|
283) In the above figure, the short-run equilibrium depicts an economy |
283) _____ |
|
A) with a recessionary gap. |
B) with an inflationary gap. |
|
C) producing at full employment. |
D) None of the above answers are correct. |
|
284) |
In the above figure, if aggregate demand does not change the short-run equilibrium will |
284) |
_____ |
|
A) will not adjust on its own. |
|
|
|
B) eventually adjust to a long-run equilibrium with a lower price level. |
|
|
|
C) eventually adjust to a long-run equilibrium with a higher price level. |
|
|
|
D) None of the above answers are correct. |
|
|
285) |
If the economy is in long run equilibrium and then aggregate demand increases, in the long run |
285) |
_____ |
|
the increase in aggregate demand means that the |
|
|
|
A) real GDP will be larger but the price level will be unaffected. |
|
|
|
B) neither the price level nor real GDP will be unaffected. |
|
|
|
C) the price level will be higher and real GDP will be larger. |
|
|
|
D) price level will be higher but real GDP will be unaffected. |
|
|
286) |
In the long-run equilibrium, an increase in the quantity of capital leads to |
286) |
_____ |
A)a decrease in the equilibrium price level, but no change in equilibrium real GDP.
B)an increase in the equilibrium price level and an increase in equilibrium real GDP.
C)a decrease in the equilibrium price level and an increase in equilibrium real GDP.
D)no change in the equilibrium price level, but an increase in equilibrium real GDP.
|
Aggreg |
Short-r |
Long-r |
|
un |
un |
|
|
ate |
||
|
aggreg |
aggreg |
|
|
deman |
||
|
ate |
ate |
|
|
d |
||
|
supply |
supply |
|
|
(trillion |
||
|
(trillion |
(trillion |
|
|
s of |
||
|
s of |
s of |
|
|
2000 |
||
|
2000 |
2000 |
|
|
dollars) |
||
|
dollars) |
dollars) |
|
|
|
||
|
|
|
|
140 |
9.0 |
11.5 |
10.0 |
130 |
9.5 |
11.0 |
10.0 |
120 |
10.0 |
10.5 |
10.0 |
110 |
10.5 |
10.0 |
10.0 |
100 |
11.0 |
9.5 |
10.0 |
287) |
The data in the above table indicate that the economy will be in a short-run macroeconomic |
287) |
_____ |
|
|
equilibrium at a price level |
|
|
|
|
A) of 110. |
B) of 120. |
|
|
|
C) between 130 and 121. |
D) between 119 and 111. |
|
|
288) |
From the data in the above table, when the economy is at its short-run equilibrium, if aggregate |
288) |
_____ |
|
|
demand does not change, then as time passes the |
|
|
|
A)short-run aggregate supply curve shifts rightward.
B)long-run aggregate supply curve shifts leftward.
C)long-run aggregate supply curve shifts rightward.
D)short-run aggregate supply curve shifts leftward.
Pric |
Aggregate |
Short-run |
Long-run |
e |
demand |
aggregate |
aggregate |
lev |
(trillions of |
supply |
supply |
el |
2000 dollars) |
(trillions of |
(trillions of |
|
|
2000 dollars) |
2000 dollars) |
100 |
11 |
7 |
10 |
110 |
10 |
8 |
10 |
120 |
9 |
9 |
10 |
130 |
8 |
10 |
10 |
140 |
7 |
11 |
10 |
289) |
Based on the data in the table above, the economy will be in short-run equilibrium at a price |
289) |
_____ |
|||
|
level of |
|
|
|
|
|
|
A) 100. |
B) 120. |
C) 110. |
D) 90. |
|
|
290) |
Based on the data in the table above, at the short-run equilibrium |
|
290) |
_____ |
||
A)money wage rates will rise in long-run.
B)the economy is at full employment.
C)the unemployment rate is less than the natural unemployment rate.
D)the unemployment rate is greater than the natural unemployment rate.
|
Aggreg |
Short-r |
Long-r |
|
un |
un |
|
|
ate |
||
|
aggreg |
aggreg |
|
|
deman |
||
|
ate |
ate |
|
|
d |
||
|
supply |
supply |
|
|
(trillion |
||
|
(trillion |
(trillion |
|
|
s of |
||
|
s of |
s of |
|
|
2000 |
||
|
2000 |
2000 |
|
|
dollars) |
||
|
dollars) |
dollars) |
|
|
|
||
|
|
|
|
100 |
13 |
9 |
10 |
105 |
12 |
10 |
10 |
110 |
11 |
11 |
10 |
115 |
10 |
13 |
10 |
291) |
Using the data in the above table, in the long-run macroeconomic equilibrium, the price level is |
291) |
_____ |
|||
|
________ and the level of real GDP is ________. |
|
|
|
|
|
|
A) 110; $10 trillion |
B) 115; $10 trillion |
C) 115; $11 trillion |
D) 105; $11 trillion |
|
|
292) |
Inflation can be started by |
|
|
|
292) |
_____ |
A)a decrease in aggregate supply or a decrease in aggregate demand.
B)an increase in aggregate supply or a decrease in aggregate demand.
C)a decrease in aggregate supply or an increase in aggregate demand.
D)an increase in aggregate supply or an increase in aggregate demand.
293) Demand-pull inflation starts with |
293) _____ |
A)an increase in short-run aggregate supply.
B)a decrease in short-run aggregate supply.
C)a decrease in aggregate demand.
D)an increase in aggregate demand.
294) Demand-pull inflation can start when |
294) _____ |
A) money wage rates rise faster than prices. |
|
B)the short-run aggregate supply curve shifts rightward.
C)the aggregate demand curve shifts rightward.
D)money wage rates rise but the price level does not change.
295) Which of the following could lead to demand-pull inflation? |
295) _____ |
|
A) a decrease in exports |
B) an increase in oil prices |
|
C) an increase in the quantity of money |
D) an increase in the money wage rate |
|
296) |
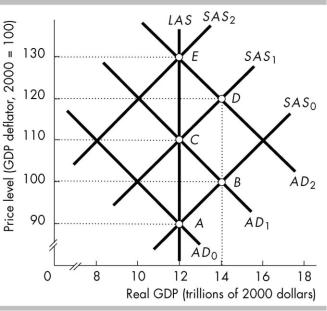
In the above figure, suppose that the economy is at point A when the quantity of money |
296) |
_____ |
|
|
increases. In the short run, the economy will move to point ________. |
|
|
|
|
A) A, that is, the price level and level of real GDP will not change. |
|
|
|
|
B) B |
|
|
|
|
C) C |
|
|
|
|
D) D |
|
|
|
297) |
A demand-pull inflation requires persistent increases in |
297) |
_____ |
|
|
A) real wages. |
B) the quantity of money. |
|
|
|
C) tax rates. |
D) government expenditures. |
|
|
298) |
Suppose that a shock causes the aggregate demand curve to shift rightward. If the Fed does |
298) |
_____ |
|
|
nothing, |
|
|
|
A)eventually the short-run aggregate supply curve will shift leftward and there will be continued inflation.
B)the short-run aggregate supply curve will not shift leftward and there will be continued inflation.
C)the economy will experience a temporary reduction in employment but will eventually return to full employment.
D)output initially will exceed potential GDP, but the economy will return to potential GDP with a higher price level.
299) To prevent demand-pull inflation |
299) _____ |
A)real GDP must increase.
B)firms must refuse to increase wages.
C)the natural unemployment rate must increase.
D)the Fed must not let the quantity of money persistently rise.
300) In the above figure, the movement from point A to B to C to D to E represents |
300) _____ |
A)cost-push inflation resulting from persistent increases in the quantity of money.
B)demand-pull inflation resulting solely from wage responses to excess labor demand.
C)cost-push inflation resulting solely from wage responses to excess labor demand.
D)demand-pull inflation resulting from persistent increases in the quantity of money.
301) |
In the above figure, suppose the economy is at point A. The movement from point B to C to D to |
301) |
_____ |
|
|
E could result from continual increases in the |
|
|
|
|
A) price of oil. |
B) quantity of money. |
|
|
|
C) real wage rate. |
D) Both answers A and C are correct. |
|
|
302) |
In the short run, if there is an increase in the money wage rate, then |
302) |
_____ |
|
A)aggregate demand decreases and the price level falls.
B)short-run aggregate supply decreases and the price level rises.
C)aggregate demand increases and the price level rises.
D)short-run aggregate supply increases and the price level rises.
303) By itself, a supply shock such as a hike in the price of oil, can |
303) _____ |
A)be inflationary as long as there is no policy response.
B)cause a wage-price spiral.
C)not cause inflation.
D)cause real GDP to permanently decrease year after year.
304) |
A one-time increase in the price of oil followed by a one-time increase in aggregate demand |
304) |
_____ |
|
|
produce |
|
|
|
|
A) continuing demand-pull inflation. |
B) a one-time decrease in the price level. |
|
|
|
C) continuing cost-push inflation. |
D) a one-time increase in the price level. |
|
|
305) |
A cost-push inflation spiral results if the Fed's response to stagflation is to keep |
305) |
_____ |
|
|
A) increasing aggregate demand. |
B) decreasing aggregate supply. |
|
|

C) decreasing aggregate demand. |
D) increasing aggregate supply. |
306) To prevent cost-push inflation |
306) _____ |
A)there must not be an excess demand for money.
B)interest rates must not rise.
C)the Fed must not let the quantity of money rise persistently.
D)there must not be an increase in government purchases.
307) In the above figure, which path represents a cost-push inflation? |
307) _____ |
|
A) point A to C to D to F to G |
B) point A to C to D to E to G |
|
C) point A to B to D to E to G |
D) point A to B to D to F to G |
|
308) The figure above shows the aggregate demand, short-run aggregate supply, and long-run |
A. A push |
aggregate supply curves for the economy of Tomorrowland. The economy is currently at point |
costrise in |
the price 308) |
|
____ |
|
level will |
|
_ |
|
initially |
|
|
|
move the |
|
|
|
economy |
|
|
|
to point |
|
|
|
________ |
|
|
|
and to |
|
|
|
point |
|
|
|
________ |
|
|
|
. |
|
|
|
A) B when aggregate demand decreases; C when the money prices of raw materials rise |
|
|
|
B) E when aggregate demand increases; D when the money prices of raw materials rise |
|
|
|
C) F; A when the money prices of raw materials change |
|
|
|
D) C when the money prices of raw materials rise; D when aggregate demand increases |
|
|
|
309) Suppose that the economy is at full employment and aggregate demand increases by more than |
309) |
_____ |
|
it is anticipated to increase. Other things remaining the same, ________. |
|
|
|
A) real GDP increases above potential GDP |
B) long-run aggregate supply decreases |
|
|
C) real GDP decreases below potential GDP |
D) real GDP remains at potential GDP |
|
|
310) Rational expectations are |
|
310) |
_____ |
A)impossible to make because they are assumed to be always accurate.
B)used in the labor market but not in the financial markets.
C)based on all relevant information.
D)possible to make and are always accurate.
311) |
In a demand-pull inflation, the AD curve shifts ________ and the SAS curve shifts ________. |
311) |
_____ |
|
|
A) leftward; leftward |
B) rightward; rightward |
|
|
|
C) rightward; leftward |
D) leftward; rightward |
|
|
312) |
A rise in the price level because of an increase in the money wage rate |
312) |
_____ |
|
A)definitely triggers a demand-pull inflation.
B)might trigger a demand-pull inflation.
C)definitely triggers a cost-push inflation.
D)might trigger a cost-push inflation.
313) The Phillips curve shows the relationship between the |
313) _____ |
A)expected rate of inflation and the nominal interest rate.
B)nominal interest rate and the real interest rate.
C)real interest rate and the unemployment rate.
D)unemployment rate and the inflation rate.
314) |
A direct way to study inflation and unemployment is by using ________. |
314) |
_____ |
|
|
A) data from the OECD |
B) the AS-AD model |
|
|
|
C) data from high inflation countries |
D) a Phillips curve |
|
|
315) |
The short-run Phillips curve shows the relationship between unemployment and inflation when |
315) |
_____ |
|
|
the natural unemployment rate is constant and |
|
|
|
A)aggregate demand is changing.
B)the expected inflation rate is falling.
C)the expected inflation rate does not change.