

University of Nebraska - Lincoln
DigitalCommons@University of Nebraska - Lincoln
Stephen Ducharme Publications |
Research Papers in Physics and Astronomy |
|
|
1-1-2011
Orientational imaging in polar polymers by piezoresponse force microscopy
Pankaj Sharma
University of Nebraska-Lincoln, psharma@huskers.unl.edu
Dong Wu
University of Nebraska-Lincoln
Shashi Poddar
University of Nebraska-Lincoln
Timothy J. Reece
University of Nebraska-Lincoln, treece2@unl.edu
Stephen Ducharme
University of Nebraska-Lincoln, sducharme1@unl.edu
See next page for additional authors
Follow this and additional works at: http://digitalcommons.unl.edu/physicsducharme  Part of the Physics Commons
Sharma, Pankaj; Wu, Dong; Poddar, Shashi; Reece, Timothy J.; Ducharme, Stephen; and Gruverman, Alexei, "Orientational imaging in polar polymers by piezoresponse force microscopy" (2011). Stephen Ducharme Publications. Paper 83. http://digitalcommons.unl.edu/physicsducharme/83
This Article is brought to you for free and open access by the Research Papers in Physics and Astronomy at DigitalCommons@University of Nebraska - Lincoln. It has been accepted for inclusion in Stephen Ducharme Publications by an authorized administrator of DigitalCommons@University of Nebraska - Lincoln.

Authors
Pankaj Sharma, Dong Wu, Shashi Poddar, Timothy J. Reece, Stephen Ducharme, and Alexei Gruverman
This article is available at DigitalCommons@University of Nebraska - Lincoln: http://digitalcommons.unl.edu/physicsducharme/83

JOURNAL OF APPLIED PHYSICS 110, 052010 (2011)
Orientational imaging in polar polymers by piezoresponse force microscopy
Pankaj Sharma,1 Dong Wu,2 Shashi Poddar,1 Timothy J. Reece,1 Stephen Ducharme,1 and Alexei Gruverman1,a)
1Department of Physics and Astronomy and Nebraska Center for Materials and Nanoscience, University of Nebraska-Lincoln, Lincoln, Nebraska 68588-0299, USA
2Department of Chemistry, University of North Carolina, Chapel Hill, North Carolina 27599-3290, USA
(Received 11 February 2011; accepted 2 May 2011; published online 2 September 2011)
We report orientational imaging of the polarization distribution in nanostructured ferroelectric copolymer of polyvinylidene fluoride-trifluoroethylene (PVDF-TrFE) and collagen fibrils using vertical and lateral modes of piezoresponse force microscopy (PFM). In PVDF-TrFE, detection of azimuthal variations in the lateral PFM signal is attributed to the alignment of the molecular chains along different directions. Local switching in PVDF-TrFE is shown to proceed via 120 or 180 rotation of dipoles around the molecular chain, depending upon the strength of the applied electric field. Analysis of the vertical and lateral PFM signals in collagen reveals polar anisotropy of the electromechanical properties along the axes of the fibrils. The surface plots of the piezoelectric response are constructed for both materials based on their piezoelectric tensors and are shown to be consistent with the observed vertical and lateral PFM maps. VC 2011 American Institute of Physics. [doi:10.1063/1.3623765]
I. INTRODUCTION
Nowadays, there is a growing emphasis on understanding the properties of the polymer materials at the nanoscale. Natural biopolymers, e.g., collagen, keratin, cellulose, and synthetic electroactive polymers, such as polyvinylidene fluoride-tri- fluoroethylene (PVDF-TrFE) are of great importance for a number of research fields including biocompatible tissue engineering and organic electronics.1–5 Collagen is the main component of connective tissues and is the most abundant protein in mammals, making up about one third of the whole-body protein content. Investigation of the physicochemical properties of collagen fibrils at the nanoscale is important for better understanding of the collagen structure effect on cell-cell and cell-matrix communication, growth and repair of connective tissues, and biomechanical properties of calcified tissues. Discovery of the switchable ferroelectric polarization in ultrathin films of PVDF-TrFE (Ref. 6) has generated a lot of interest in the scaling behavior in ferroelectric copolymers and their use in all-organic memory and mass data storage devices.7 Obviously, progress in fundamental studies and technological applications of organic polymer materials depend on the ability of testing their structural and functional properties at nanoscale.
In this work, high-resolution orientational imaging of nanostructured ferroelectric polymers of PVDF-TrFE and collagen fibrils has been performed by means of piezoresponse force microscopy (PFM).8 In PVDF-TrFE, combination of vertical (out-of-plane) and lateral (in-plane) PFM imaging (VPFM and LPFM, respectively) allows 3D reconstruction of polarization and shows strong azimuthal variations in the lateral PFM signal due to the alignment of the molecular chains along different directions. Further, local switching in PVDF-TrFE is shown to proceed by rotation of dipoles dependent upon the strength of applied electric field. Analysis of the vertical and lateral PFM signals in collagen
a)Electronic mail: agruverman2@unl.edu.
reveal polar anisotropy of the electromechanical properties along the axes of the fibrils. Modeling of the observed vertical and lateral PFM signals has been carried out by constructing the 3D surface plots of the effective piezoelectric responses for model cantilever-sample geometries.
II. EXPERIMENTS
Highly crystalline ultrathin films of ferroelectric copolymer P(VDF-TrFE) with a molar content ratio of 80:20 and of thickness 3 and 12 monolayers (ML) have been fabricated on highly doped (0.001–0.005 X*cm) silicon substrates using a horizontal Schaefer variation of the LangmuirBlodgett (LB) transfer technique. A Langmuir layer was dispersed on an ultrapure water subphase from a 0.05% solution of P(VDF-TrFE) in dimethyl sulfoxide. The Langmuir layer was transferred to silicon substrate by horizontal dipping at a constant subphase surface pressure of 5 mN=m and temperature of 25 C. After deposition, 3 ML films were annealed at 135 C (12 ML at 150 C) for a period of 90 min with subsequent cooling to room temperature at a rate of 1 C=min in a microprocessor-controlled forced air oven.9
Collagen fibrils were prepared wet on a metal disk and dried with a stream of filtered air. Further details of collagen sample preparation can be found elsewhere.10
A commercial atomic force microscope (Asylum MFP-3 D) was used in this study. PFM imaging8 has been performed by using a high-frequency modulating voltage (400–800 kHz, 1.0– 1.5 V) to a conductive probe (Pt-Ti-coated Si cantilevers from Mikromasch and Au-coated SiN cantilevers from Olympus).
III. RESULTS AND DISCUSSION
A. Orientational polarization detection in nanostructured PVDF-TrFE co-polymers
Recently, fabrication of regular arrays of PVDF-TrFE nanomesas by nano-embossing has been demonstrated.11,12
0021-8979/2011/110(5)/052010/6/$30.00 |
110, 052010-1 |
V 2011 American Institute of Physics |
|
|
C |
052010-2 |
Sharma et al. |
J. Appl. Phys. 110, 052010 (2011) |
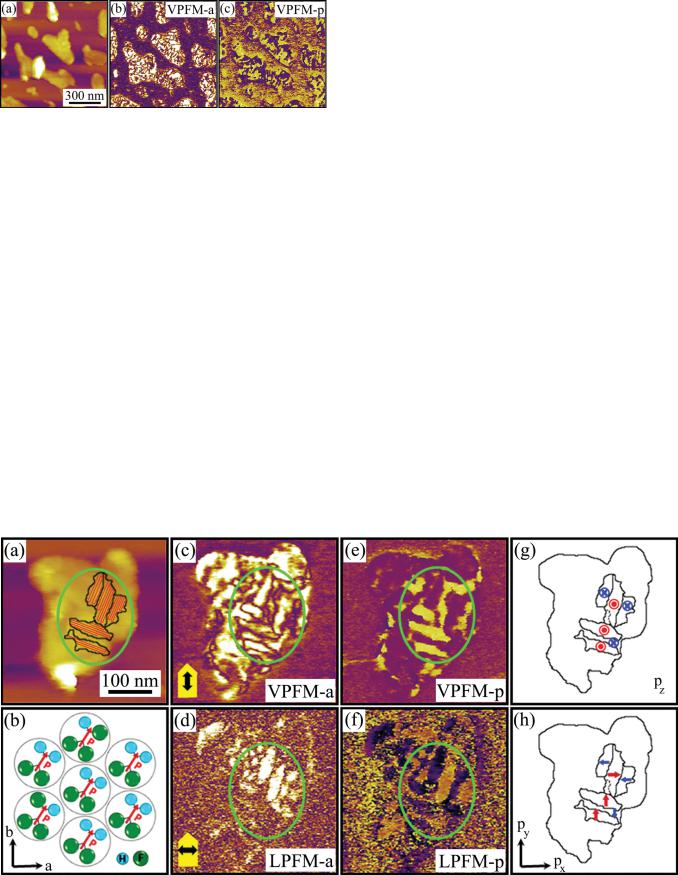
FIG. 1. (Color online) Images of PVDF-TrFE nanomesas: (a) topography,
(b) VPFM amplitude, and (c) phase.
The fact that these PVDF-TrFE nanostructures can be electrically switched between two stable polarization states makes them suitable for data storage devices with ultrahigh integration densities in the range of 33 Gb=in2.13 In general, morphology and crystallographic orientation of PVDF-TrFE copolymer films can be controlled by annealing conditions and a choice of the substrate material.14–16 Self-assembling is an alternative, bottom-up approach of producing nanostructured PVDF-TrFE films by utilizing the dynamical instabilities developing during the crystallization process. Annealing of the initially continuous ultrathin LB films of P(VDF-TrFE) copolymers results in the spontaneous appearance of isolated highly crystalline nanomesas with the lateral dimensions in the range from 100 nm to 500 nm.17
The topographic image in Fig. 1(a) shows an example of such self-assembled ferroelectric nanomesas approximately 200–400 nm in size and 15–25 nm thick. PFM imaging allows a nanoscale insight into the polarization distribution within individual nanomesas by detecting their mechanical oscillation in response to the applied ac bias—piezoresponse. Figures 1(b) and 1(c) present the vertical piezoresponse amplitude and phase (VPFM-a and VPFM-p, respectively)
images of nanomesas associated with the out-of-plane component of polarization. Contrast variations in the VPFM phase image are due to the presence of a number of domains in the as-grown nanomesas with an average domain size of approximately 30–40 nm, which is in agreement with previously reported results.18 Dark and bright contrast in the VPFM-p image indicates an upward and downward polarization, respectively. A saturated signal in the VPFM-a map suggests that polymer chains are lying parallel to the substrate and that there is no or very little variations in the molecular arrangement across the nanomesas thickness.
To get more detailed information about spatial arrangement of polarization, combined vertical and lateral PFM measurements of individual nanomesa in Fig. 2(a) have been carried out. During imaging, the scanning direction was always perpendicular to the cantilever axis. A sketch in Fig. 2(b) illustrates an alignment of dipoles in the crystal structure of PVDF-TrFE, which are at 30 to the plane normal. This alignment, which corresponds to a [110] crystalline orientation determined by X-ray diffraction of similar nanomesa arrays, provides an explanation for the piezoresponse amplitude and phase map acquired in the VPFM and LPFM modes (Figs. 2(c)–2(f)). It also allows reconstruction of molecular chain orientation for domains with specific geometry. In Fig. 2, a region marked by the ellipse shows elongated domains, which exhibit a high VPFM-a contrast (Fig. 2(c)). This high contrast is apparently associated with the out-of-plane component of polarization implying that the nanomesa is composed of molecular chains aligned parallel to the substrate. Finding the orientation of the out-of-plane polarization from the VPFM-p image (Fig. 2(e)) is fairly simple and is shown in Fig. 2(g).
FIG. 2. (Color online) (a) Topographic image of an individual PVDF-TrFE nanomesa. Curved lines in (a) show the folding of the PVDF-TrFE molecular chains.
(b) Schematic illustration of dipole alignment showing polarization at 30 angle relative to b-axis. (c)–(f) Corresponding PFM images of the same nanomesa: (c) VPFM amplitude, (d) LPFM amplitude, (e) VPFM phase, and (f) LPFM phase. (g)–(h) Reconstruction of (g) out-of-plane and (h) in-plane polarization components in the same nanomesa. Cantilever orientation is shown in images (c), (d). Black arrows illustrate cantilever buckling in (c) and torsion in (d).
052010-3 |
Sharma et al. |
J. Appl. Phys. 110, 052010 (2011) |
The corresponding LPFM-a image, which is due to the torsion of the cantilever and is typically associated with the in-plane polarization, is shown in Fig. 2(d). Elongated domains aligned almost parallel to the cantilever axis appear with a high lateral piezoresponse signal, while no LFPM-a response can be seen from domains with the axis almost orthogonal to the cantilever. This can be understood simply by taking in to account the orientation of the cantilever axis with respect to orientation of PVDF-TrFE chains.
The LPFM signal arises due to the polarization vector ~
P making an angle of 630 or 6150 with [010] crystallographic axis (b-axis) of the PVDF-TrFE crystal.19 For domains with the high LPFM-a response, the in-plane polarization should be orthogonal to the cantilever axis. Furthermore, it can be concluded that in this case the cantilever is aligned parallel to the C-C molecular chains. The situation is opposite for domains that do not show LPFM contrast: their in-plane component is parallel to the cantilever axis (and therefore they do not excite the torsional mode), while molecular chains making up these domains are orthogonal to it. Figure 2(h) shows the deduced in-plane polarization distribution and molecular chains are sketched in Fig. 2(a). It is reasonable to assume that these domains correspond to nanocrystalline lamellae.
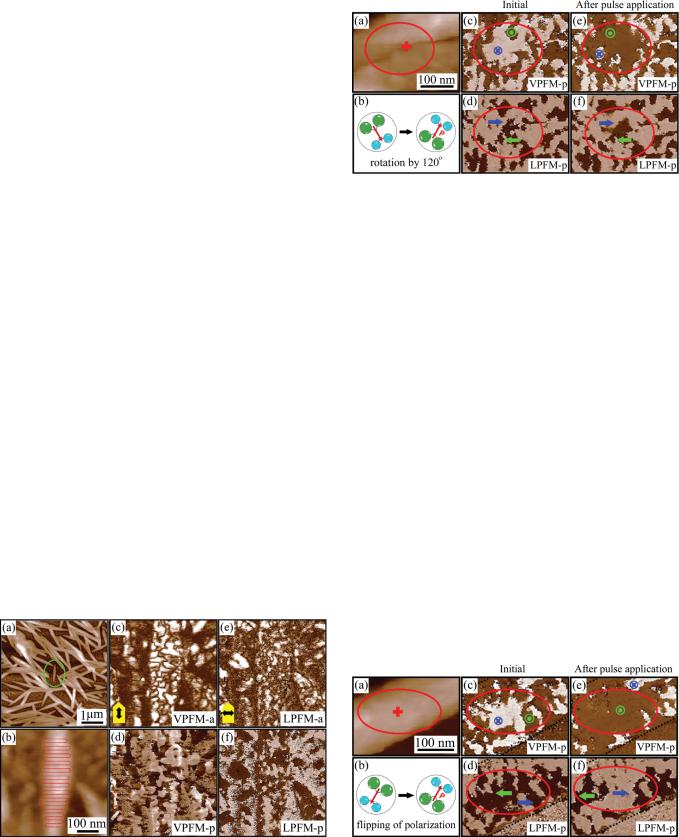
Figure 3(a) shows morphology of 12 ML thick PVDFTrFE film, which consists of needle-like grains. These nee- dle-like grains, while similar to previously reported ones,20 are comparatively larger: approximately 200–300 nm in width and few microns in length. The PFM maps of one of the needles (Fig. 3(b)) are shown in Figs. 3(c)–3(f). Alignment of this particular grain parallel to the cantilever axis makes interpretation of the PFM images much easier. As before, a strong VPFM response and a very weak LPFM response can be attributed to the folding of the C-C molecular chains along the breadth of the needle-like grains as shown schematically by the curved lines in Fig. 3(b). In this configuration, buckling of the cantilever due to the in-plane polarization may contribute to the VPFM response.
FIG. 4. (Color online) Local switching in a needle-like grain of PVDFTrFE: (a) Topographic image with cross indicating a tip position during voltage pulse ( 6 V, 1 s) application. (b) Schematic illustration of the 120 dipole rotation upon switching. (c)–(f) PFM phase images before (c), (d) and after (e), (f) pulse application: (c) initial VPFM, (d) initial LPFM, (e) resulting VPFM, and (f) resulting LPFM. Note little change in LPFM and a lot of change in VFPM upon voltage application.
Combined VPFM-LPFM imaging provides an opportunity to get an insight into the mechanism of local polarization reversal in PVDF-TrFE under the effect of a tip-generated electric field. A voltage pulse (-6 V, 1 s) was applied to the grain in Fig. 4(a). Phase images acquired in the lateral and vertical PFM modes before and after pulse application are shown in Figs. 4(c)–4(f). As can be seen, VPFM phase changes contrast indicating the reversal of out- of-plane component of the polarization over a fairly large region, while the LPFM phase appears to be nearly the same as before. This behavior can be interpreted as switching due to 120 dipole rotation about the molecular chain, where the out-of-plane polarization component is reversed, but the inplane component is not (Fig. 4(b)).
Since the tip-generated field also has an in-plane component, it would be reasonable to assume that the local switching can also proceed by 180 flipping of dipoles if the applied field is strong enough. We found this to be the case from results shown in Fig. 5. Application of the 8 V, 1 s voltage pulse to the grain results in the change of both VPFM and LPFM contrasts indicating the reversal of both
FIG. 3. (Color online) (a) Topographic image of PVDF-TrFE needle-like grains. (b) Zoom-in of a grain marked by a ellipse in (a); (c)–(f) Corresponding PFM images of the same grain: (c) VPFM amplitude, (d) VPFM phase,
(e) LPFM amplitude, and (f) LPFM phase. Dotted lines in (b) show the folding of the PVDF-TrFE molecular chains. Cantilever orientation is shown in images (c), (e). Black arrows illustrate cantilever buckling in (c) and torsion in (e).
FIG. 5. (Color online) Local switching in a needle-like grain of PVDFTrFE: (a) Topographic image with cross indicating a tip position during voltage pulse ( 8 V, 1 s) application. (b) Schematic illustration of the 180 dipole rotation upon switching. (c)–(f) PFM phase images before (c), (d) and after (e), (f) pulse application: (c) initial VPFM, (d) initial LPFM, (e) resulting VPFM, and (f) resulting LPFM. Note significant change in both VPFM and LPFM upon voltage application.

052010-4 |
Sharma et al. |
out-of-plane and in-plane component of the polarization over a fairly large region. These changes in PFM maps are indicative of polarization vector flipping (rotation by 180 ) about the chain axis as shown in Fig. 5(b).
Additional insight into the spatial arrangement of polarization can be obtained from the description of the electromechanical response as a function of the angle between crystallographic axis and the direction of the modulating (imaging) electric field.21 The electromechanical properties of all piezoelectric materials are determined by the piezoelectric tensor with elements dij0 determined in the crystal coordinate system. The transformation of the piezoelectric tensor dij0 to the piezoelectric tensor dij in the laboratory coordinate system is carried out by three Euler rotation angles ðu; h; wÞ and expressed by equation of the form:
dij ¼ Aikdkl0 Nlj; |
(1) |
where Nij and Aij are the rotation matrices.22–25
Ferroelectric polarization in PVDF-TrFE arises from alignment of molecular dipoles formed by positive hydrogen ions and negative fluorine ions as shown in Fig. 2(b). In the crystalline b-phase, molecules tend to pack parallel to each other forming a quasi-hexagonal orthorhombic structure with “m2m” point group.26 For PVDF-TrFE, the piezoelectric tensor dij0 in the crystal coordinate system is given as27
0 |
0 |
0 |
0 |
0 |
d150 |
0 |
1 |
|
dij0 ¼ B |
0 |
0 |
0 |
d240 |
0 |
0 C: |
(2) |
|
@d310 |
d320 |
d330 |
0 |
0 |
0 A |
|
||
Using Eq. (1), the element d33 of piezoelectric tensor in the laboratory coordinate system can be written as
d33 ¼ sin2ðhÞ cosðhÞfsin2ðuÞ½d310 þ d150 &
þ cos2ðuÞ½d320 þ d240 &g þ d330 cos3h: |
(3) |
In this case, the crystal structure of PVDF-TrFE is not rotationally invariant, and therefore d33 depends on both ðu; hÞ and d34, d35 depend on all three Euler rotation angles ðu; h; wÞ. As a result, the equations for d33, d34, and d35 are quite tedious. In previous studies,21–23 only the crystal systems with rotational invariance has been analyzed. In our case to simplify the consideration and to find dependence as a function of ðh; wÞ, we can look at surface plots of the effective d33 and d35 for particular values of Euler’s rotation angle u (which can be considered as an angle between the axis of the cantilever and C-C molecular chains). The values of the elements of piezoelectric tensor dij0 in the crystal coordinate system are given as:28,29
0 |
|
0 |
|
0 |
|
0 |
0 |
30:7 0 1 |
|
dij0 ¼ B 0 |
|
0 |
|
0 |
4:28 |
0 |
0 C: |
||
@ |
|
0:25 |
4:05 |
25:2 |
0 |
0 |
0 A |
||
|
|
|
|||||||
(4)
If the crystal coordinate system is aligned with the laboratory coordinate system (so that [010] k z-axis, [001] k x-axis, and [100] k y-axis), then from Eq. (3), for the special case of
J. Appl. Phys. 110, 052010 (2011)
u ¼ 0 (corresponding to the cantilever axis being aligned along molecular chains in the film’s plane), d33 can be written as
d33 ¼ sin2ðhÞ cosðhÞ½d320 þ d240 & þ d330 cos3ðhÞ: |
(5) |
For the in-plane response, using Eqs. (1) and (2) for u ¼ 0 , we evaluate the effective d34 and d35 as
d34 ¼ ½ð d320 þ d330 Þ þ ð d320 |
þ d330 d240 Þ cos 2h& |
sin h cos w; |
(6) |
d35 ¼ ½ðd320 þ d330 Þ þ ðd320 þ d330 |
d240 Þ cos 2h& sin h sin w: |
|
(7) |
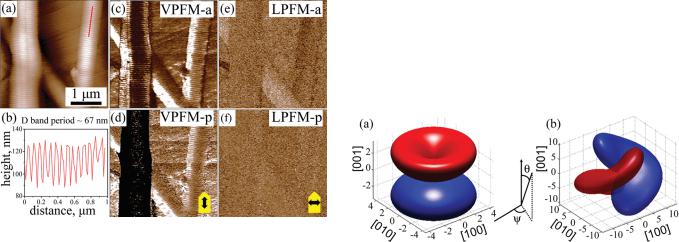
Figures 6(a) and 6(b) show the surface plots of effective d33 and d35 as functions of ðh; wÞ for u ¼ 0 respectively. (Note that the surface plot of effective d34 is almost identical to the surface plot of d35, however shifted by w ¼ 90 .) As can been seen, the d33 value peaks at h ¼ 0 (Fig. 6(a)) and is symmetric relative to angle w. This is consistent with the strong VPFM signal observed over the nanomesa surface,
indicating the polarization vector ~ aligned at a small angle
P
to film normal. The in-plane polarization component along the axis of the cantilever (longitudinal component) may cause bucking of the cantilever and thus contribute to the vertical piezoresponse. This may explain the slight variations in VPFM amplitude over the nanomesa surface in Fig. 2(c). Note that for any other value of u, the effective d33 always peaks at h ¼ 0 .
Figure 6(b) shows that for Euler’s rotation angle u ¼ 0 the effective d35 (d34) peaks at angles h ¼ 637 , 6143 , and w ¼ 90 (h ¼ 638 , 6142 , and w ¼ 0 ). In other words, the surface plot of d35 shows that there are four possible directions of polarization for maximum LPFM response, making angles h ¼ 637 or 6143 with b-axis normal to molecular chain. This analysis is in reasonable agreement with the previous conclusion that the polarization vector makes an angle 630 or 6150 with the b-axis of PVDF-TrFE crystal. Further, as we vary the angle u from 0 to 90 , maximum of the surface plot of effective d35(d34) shifts toward higher
FIG. 6. (Color online) Orientational dependence of the (a) vertical (d33) and
(b) lateral PFM (d35) signals for u ¼ 0 in PVDF-TrFE. (Piezoresponse sign: negative for the upper lobe of d33 and for two lobes on right for d35, positive for the lower lobe of d33 and two lobes on left for d35.)
052010-5 Sharma et al.
values of the h, and for u ¼ 90 , both d35 and d34 peak at h ¼ 690 , i.e., in the direction perpendicular to the chain axis. This case would correspond to “head-to-head” and “tail-to-tail” configurations, which are energetically unfavorable. So for most cases, description of the LPFM for small values of u is the best approximation of real domain configurations.
B. Orientational imaging of electromechanical properties of collagen fibrils
Over the last several years there has been an increasing interest in application of PFM to structural and functional imaging in biological materials. New imaging capabilities offered by PFM have resulted in breakthrough results ranging from detection of piezoelectricity in a butterfly wing to realspace imaging of electromechanically active protein fibrils in calcified and connective tissues—accomplishments unattainable by other experimental techniques.30–33 Collagen-type proteins represent a key structural component of biological materials and systems. Assessment of the relationship between piezoelectric properties and molecular structure of proteins is an important step toward the understanding of the physico-chemical properties of biological systems and development of biologically inspired materials and devices.34
Here, we demonstrate high-resolution PFM examination of collagen type I at the level of an individual collagen fibril. By analyzing the orientational dependence of the electromechanical response in the controlled PFM probe-fibril geometry we unveil anisotropy of structural properties along the fibril axis.
Collagen fibrils consist of microfibrils and each microfibril consists of five strands of tropocollagen molecules.35 Tropocollagen sub-units spontaneously arrange themselves under physiological conditions into staggered array structures, stabilized by numerous hydrogen and covalent bonds. Figures 7(a) and 7(b) show the topography of the collagen fibrils with the characteristic D-band period of 67 nm. In our experiment, orientational measurements are performed in
FIG. 7. (Color online) (a) Topographic image of the collagen fibrils.
(b) Cross-section profile along the line in the topographic image showing a 67-nm periodicity of D-bands; (c)–(f) Corresponding PFM images of the collagen fibrils: (c) VPFM amplitude, (d) VPFM phase, (e) LPFM amplitude, and (f) LPFM phase. Cantilever orientation is shown in images (d), (f). Black arrows correspond to cantilever buckling in (d) and torsion in (f).
J. Appl. Phys. 110, 052010 (2011)
controlled geometry with the fibril axis aligned parallel to the cantilever and perpendicular to the scanning direction. Results of simultaneous vertical and lateral piezoresponse imaging of collagen fibrils are shown in Figs. 7(c)–7(f). Quasi-hexagonal symmetry of collagen structure implies the presence of a polar direction along the fibril axis,36 which explains almost no contrast in the LPFM mode. Indeed, for a fibril axis at an angle w to the axis of the cantilever, the lateral response will be given as d150 * sin (w), where d150 is the shear piezocoefficient along the axis of the fibril. Observation of a weak lateral piezoresponse for the fibril with its axis at a small angle ( 35 ) to the axis of the cantilever is consistent with this first-degree approximation. The question is why do we observe a much stronger VPFM signal? This apparent controversy was recently addressed in detail by Harnagea et al.37 who explained it by the contribution of cantilever buckling to the vertical piezoresponse. The
piezoelectric tensor d0 |
of collagen in the crystal coordinate |
|||||
system is given as38 |
ij |
|
|
|
|
|
|
|
|
|
|
|
|
0 0 |
0 |
0 |
d140 |
d150 |
0 1 |
|
B 0 |
0 |
0 |
d150 |
d140 |
0 C: |
(8) |
@d310 |
d310 |
d330 |
0 |
0 |
0 A |
|
The effective piezo-coefficients d33, d34, and d35 can be written as follows:
d33 ¼ 0:5 cos hðd150 þ d310 þ d330 ðd150 þ d310 d330 Þ cos 2hÞ;
|
|
|
(9) |
d34 ¼ ð cos wðd310 d330 þ ðd150 |
þ d310 d330 Þ cos 2hÞ |
||
d140 cos h sin wÞ sin h; |
|
|
(10) |
d35 ¼ ð sin wðd310 d330 þ ðd150 |
þ d310 d330 Þ cos 2hÞ |
||
þ d140 cos h cos wÞ sin h: |
|
|
(11) |
The equations are rotationally invariant with respect to |
|||
angle u of rotation about the fibril axis and for h |
¼ |
90 can |
|
|
|||
be reduced to d33 ¼ 0; d34 ¼ d150 |
cos w and d35 ¼ d150 sin w, |
||
where w is the angle between the cantilever and fibril axis. This analysis further validates the point that there is no contribution to the VPFM signal form vertical displacement of the cantilever as d33 ¼ 0. Therefore, the observed VPFM response is due to the buckling of the cantilever and given by d34 ¼ d150 cos w, while the LPFM response is d35 ¼ d150 sin w:
FIG. 8. (Color online) Orientational dependence of the (a) vertical (d33) and
(b) lateral PFM (d34) signals in collagen. (Piezoresponse sign: negative for the lower lobe of d33 and curved part on right for d34, positive for the upper lobe of d33 and curved part on left for d34.)
052010-6 |
Sharma et al. |
J. Appl. Phys. 110, 052010 (2011) |
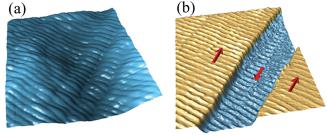
FIG. 9. (Color online) (a) Topographic and (b) corresponding VPFM phase image of the collagen fibrils. Image size is 1.4 x 1.4 lm2.
Figures 8(a) and 8(b) show the surface plots of the effective piezocoefficients d33 and d34, which are calculated under the assumption that d310 and d330 are very small compared to d140
and d0 , and hence can be neglected.22 The following values |
|
15 |
d310 ¼ 0:666 pm=V, d330 |
have been used in calculations: |
|
¼ 0:866 pm=V, d140 ¼ 26:6 pm=V, |
and d150 ¼ 14 pm=V.38 |
Figure 9 illustrates the fact that morphologically similar collagen fibrils can have opposite polar orientations. Further PFM studies of collagen fibrils at different structural levels will provide a better understanding of the relationship between their electromechanical response and molecular structure.
IV. CONCLUSION
In summary, we have carried out orientational imaging of polarization distribution in nanostructured ferroelectric copolymer of PVDF-TrFE and collagen fibrils using vertical and lateral modes of PFM. In PVDF-TrFE, high-resolution imaging of in-plane and out-of-plane components of polarization allowed delineation of the molecular chains orientation within individual grains. It has been shown that depending on the field strength, local switching in PVDFTrFE can proceed either by 120 or 180 dipole rotation about the molecular chain. In collagen, analysis of the vertical and lateral PFM signals revealed polar anisotropy of the electromechanical properties along the axes of the fibrils. Surface plots of the effective piezocoefficients have been generated for both material systems to explain the observed piezoresponse maps. High-resolution PFM imaging along with the interpretation of the acquired piezoresponse maps of collagen fibrils in terms of orientation-dependent molecular properties provides a crucial insight into the structure-prop- erty relationship of the biological materials. The obtained results provide a basis for the experimental methods that will further our understanding of the electronic properties of synthetic polymers and physiological functionality of natural biopolymers.
ACKNOWLEDGMENTS
This research was supported by the U.S. Department of Energy, Office of Basic Energy Sciences, Division of Materials Sciences and Engineering under Award DE-SC0004530 and by the Nebraska Research Initiative. The authors thank
Dr. Steven Jesse, ORNL, for his help with generating the surface plots of piezoelectric response. The collagen sample was kindly provided by Dr. G. E. Fantner, EPFL.
1C. S. Meena, S. A. Mengi, and S. G. Deshpande, Proc. Indian Acad. Sci. Chem. Sci. 111, 319 (1999).
2S. Ducharme, T. J. Reece, C. M. Othon, and R. K. Rannow, IEEE Trans. Device Mater. Reliab. 5, 720 (2005).
3V. Bharti, X.-Z. Zhao, Q. M. Zhang, T. Romotowski, F. Tito, and R. Ting, Mater. Res. Innovat. 2, 57 (1998).
4A. J. Lovinger, Science 220, 1115 (1983).
5K. Kimura and H. Ohigashi, Jpn. J. Appl. Phys. 25, 383 (1986).
6S. Palto, L. Blinov, A. Bune, E. Dubovik, V. Fridkin, N. Petukhova, K. Verkhovskaya, and S. Yudin, Ferro. Lett. 19, 65 (1995).
7Y. J. Park, S. J. Kang, B. Lotz, M. Brinkmann, A. Thierry, K. J. Kim, and C. Park, Macromolecules 41, 8648 (2008).
8M. Alexe and A. Gruverman, 2004, Nanoscale Characterization of Ferroelectric Materials: Scanning Probe Microscopy Approach, Springer, Berlin.
9S. Ducharme, S. P. Palto, and V. M. Fridkin, 2002, in Handbook of Thin Film Materials Vol. 3, edited by H. S. Nalwa, Academic, San Diego.
10T. Gutsmann, G. E. Fantner, J. H. Kindt, M. Venturoni, S. Danielsen, and P. K. Hansma, Biophys. J. 86, 3186 (2004).
11Z. Hu, M. Tian, B. Nysten, and A. M. Jonas, Nature Mater. 8, 62 (2009). 12Y. Liu, D. N. Weiss, and J. Li, ACS Nano 4, 83 (2010).
13S. Ducharme and A. Gruverman, Nature Mater. 8, 9 (2009).
14S. Ducharme, V. M. Fridkin, A. V. Bune, S. P. Palto, L. M. Blinov, N. N. Petukhova, and S. G. Yudin, Phys. Rev. Lett. 84, 175 (2000).
15M. Bai and S. Ducharme, Appl. Phys. Lett. 85, 3528 (2004).
16 J. Li, Y. Luo, M. Bai, and S. Ducharme, J. Mechanics and Physics of Solids 54, 2162 (2006).
17M. Bai, M. Poulsen, and S. Ducharme, J. Phys: Condens. Matter 18, 7383 (2006).
18P. Sharma, T. Reece, D. Wu, V. M. Fridkin, S. Ducharme, and A. Gruverman, J. Phys.: Condens. Matter 21, 485902 (2009).
19T. Furukawa, T. Nakajima, and Y. Takahashi, IEEE Trans. Diel. Electr. Insulation 13, 1120 (2006).
20K. Kimura, K. Kobayashi, H. Yamada, T. Horiuchi, K. Ishida, and K. Matsushige, Appl. Phys. Lett. 82, 4050 (2003).
21S. V. Kalinin, B. J. Rodriguez, S. Jesse, J. Shin, A. P. Baddorf, P. Gupta, H. Jain, D. B. Williams, and A. Gruverman, Microsc. Microanal. 12, 206 (2006).
22S. V. Kalinin, B. J. Rodriguez, J. Shin, S. Jesse, V. Grichko, T. Thundat, A. P. Baddorf, and A. Gruverman, Ultramicroscopy 106, 334 (2006).
23C. Harnagea, A. Pignolet, M. Alexe, and D. Hesse, Integrated Ferroelectrics 38, 667 (2001).
24R. E. Newnham, 2005, Properties of Materials: Anisotropy, Symmetry, Structure, Oxford University Press, New York.
25H. Goldstein, C. Poole, and J. Safko, Classical Mechanics, 3rd ed. (Addison Wesley, New York, 2000).
26K. Tashiro, K. Takano, and M. Kobayashi, Ferroelectrics 57, 297 (1984).
27 W. G. Cady, Piezoelectricity: An Introduction to the Theory and Applications of Electro-mechanical Phenomenon in Crystals (Dover, New York, 1962), Vol. 1.
28K. Tashiro, M. Kobayashi, H. Tadokoro, and E. Fukada, Macromolecules 13, 691 (1980).
29K. Omote, H. Ohigashi, and K. Koga, J. Appl. Phys. 81, 2760 (1997).
30S. V. Kalinin, B. J. Rodriguez, S. Jesse, T. Thundat, and A. Gruverman, Appl. Phys. Lett. 87, 053901 (2005).
31A. Gruverman, D. Wu, B. J. Rodriguez, S. V. Kalinin, and S. Habelitz, Biochem. Biophys. Res. Comm. 352, 142 (2007).
32C. Halperin, S. Mutchnik, A. Agronin, M. Molotskii, P. Urenski, M. Salai, and G. Rosenman, Nano Lett. 4, 1253 (2004).
33M. Minary-Jolandan and M.-F. Yu, Nanotechnol. 20, 085706 (2009). 34M. Minary-Jolandan and M. F. Yu, ACS Nano 3, 1859 (2009).
35 G. N. Ramachandran, Treatise on Collagen: Chemistry of Collagen (Academic, New York, 1967), Vol. 1.
36E. Fukuda, Biorheology 5, 199 (1968).
37C. Harnagea, M. Vallieres, C. P. Pfeffer, D. Wu, B. R. Olsen, A. Pignolet, F. Legare, and A. Gruverman, Biophysical J. 98, 3070 (2010).
38A. A. Gunjian and H. L. Chen, IEEE Trans. Biomed. Eng. 21, 177 (1974).