

Статьи на перевод PVDF_P(VDF-TrFE) / Physical structure of P(VDF-TrFE)_barium titanate submicron composites
.pdfOpen Archive Toulouse Archive Ouverte (OATAO)
OATAO is an open access repository that collects the work of Toulouse researchers and makes it freely available over the web where possible.
This is an author-deposited version published in: http://oatao.univ-toulouse.fr/ Eprints ID: 5506
TO LINK TO THIS ARTICLE: DOI: 10.1016/j.jnoncrysol.2011.12.028
URL: http://dx.doi.org/10.1016/j.jnoncrysol.2011.12.028
TO CITE THIS VERSION:
Capsal, Jean-Fabien and Dantras, Eric and Dandurand, Jany and Lacabanne, Colette Physical structure of P(VDF-TrFE)/barium titanate submicron composites. (2012) Journal of Non-Crystalline Solids, vol. 358 (n° 4). pp. 794-798. ISSN 0022-3093
Any correspondence concerning this service should be sent to the repository administrator: staff-oatao@listes.diff.inp-toulouse.fr

Physical structure of P(VDF-TrFE)/barium titanate submicron composites
Jean-Fabien Capsal a, Eric Dantras b, , Jany Dandurand b, Colette Lacabanne b
a Piezotech S.A.S., 9 rue de Colmar, 68220 Hésingue, Université Paul Sabatier, 31062 Toulouse, France b Physique des Polymères, CIRIMAT, Institut CARNOT, Université Paul Sabatier, 31062 Toulouse, France
Keywords:
Dielectric permittivity; Composite;
Physical structure; Molecular mobility
A B S T R A C T
Dynamic Dielectric Spectroscopy and Thermo Stimulated Current were used to investigate of the dielectric relaxation of hybrid Poly(vinylidene-fluoride-trifluoroethylene)/barium titanate 700 nm composites with 0–3 connectivity. The results obtained by this method allow us to describe the physical structure of these composites in the glassy state at a nanometric scale. The decrease of the activation enthalpies and activation entropies involved in the dynamics of the α relaxation is attributed to: the decrease of Cooperative Rearranging Region sizes and an increase of intra/inter macromolecular interactions in the amorphous phase with the volume fraction.
1. Introduction
Since the discovery of the piezoelectric behavior of Poly(vinylidene fluoride) by Kawai [1] and the understanding of the molecular origin of this electroactivity [2–4], organic ferroelectric materials have attracted interest for their potential use in specific applications such as low weight and flexible sensors [5]. Many classes of polymers have shown piezoelectric and pyroelectric activities such as odd-polyamide [6], even odd polyamide copolymer [7] and more recently the copolymer Poly(vinylidene fluoride-trifluoroethylene) [8,9] and the terpolymer Poly(vinylidene fluoride-trifluoroethylene-chlorofluoroethylene) [10,11]. For electroactive applications, Poly(vinylidene fluoride-trifluoroethylene) copolymer was the most useful polymer because of the low poling field required to induce ferroelectric behavior and high dielectric permittivity compared to other class of ferroelectric polymer. Another important point was that this copolymer did not require any mechanical stretching before polarization [12]. Even if this polymer might have interesting ferroelectric properties, the piezoelectric and pyroelectric properties were much lower than well-known inorganic ferroelectric materials [13,14]. To overcome this disadvantage, some works were devoted to the dispersion of ferroelectric inorganic fillers (micron size) in a polymeric matrix in 0–3 connectivity [15–18]. Depending on the polarization procedure [19–22] these authors have shown that the ferroelectric inorganic nanoparticles could increase the ferroelectric activity of organic materials. As far as we know very few works were devoted to the influence of the ferroelectric inorganic phase on the molecular mobility of the organic phase. In this study, barium titanate submicron particles with a mean
Corresponding author.
E-mail address: dantras@cict.fr (E. Dantras).
diameter of 700 nm were dispersed in a Poly(vinylidene fluoridetrifluoroethylene) matrix. Dynamic Dielectric Spectroscopy and Thermo Stimulated Current were employed to characterize the physical structure in the solid state of these composites at a nanometric scale.
2. Experimental section
2.1. Samples elaboration
The mean diameter of barium titanate particles is 700 nm. Poly(- vinylidene-fluoride-trifluoroethylene) (P(VDF-TrFE) 70:30 mol.%) has been purchased from Piezotech (France). Copolymer powders were dissolved in acetone. Then the required barium titanate powder (BaTiO3 or BT) was dispersed to form a mixture by ultrasonication. During 24 h the samples were dried at 110 °C to remove the solvent. The composites were hot pressed to form thin films of thickness from 100 to 150 μm. Volume fraction (ϕ) of ceramic in composite films ranged from 0.07 to 0.41.
2.2. Dielectric measurements
Dynamic Dielectric Spectroscopy (DDS) was performed using a BDS400 covering a frequency range of 10−2 Hz–3.10 [6] Hz with 10 points per order of magnitude. Experiments were carried out in a temperature range from −150 °C to 150 °C. Dielectric isothermal spectra were measured every 2 °C. Before each frequency scan, temperature was kept constant to ±0.2 °C. The real ε′ and imaginary ε″ parts of the relative complex permittivity ε* were measured as a function of frequency f at a given temperature T.
The complex dielectric permittivity ε was fitted to the Havriliak– Negami (HN) function:
! |
ðωÞ ¼ ε∞ þ |
ðεs−ε∞Þ |
|
ε |
|
: |
|
!1 þ ðiωτÞβHN "γHN |
|||
Where εs is the static permittivity, ε∞ is the permittivity at high frequency, and βHN, γHN are the Havriliak–Negami parameters.
Complex Thermo Stimulated Current (TSC) thermograms were carried out on a TSC/RMA Analyser. For complex experiments, the sample was polarized by an electrostatic field during tp =2 min over a temperature range from the polarization temperature Tp =50 °C down to the freezing temperature T0. Then the field was turned off and the depolarization current was recorded at a constant heating rate (qh = +7 °C.min−1), the equivalent frequency of the TSC spectrum was feq ~10−2–10−3 Hz. Elementary TSC thermograms were performed in a polarization window of 5 °C. Then the field was removed and the sample cooled at a temperature Tcc =Tp −30 °C. The depolarization current was recorded at a constant heating rate (qh =+7 °C.min−1). Each elementary thermogram was recorded by shifting the polarization window 5 °C toward a higher temperature. The temperature dependence of relaxation times follows an Arrhenius–Eyring equation:
τðTÞ ¼ |
h |
exp − |
S |
exp |
H |
: |
|
|
|||||
kB T |
R |
RT |
Where kB is the Boltzmann's constant, R is the gas constant; h is the Planck's constant, H the activation enthalpy and S the activation entropy.
3. Results
3.1. Dielectric relaxation modes in dynamic spectroscopy
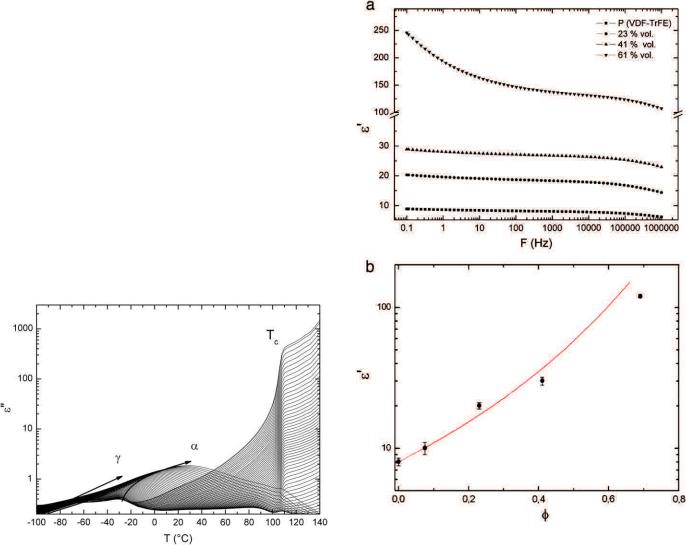
The evolution of ε″ versus frequency is shown in Fig. 1 for P(VDFTrFE)/BaTiO3 composites with 700 nm particle sizes. The volume fraction was maintained at 41%. Two dielectric modes were clearly identified in the amorphous phase: a lower temperature mode γ at −80 °C associated with the mobility of short sequences, an intermediate temperature mode α at −25 °C was attributed to the dielectric manifestation of the glass transition. At higher temperature, an isothermal phenomenon attributed to the dielectric manifestation of the Curie transition of the organic phase was observed. The Curie temperature [19] of these particles was already pointed out by Differential Scanning
Calorimetry (DSC) near 130 °C. Furthermore, relaxation times extracted from these data with Havriliak Negami equation did not show an influence of the BT particles on P (VDF-TrFE) mobility.
Fig. 2(a) showed the evolution of the conservative part of the dielectric permittivity at 26 °C as a function of frequency for various volume fractions. BT particles increase drastically the ε′ value from 18.3 at 23% vol. to 136 at 61% vol. An evolution of ε′ at low frequency was also observed for high BT content. Heterogeneous systems were generally characterized at low frequency and high temperature by an important increase of the dielectric permittivity associated with the Maxwell Wagner Sillars [23] (MWS) phenomenon. The values of ε′ at 1 kHz as function of ϕ were reported in Fig. 2(b). Experimental values were well fitted by the following Bruggeman [24] model for volume fraction below 45% vol.
ð1−ΦÞ |
|
εm&εeff |
þ Φ |
εincl−εeff |
¼ 0 |
||||
ε |
m |
þ 2ε |
ε |
incl |
þ 2ε |
||||
|
|
|
|||||||
|
|
eff |
|
|
eff |
|
|||
With Φ the volume fraction, εm the dielectric permittivity of the matrix, εincl the dielectric permittivity of the inclusion, εeff the effective dielectric permittivity.
According to this model, we could extract the dielectric permittivity of the inorganic part of the composite. From the Bruggeman model, ε′ of
Fig. 1. Imaginary part of the dielectric permittivity, isochronous between 100 Hz and 1 MHz for P(VDF-TrFE)-BaTiO3 700 nm with 41% vol.
Fig. 2. (a) Real part of the dielectric permittivity as function of frequency for P(VDFTrFE)/BaTiO3 composites with ϕ ranging from 0% (■), 23% (●), 41% (▲) to 61% vol (▼). (b) Real part of the dielectric permittivity P(VDF-TrFE) (●) as function of volume fraction of BaTiO3 700 nm fitted by Bruggeman model in red line.
BaTiO3 700 nm was evaluated to be nearly 1500. This value was in good agreement with bulk ceramic sintered from BaTiO3 700 nm particles using Spark Plasma Sintering technique. For ϕ>45%, the experimental points departed from the Bruggeman model. For these high volume fractions the connectivity of the biphasic system was modified by the agglomeration of particles. 0–3 connectivity, in Newnham notation, did not govern the physical properties of the composite. For ϕ>45%, 3–3 connectivity described the dispersion of inorganic particles in the P(VDF-TrFE) matrix. This point was already observed in thermoplastic polymers by Scanning Electron Microscopy and published [25].
3.2. Dielectric relaxation modes in thermal analysis
The influence that the volume fraction of inorganic fillers has on the molecular mobility of the amorphous phase of the polymeric matrix was characterized using the thermally stimulated currents technique. The samples were polarized under an electric field of Ep =1 kV/mm at Tp =50 °C for 2 min then the composites were cooled at Tcc =−100 °C and short-circuited for 2 min. Thermograms were recorded from −90 °C to 110 °C.
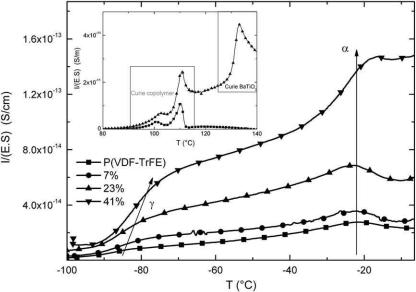
Complex TSC thermograms at low temperatures of P (VDF-TrFE)/ BaTiO3 composites were presented in Fig. 3. The relaxation modes shown in this figure were related to the amorphous organic phase. For purpose of clarity and in order to compare composites depolarization current was normalized to: the fraction of polymer in the composite, the electric field and the surface of the sample. Whatever the volume fraction of BaTiO3 particles, two modes were observed in the low temperature range. As the low temperature relaxations γ and α appeared below the poling temperature, these relaxations have been attributed to dipolar relaxation phenomena. In the inset, the complex dielectric manifestation of the Curie transition of P(VDF-TrFE) appeared at 100 and 110 °C, which is consistent with DDS and DSC measurements [26,27]. These high temperature relaxations are associated with the crystalline phase of the copolymer. Relaxation of the barium titanate particles was pointed out near 130 °C.
The localization versus temperature of the γ mode was influenced by the volume fraction of inorganic phase. In the case of P(VDF-TrFE) the γ mode appears at Tγ=−80 °C. This mode was attributed to the dipolar relaxation of small segments of the macromolecule in the amorphous phase. As the barium titanate fraction increased the
peak temperature increased. The peak temperature of the composite made with ϕ=41% was 10 °C higher than the copolymer.
The peak temperature of the α relaxation until 41% volume fraction was not so influenced by the volume fraction than γ mode. This relaxation was attributed to the glass transition dielectric manifestation. The peak temperature Tα=−20 °C was in agreement with DDS measurement of the α relaxation for P(VDF-TrFE) copolymer.
The amplitude of the TSC thermograms increased with the volume fraction. As the barium titanate was a pyroelectric material, it was attributed to the pyroelectric current associated with the inorganic phase.
Fractional TSC [28] was employed to characterize the fine structure of the major α relaxation. For each elementary thermogram, the sample was polarized under a field Ep=1 kV/mm in a temperature range of 5 °C. Fig. 4 shows the complex and the associated elementary thermograms of the α mode of P(VDF-TrFE) copolymer. From each elementary thermogram, we calculate the relaxation times associated with the α relaxation process. The evolution of α relaxation times had an Arrhenius behavior; we were able to determine the activation enthalpies and the activation entropies at various temperatures according to the barriers theory.
The activation enthalpies versus elementary peak temperatures of the α mode for P(VDF-TrFE) and composites with ϕ ranging from 7% to 41% were shown in Fig. 5. Whatever the volume fraction, the activation enthalpies of the composites reach a maximum value before decreasing. The null activation entropy was represented by a dashed line also called the Starkweather “line” [29]. For α mode, experimental data departed from the Starweather “line” whatever the volume fraction. It meant that the molecular mobility of the dipolar entities involved in the α process generated an increase in entropy. This point was consistent with a relaxation process attributed to the glass transition molecular mobility. As the volume fraction of barium titanate filler increased the maximum and minimum values of the α relaxation enthalpy decreased: enthalpy values were closer to the Starkweather “line” and the α relaxation process tended to be more localized.
4. Discussion
The pre-exponential factor τ0 which was proportional to the activation entropy ( S) was presented in Fig. 6 for the α mode of P(VDF-
Fig. 3. TSC thermograms (Tp =50 °C Ep =1 kV/mm, Tcc =−100 °C) of P(VDF-TrFE)/BaTiO3 composites with ϕ ranging from 0% (■), 7% (●), 23% (▲) to 41% (▼). Each thermogram is normalized to the volume fraction of P(VDF-TrFE). (inset) The high temperature range of the TSC thermograms.
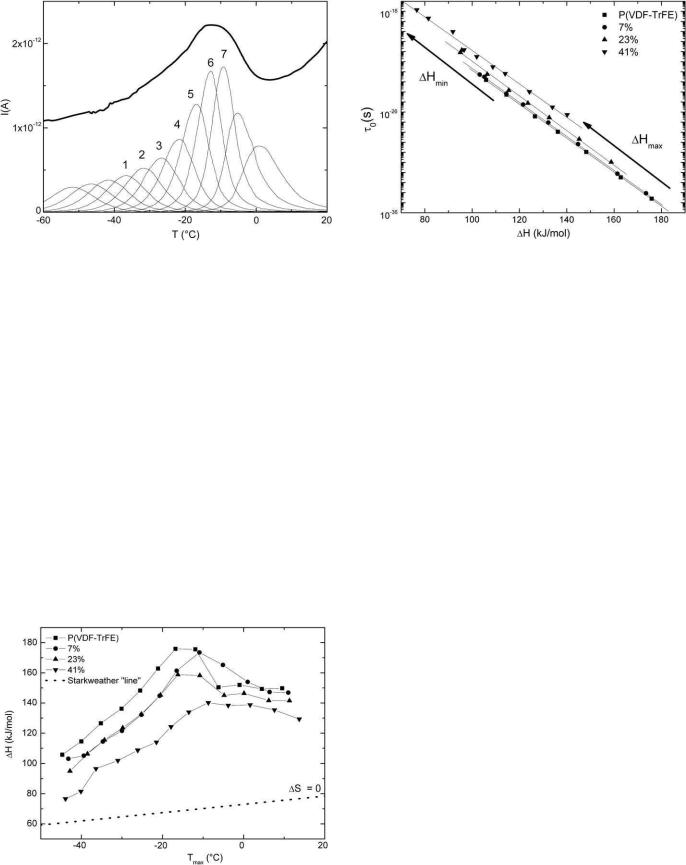
Fig. 4. Complex (in bold line) and associated elementary TSC thermograms of the α mode of the P(VDF-TrFE) copolymer.
Fig. 6. Pre-exponential factor τ0 (in inverse proportion with the activation entropy S) versus the activation enthalpy H for P(VDF-TrFE)/BaTiO3 composites with ϕ=0% (■), 7% (●), 23% (▲), 41% (▼).
TrFE) and composite. In both cases a linear relationship between enthalpy and entropy was observed which is characteristic of a compensation law.
As the volume fraction of the barium titanate was increased, the pre-exponential factor was shifted toward higher times. τ0 and the activation entropy were inversely proportional to the increase of inorganic content and were responsible for a decrease of the system disorder. It was attributed to an increase of intra/inter macromolecular interactions in the amorphous phase. The main variation reports in this study concerned the evolution of τ0 with the enthalpy. It can be seen in Fig. 6 that the maximum and minimum values of the activation enthalpies decrease with an increase in volume fraction. This decrease is proportional to ϕ. The temperature range of these enthalpies was not influenced by the inorganic content. The decrease of the maximum and minimum values of the activation enthalpies was attributed to the decrease of the Cooperative Rearranging Regions (CRR) size [30,31] with the volume fraction.
Dynamic Dielectric Spectroscopy measurements showed that the physical structure was independent from the volume fraction in the liquid state. In the same way, Differential Scanning Calorimetry experiments, not presented here for purpose of clarity, showed that the barium titanate contents only had a weak influence on glass
Fig. 5. Activation enthalpy H versus the maximum peak temperature Tmax of each elementary TSC process of α mode for P(VDF-TrFE)/BaTiO3 composites with ϕ ranging from 0% (■), 7% (●), 23% (▲) to 41% (▼). The Starkweather line is plotted in dotted line.
transition and crystallinity ratio of these composites. Thus, the decrease of the CRR size cannot be explained by any interactions between inorganic and organic phases. Densification effect due to the increase of the inorganic content and an increase of the intra/inter macromolecular interactions in the amorphous phase appeared to be responsible for the slight decrease of the CRR size. This conclusion was in good agreement with a recent study [25] made on PA11/ BaTiO3 composites.
5. Conclusion
The work presented here describes the influence that the volume fraction of inorganic barium titanate submicron fillers with a mean diameter of 700 nm has on the molecular mobility of the amorphous phase in the copolymer P(VDF-TrFE).
The TSC measurements were used to investigate the physical structure of the composite at a nanometric scale. The densification of the matrix with the increase of the inorganic phase causes a decrease of the activation enthalpies and activation entropies. These activation parameters were involved in the dynamics of the α relaxation associated with the delocalized mobility near Tg. These evolutions were attributed to the decrease of Cooperative Rearranging Region sizes and an increase of intra/inter macromolecular interactions in the amorphous phase.
Acknowledgments
The authors wish to acknowledge the financial support of DGCIS and Région Midi-Pyrénées under NACOMAT program.
References
[1]H. Kawai, Jpn. J. Appl. Phys. 8 (1969) 975.
[2]A.J. Lovinger, Science 220 (1983) 1115.
[3]M. Oshiki, E. Fukada, J. Mater. Sci. 10 (1975) 1.
[4]L. Ibos, A. Bernes, C. Lacabanne, Ferroelectrics 320 (2005) 48.
[5]C.J. Dias, D.K. Das, Gupta, IEEE Trans. Dielectrics Electr. Insul. 3 (1996) 706.
[6]J.I. Scheinbeim, J.W. Lee, B.A. Newman, Macromolecules 25 (1992) 3529.
[7]J.F. Capsal, E. Dantras, J. Dandurand, C. Lacabanne, Polymer 51 (2010) 4606.
[8]G.A. Samara, F. Bauer, Ferroelectrics 135 (1992) 385.
[9]H. Wang, Q.M. Zhang, E. Cross, A.O. Sykes, J. Appl. Phys. 74 (1994) 3394.
[10]R.J. Klein, J. Runt, Q.M. Zhang, Macromolecules 36 (2003) 7220.
[11]H.M. Bao, J.F. Song, J. Zhang, Q.D. Shen, C.Z. Yang, Q.M. Zhang, Macromolecules 40 (2007) 2371.
[12]J.B. Lando, W.W. Doll, J. Macromol. Sci. Phys. B2-2 (1968) 205.
[13]T.A. Perls, T.J. Diesel, D.W. Dobrov, J. Appl. Phys. 29 (1958) 1297.
[14]W.R. Cook, D.A. Berlincourt, F.J. Scholz, J. Appl. Phys. 34 (1963) 1392.
[15]R.E. Newnham, D.P. Skinner, L.E. Cross, Mater. Res. Bull. 13 (1978) 525.
[16]T. Furukawa, K. Fujino, E. Fukada, Jpn. J. Appl. Phys. 15 (1976) 2119.
[17]C. Muralidhar, P.K.C. Pillai, J. Mater. Sci. Lett. 6 (1987) 346.
[18]C. Muralidhar, P.K.C. Pillai, J. Mater. Sci. 23 (1988) 1071.
[19]J.F. Capsal, E. Dantras, J. Dandurand, C. Lacabanne, J. Non-Cryst. Solids 353 (2007) 4437.
[20]J.F. Capsal, E. Dantras, L. Laffont, C. Lacabanne, J. Non-Cryst. Solids 356 (2010) 629.
[21]Q.Q. Zhang, H.L.W. Chan, Q. Zhou, C.L. Choy, Mater. Res. Innov. 2 (2000) 216.
[22]K.H. Lam, X.X. Wang, H.L.W. Chan, Compos. A: Appl. Sci. Manuf. 36 (2005) 1595.
[23]F. Kremer, A. Schönals, Broad Band Dielectric Spectroscopy, Berlin, Springer, 2003.
[24]D.A.G. Bruggeman, Ann. Phys. 24 (1935) 636.
[25]J.F. Capsal, E. Dantras, J. Dandurand, C. Lacabanne, J. Non-Cryst. Solids 357 (2011) 3410.
[26]Y. Takahashi, T. Furukawa, Macromolecules 37 (2004) 2807.
[27]J.W. Wang, Q.D. Shen, C.Z. Yang, Q.M. Zhang, Macromolecules 37 (2004) 2294.
[28]G. Teyssedre, S. Mezghani, A. Bernes, C. Lacabanne, in: J. Runt, J. Fitzgerald (Eds.), Dielectric Spectroscopy of Polymeric Materials, 1997, p. 227.
[29]H.W. Starkweather, Macromolecules 14 (1981) 1277.
[30]E. Donth, J. Non-Cryst. Solids 307 (2002) 364.
[31]A. Saiter, N. Delpouve, E. Dargent, J.M. Saiter, Eur. Polymer J. 43 (2007) 4675.