

Статьи на перевод PVDF_P(VDF-TrFE) / Bystrov2011(6_t14)
.pdfMathematical Biology and Bioinformatics. 2011. V. 6. № 2. P. t14-t35. URL: http://www.matbio.org/2011/Bystrov2011(6_t14).pdf
Original Russian text © Bystrov V.S., Paramonova E.V., Dekhtyar Y., Katashev A., Polyaka N., Bystrova A.V., Sapronova A.V., Fridkin V.M., Kliem H., Kholkin A.L., 2011, published in Matematicheskaya biologiya i bioinformatika, 2011, V. 6. № 2. P. 273–297. URL: http://www.matbio.org/2011/Bystrov2011(6_273).pdf
======================= MATHEMATICAL MODELING ======================
UDK 530.1: 537.226.33: 541.1: 577.: 681.2
Computational Studies of PVDF and P(VDF-TrFE) Nanofilms Polarization During Phase Transition Revealed by Emission Spectroscopy
©2011 Bystrov V.S.*1,2, Paramonova E.V.1, Dekhtyar Y.3, Katashev A.3, Polyaka N.3, Bystrova A.V.4, Sapronova A.V.5, Fridkin V.M.6, Kliem H.7, Kholkin A.L.2
1Institute of Mathematical Problems of Biology RAS, Pushchino, Russia 2Department of Ceramics and Glass Engineering & CICECO, University of Aveiro, Aveiro,
Portugal
3Institute of Biomedical Engineering and Nanotechnology, Riga Technical University, Riga,
Latvia
4Institute of Theoretical and Experimental Biophysics RAS, Pushchino, Russia 5Bergen Centre for Computational Science, Unifob AS, Bergen, Norway 6Institute of Crystallography, RAS, Moscow, Russia
7Institute of Electrical Engineering Physics, University of Saarland, Saarbruecken, Germany
Abstract. Electronic structure and self-polarization of P(VDF-TrFE) LangmuirBlodgett nanofilms according to their thickness, composition and structural conformation under temperature phase transition were analyzed. Both thermostimulated exoelectron emission (TSEE) spectroscopy and computational simulation, including quantum-chemical calculations from first principles, were provided. PVDF and composite P(VDF-TrFE) (70:30) molecular chains as Trans and Gauche conformers as well as crystal cells were modeled for these agreedupon TSEE analyses. The quantum-chemical calculations and the computational simulation were based on the density functional theory (DFT) as well as semiempirical (PM3) methods. It was demonstrated that the energies of electron states as well as the total energies of the studied PVDF and P(VDFTrFE) molecular clusters during phase transformation influenced electron work function and electron affinity. The performed combined analysis of the TSEE experimental data as well as the computational data of the molecular models showed the effectiveness of that joined approach. TSEE for the first time was in use for contactless measurements of nanofilm polarization and characterizations of the phase transition. The proposed new method can be widely used in nanobiomedicine, particularly in development of new bone bio-implants, including built-in sensors (new smart nanotechnology).
Key words: polymer ferroelectrics, polarization and depolarization, thermo-stimulated exoelectron emission, computational molecular modeling, density functional theory, semiempirical method, electron band energies, electron work function and affinity.
* vsbys@mail.ru
COMPUTATIONAL STUDIES OF PVDF AND P(VDF-TRFE) NANOFILMS POLARIZATION DURING PHASE TRANSITION
INTRODUCTION
Ferroelectric thin Langmuir–Blodgett (LB) films, based on the poly(vinylidene fluoride) (PVDF) and poly(vinylidene fluoride–trifluoroethylene) P(VDF–TrFE) copolymers, clearly demonstrated polarization switching phenomena on nanometer size scale with local ferroelectric polarization reversal on the atomic-molecular level [1–5]. Now these LB polymer films are widely explored, using of various techniques, including nanoscale characterization by piezoresponse force microscopy (PFM) method [6–11], as novel prospective ferroelectric nano-material for their applications in nanotechnology and microelectronics, for data storage and new non-volatile memory cells [12], in biomedicine and nanomedicine as a promising component of various nanocomposites due to their acoustic and piezoelectric properties having a high compatibility with many organic and biological molecules and tissues [13–18]. Nevertheless many of these important physical and structural properties of the PVDF copolymers thin films are not clear yet. Especially it refers to its polarization switching phenomena in various conditions and compositions. One of promising ideas is to use actuators made of biocompatible polyvinylidene fluoride (PVDF) piezoelectric materials. An actuator is placed on an implant’s surface and stimulates bone growth by electrical and mechanical stimulation of osteoblast cells [19, 20] due to high surface charge – polarization of PVDF and P(VDF–TrFE). As such, they are similar to recently developed highly polarized (surface charged) hydroxyapatite (HAP) [21], especially in the form of nanostructured porous ceramics (PERCERAMICS) [22]. It has been showed that the number of attached osteoblasts sharply increases on the negatively charged HAP surface [23].
As it is well known, in ferroelectrics polarization is coupled with piezoelectric constants [24]. Use of PVDF means that mechanical stimulation of bone growth depends on the amount of electrical energy applied only, and that the bone growth can be stimulated in different directions by changing piezoelectric constants. This concept of smart structures can be adapted to other active devices. In this case it is necessary to know mechanisms of charging (polarization formation) and be able to control them. It is important not to distort the dynamics of the behaviour of the controlled object.
Such non-contact measurements of the surface charge (polarization) can be performed by the method of thermo-stimulated exoelectronic emission (TSEE) [25–27], which allows us of measuring of changes in work function, and determining the value of surface charge (polarization). For correct determination of the polarization it is necessary to have a corresponding correct molecular model for the mechanisms of the processes occurring in the surface layers of the sample. For this purpose, computational modeling from first principles and studies for several structures of the PVDF and P (VDF-TrFE) molecular models at different phase conformations – Trans (T) and Gauche (G) – have been performed. The appropriate structures of the two states of the sample – in a polar ferroelectric phase and a nonpolar paraelectric phase – were determined, corresponding to the molecular models of P(VDF–TrFE) crystal cells in the Trans and Gauche conformations. The obtained data allowed us of calculating of electronic spectra and constructing of diagrams of energy bands for these two different phases, as well as determining of the gap (forbidden energy band) and its changes during phase transition. It is important that these parameters depend on the internal electric field that determines their tilting and the shift, which appears on the surface, as a function of surface charge (polarization). On the other hand, changes of the surface charge alter the work function measured by TSEE: in different phases (and conformations) these changes vary. The created model, based on the energy band structures and their changes during phase transition, allows us of non-contact measuring of polarization through the data of the work function, registered by TSEE.
t15
Mathematical Biology and Bioinformatics. 2011. V. 6. № 2. URL: http://www.matbio.org/2011/Bystrov2011(6_t14).pdf
BYSTROV et al.
In this paper we report on our studies of polarization properties of PVDF copolymer films by the use, for the first time for these purposes, of a novel contactless method - thermostimulated exoelectron emission (TSEE) analysis [25–27], coupled with molecular modeling from first principles. These studies continue the series of our previous investigations of ferroelectric and nanoscale properties of thin LB PVDF copolymer films [11, 16–18]. The proposed new method can be widely used in bionanomedicine, particularly in the development of new bone bio-implants, including built-in sensors (new smart nanotechnology).
EXPERIMENTAL AND COMPUTATIONAL DETAILS
1. Preparation of samples
Preparation, structure, phase transitions and ferroelectric properties of poly(vinylidene fluoride-trifluorothylene) P(VDF–TrFE) films prepared by Langmuir–Blodgett (LB) method were described in detail in [1–3]. They manifested spontaneous polarization Ps ~ 0.1 cm−2 in the polar orthorhombic phase “2mm” (according to the standard crystallographic classification). At 80–100 oC (depending on the proportion of VDF to TrFE) the copolymer passes into the nonpolar hexagonal phase “6:m” via a first-order phase transition. Highquality thin films of ferroelectric P(VDF–TrFE), (70:30) were produced by the LB method using the horizontal Schafer variation of the LB technique. The optimal surface pressure on the isotherm was chosen 6 mN m−1. P(VDF–TrFE) powder from Piezotech Inc. of concentration 0.1 g/l was used. The samples were prepared in Saarbruecken and had structures with 10, 20, 30 and 50 depositions on the glass substrate [4, 5]. For this work we used the samples with 10 and 30 depositions from this series. Film thickness was determined both ellipsometrically [4, 5] and by atomic force microscopy (AFM) technique [6, 11]. For the prepared samples it was determined that one transfer corresponded to one monolayer (ML) with average thickness 0.5 nm [4, 5].
2. Analytical and structural characterization of the films
For structural characterization of the films in this work the atomic-resolution scanning tunnelling microscopy (STM) was used. The obtained images showed that the films could have excellent crystalline structure with the polymer chains parallel to each other in the plan of the film. Besides STM, the structure of LB films was studied by means of X-ray and neutron diffractometry [1–3]. Additionally for characterization of samples atomic force microscopy (AFM), especially piezoelectric force microscopy (PFM) was used for detailed structural characterization of the film surface and width. Both topography and piezoelectric images were performed at the University of Aveiro by PFM method using a commercial Scanning Force Microscope (Multimode, Nanoscope IIIA, Veeco) equipped with a function generator and a lock-in amplifier [6, 11]. No piezoelectric contrast or domains could be found on the piezoelectric image before application of writing voltage, just a weak background signal that could appear due to either self-polarization of the surface layer or to an apparent signal determined by the contact potential difference between the tip and bottom electrode [11].
3. Thermo-stimulated exoelectron emission (TSEE) technique
Thermo-stimulated exoelectron emission (TSEE) was recorded by a photoelectron emission spectrometer for measurements at a vacuum chamber under a pressure of 10−4 Pa.
t16
Mathematical Biology and Bioinformatics. 2011. V. 6. № 2. URL: http://www.matbio.org/2011/Bystrov2011(6_t14).pdf
COMPUTATIONAL STUDIES OF PVDF AND P(VDF-TRFE) NANOFILMS POLARIZATION DURING PHASE TRANSITION
The heating rate of the samples equalled 0.4 grad/s. Necessary addition photostumulation of the second type of sample was provided by ultraviolet (UV) illumination from deuterium source DDS-30. The required photon energy was selected by means of a SF-26 monochromator. The frequency breadth did not exceed 0.08 eV. The values of measured work function Φ were estimated with the uncertainty that did not exceed ± 0.04 eV. For registration of electron emission a very sensitive electron detector was used. The secondary electron multiplier with noise on the level of 0.1–1 electron/second was applied [27].
4. Molecular model and computational approaches
In this work several versions of molecular models for PVDF ferroelectrics were developed and investigated using HyperChem 7.52 as well as 8.0 version (on the base of the various personal computers). For some cases of precise ab initio calculations the Gaussian98 on the Linux cluster of the IMPB RAS was used too. We studied the dependences of the main PVDF electrical properties (dipole momentum, polarization, energies of electron subsystem as well as the total energy of the systems) without and under applied electrical field for the explored molecular models of PVDF ferroelectrics with different length of the molecular chains and various conformations. Various computational methods were used, including quantumchemical calculations based on the density functional theory (DFT) as well as semi-empirical (PM3) methods, both in restricted Hartree-Fock (RHF) and in unrestricted Hartree–Fock (UHF) approximations. The details of the models and computational approaches are described in the sections given below.
RESULTS AND DISCUSSIONS
1. Thermo -stimulated exoelectron emission (TSEE) data and analysis
The thermo-stimulated exoelectron emission (TSEE) analysis was employed for testing of polarization of the PVDF as well as P(VDF–TrFE) specimens by a the novel non-contacting mode. TSEE analysis is very appropriate for the characterization of surface electronic structure in the produced P(VDF–TrFE) films of the different thickness and compositions. TSEE from dielectric and non metallic materials is typically provided by the thermo-electron emission mechanism [25–27]: the temperature (T) depending processes in the emitter being the modulation factor of the electron emission current (I). In the case of the ferroelectric PVDF (we use further only this abbreviation for short, if not necessary to mark TrFE component) film polarization/depolarization can become a modulation factor. Therefore, the features of the I(T) behavior characterize depolarization of the PVDF film. For the case of our ferroelectric thin films, deposited on a dielectric glass substrate (without any metallic electrodes), distribution of electron energy zones, their tilt and shift in the surface area are schematically presented on fig. 1.
The polarization P in PVDF film and corresponding internal electrical field EP shifts the electron energy zones, and the thermo-electron work function Φ , as well as electron affinity χ for the case of the plane model of thin PVDF film with thickness x, which are presented on Fig. 1. The resulting change of the electron potential energy φ(EP) can be written as the following:
x0 |
|
P |
|
|
|
|
|
φ(EP ) = −∫EP (P)dx = −EP x0 |
x0 |
, |
(1) |
||||
= − |
|
||||||
2εε0 |
|||||||
0 |
|
|
|
|
|
||
t17 |
|
|
|
|
|
|
Mathematical Biology and Bioinformatics. 2011. V. 6. № 2. URL: http://www.matbio.org/2011/Bystrov2011(6_t14).pdf

BYSTROV et al.
where ε is the relative dielectric permittivity and ε0 = 8.8541878... 10−12 C/(V m).
Fig. 1. Schematic of the energy zones and their shift under influence of the polarization electric field of a PVDF (and similar for P(VDF–TrFE)) thin film deposited on a glass substrate: Φ is the thermoelectronic emission work function, χ and χeff are the affinity and effective affinity of the electron, φ is the energy of electric field EP inside the PVDF (or P(VDF-TrFE)) film with polarization P and thickness x; EF is the energy of Fermi level, Ec and Ev are the energies of the conductance and valence bands in the PVDF film.
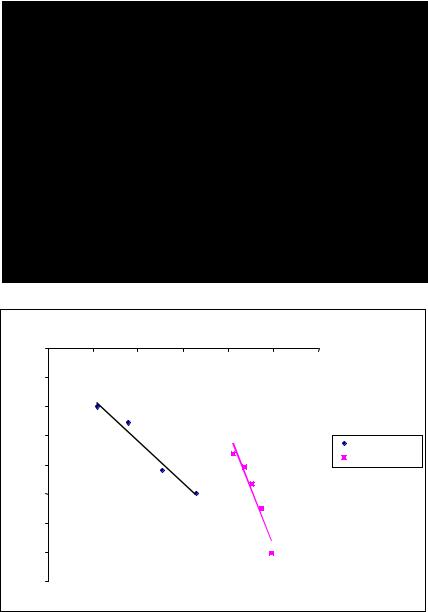
The TSEE from the PVDF films 10 (10 ML) and 30 (30 ML) monolayers thick (or ~5 nm and ~15 nm thick, respectively) deposited onto a glass substrate was detected. The TSEE spectra are provided in Fig. 2a. The 30 ML film in contrast with the 10 ML film demonstrates
a maximum (at Tmax = +100 oC). So, it means that 10ML film has not any polarization and its reorganization under heating, while 30 ML film has it. Because both PVDF and the glass
substrate are insulators, the electrons can escape both from PVDF and the glass local states; there is not enough T to provide thermo-induced emission from the valance band. Taking into account the thermo-electron emission mechanism of TSEE, the maximum obviously can result from the competition between the increased probability of thermo-emission and decreased density of electrons at the local states; both processes are supplied by T. When T < Tmax the emission of electrons is influenced by the electrical field of polarization (selfpolarization). However, at T > Tmax, the thermally induced depolarization “switches off” the electrical field. In this case the thermo-emission electron work function Φ should become smaller. To verify this, the value of Φ has been estimated using the equation of the thermoemission current:
ln |
I |
= ln A − |
Φ |
, |
(2) |
2 |
kT |
||||
|
T |
|
|
|
where A is the emission coefficient, k is the Boltzman constant. The lines (2) for 30 L film are presented in Fig. 2b. The values of Φ calculated from Fig. 2b graph are equal to 1.97 eV at
t18
Mathematical Biology and Bioinformatics. 2011. V. 6. № 2. URL: http://www.matbio.org/2011/Bystrov2011(6_t14).pdf
COMPUTATIONAL STUDIES OF PVDF AND P(VDF-TRFE) NANOFILMS POLARIZATION DURING PHASE TRANSITION
T < Tmax and 0.72 eV, when T > Tmax. The result (decreasing of Φ after T > Tmax) is in favor of the above proposed model. Moreover, the temperature induced depolarization corresponds to
the changes of the potential UP = 1.97 – 0.72 = 1.25 V or corresponding internal electrical filed EP on the distance equal to 30 ML with x = 15 nm: EP = 1.25V/15 nm = 0.083 V/nm = 8.3 105 V/cm = 0.83 MV/cm; this electrical field results from the PVDF film internal self polarization.
|
|
|
|
a) |
|
|
|
|
|
|
|
1/kT |
|
|
|
|
-5 |
|
|
|
|
|
|
|
27 |
28 |
29 |
30 |
31 |
32 |
33 |
|
-5.5 |
|
|
|
|
|
|
|
-6 |
|
|
|
|
|
|
) |
-6.5 |
|
|
|
|
|
T>Tmax |
|
|
|
|
|
|
||
2 |
|
|
|
|
|
|
T<Tmax |
ln(I/T |
-7 |
|
|
|
|
|
|
|
|
|
|
|
|
||
|
|
|
|
|
|
|
|
|
-7.5 |
|
|
|
|
|
|
|
-8 |
|
|
|
|
|
|
|
-8.5 |
|
|
|
|
|
|
|
-9 |
|
|
|
|
|
|
|
|
|
|
b) |
|
|
|
Fig. 2. TSEE spectra of the PVDF films deposited on a glass substrate: a) the PVDF films 10 (10 ML) and 30 (30 ML) monolayers thick; b) the fitted lines of equation (1) for the 30 ML film.
Because the electron potential energy φ(EP) is (1), therefore the spontaneous polarization inside this PVDF film can be expressed in absolute value as P = 2εε0 EP. For PVDF films 30 (30 L) monolayers thick (x ~ 15 nm) the polarization value, estimated for ε ~ 10 (see, for
t19
Mathematical Biology and Bioinformatics. 2011. V. 6. № 2. URL: http://www.matbio.org/2011/Bystrov2011(6_t14).pdf
BYSTROV et al.
example, ε data from [1,2,28–32] for P(VDF–TrFE)), is equal P = 0.0147 C/m2 ~ 1.5 µC/cm2. From [4, 5] data for the similar 30 ML P(VDF–TrFE) (70:30) sample with d = 16.3 nm (at T = 273K) polarization is ~ 5…7 µC/cm2. But this data is obtained directly after polarization in an applied electrical field, while in our case we have data with no electrical field applied (self-polarized) and after long time relaxation. It is known that in similar PVDF films usual relaxation (with time ~ 1 hour) causes drop of polarization value by 40…50 % [3, 4], so it can be lower, ~ 2….3 µC/cm2. After long storage times it may fall even lower, to ~ 1 µC/cm2. It is close to the estimated value in our case.
There was an attempt to polarize the 10ML film too. For this purpose the ultraviolet light radiated the specimen. Alongside its glass substrate was radiated and tested by photoelectron emission analyses to estimate an increment of the induced electrical field, the work function Φpe being the index of this. The Φpe was derived using the photoemission current Ipe equation
I pe = (Ep −Φpe )m , |
(3) |
where Ep is the energy of the photon, m is the power index.
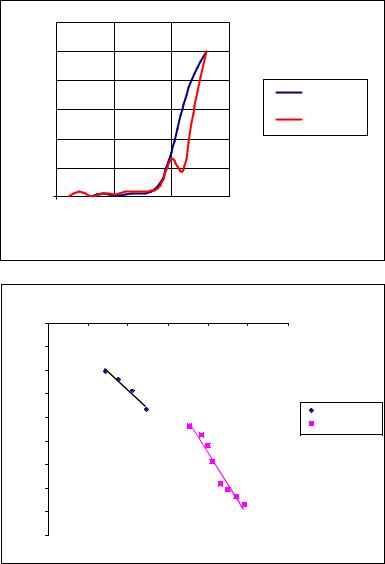
Radiation increased the value of Φpe from 5.1 eV to 5.2 eV, that meant that the surface of the glass substrate had been charged negatively (see Fig. 1). After this ultraviolet radiation the TSEE of this PVDF sample demonstrated a maximum at Tmax = +120 C (Fig. 3a). The lines (1) for 10 ML film are presented in Fig. 3b. The values of Φ calculated from Fig 3b graph were equal to 1.34 eV at T < Tmax and 0.08 eV, when T > Tmax. The result (decreasing of Φ after T > Tmax) is also in favor of the TSEE model given above. Because ultraviolet radiation provides the potential 5.2 – 5.1 = 0.1 V, the native potential by the PVDF film becomes equal to 1.34 – 0.1 = 1.24 V. Therefore the temperature depolarizes the film from 1.24 V to 0.08 V, i.e. to UP = 1.16 V, that corresponds to the electrical field EP of polarization in the film 10 ML thick with x = 5 nm: EP = 1.16 V/5 nm= 0.232 V/nm=23.2 105 V/cm = 2.32 MV/cm.
As the result, in the PVDF sample with 10 ML, which had not polarization P before the first experiment, after ultraviolet radiation measurements by the TSEE demonstrated polarization in this sample with EP ~ 23.2 105 V/cm.
Comparing this number with the above 8.3 105 V/cm characterizing 30 ML self polarized PVDF, one could conclude: 1) the 30 ML PVDF film in contrast with the 10 ML one is selfpolarized, 2) the thin (10 ML) PVDF film has a capacity for polarization induced by ultraviolet radiation and can supply polarization 2.8 times as high as that of the 30 ML self polarized film. Corresponding value of polarization of the 10 ML film (for the ε ~ 10) is equal to P ~ 0.0418 C/m2 ~ 4.2 µC/cm2. This value is close to the measured polarization data for a similar sample ~ 4...6 µC/cm2 [4, 5]. But it is data without considering relaxation.
It explains why this value for 10 ML is larger than the data for the 30 ML sample, while usually samples with a larger number of ML have greater polarization. The radiation excites electrons to the conductance band both from the glass substrate (the charge of the glass surface had negative potential), and, probably, from the P(VDF–TrFE) valence band too, because for PVDF and P(VDF–TrFE) the energy gap Egap ~ 5.1….5.6 eV [31–37] is close to the used energy of photons Epe ~ 5.2 eV… 5.3 eV. However, the main data on various types of glass demonstrate energy of photons Epe ~ 6…12 eV [38], only in the case of glass with Fe2O3 admixture the energy can be Epe ~ 5.3…5.4 eV. So, these usual values are greater than the values in our experiments. It means that excited electrons come into the conductance bands mainly from the region of the thin PVDF film. Another opportunity connected with the
t20
Mathematical Biology and Bioinformatics. 2011. V. 6. № 2. URL: http://www.matbio.org/2011/Bystrov2011(6_t14).pdf
COMPUTATIONAL STUDIES OF PVDF AND P(VDF-TRFE) NANOFILMS POLARIZATION DURING PHASE TRANSITION
existence of trap levels close to the bottom of the conductive band (PVDF sample as an n-type semiconductor) is discussed in the section given below.
|
1,2 |
|
|
|
I,arb.units |
1 |
|
|
|
0,8 |
|
|
|
|
|
|
|
|
|
|
0,6 |
|
|
|
|
0,4 |
|
|
|
|
0,2 |
T,C |
|
|
|
0 |
|
|
|
|
20 |
70 |
120 |
170 |
Before radiation
After radiation
|
|
|
|
a) |
|
|
|
|
|
|
|
1/kT |
|
|
|
|
-6 |
|
|
|
|
|
|
|
26 |
27 |
28 |
29 |
30 |
31 |
32 |
|
-6.5 |
|
|
|
|
|
|
|
-7 |
|
|
|
|
|
|
|
-7.5 |
|
|
|
|
|
|
) |
-8 |
|
|
|
|
|
T>Tmax |
2 |
|
|
|
|
|
||
ln(I/T |
|
|
|
|
|
T<Tmax |
|
|
|
|
|
|
|
||
-8.5 |
|
|
|
|
|
|
|
|
|
|
|
|
|
|
|
|
-9 |
|
|
|
|
|
|
|
-9.5 |
|
|
|
|
|
|
|
-10 |
|
|
|
|
|
|
|
|
|
|
b) |
|
|
|
Fig. 3. TSEE spectra of the 10 ML PVDF films deposited on a glass substrate: a) the PVDF films 10 ML thick before and after radiation; b) the fitted lines of equation (1) for the 10 ML film.
On the other hand, it must be emphasized that our direct experiments with pure glass sample show that its surface is charged negatively after this UV illumination. So, excited charges from the glass contribute into joint negative surface charges in any case too. As the PVDF films are very thin and photons can easily pass through them, a considerable part of the contributed charges may arise from the glass. On the negatively charged glass substrate PVDF chains are immediately oriented along arisen from substrate electric field – with positively charged hydrogen atoms towards the glass substrate and negatively charged fluorine atoms outwards the glass. As the result, inside PVDF films stable spontaneous polarization, which can be detected by TSEE spectroscopy method, arises.
t21
Mathematical Biology and Bioinformatics. 2011. V. 6. № 2. URL: http://www.matbio.org/2011/Bystrov2011(6_t14).pdf
BYSTROV et al.
2. Molecular modelling and computational analysis
2.1. Analysis of the models of main copolymer units consisting from 2 monomer units
To explain these measured data and for further understanding of the peculiarities of the PVDF copolymer molecular structure in different phase conformations we performed molecular modeling and simulations using HyperChem 7.52 [39] (as well as the new updated version 8.0) with the quantum approach from first principles, namely, density functional theory (DFT) methods, such as the many-parameter exchange-correlation functional method HCTH98, developed by Handy et al. [40] and several similar approaches (e.g., Becke-88 functional [41] with Lee–Yang–Parr (LYP) correlation functional [42], in combination with the fastest and most suitable PM3 semi-empirical method [39]. A number of the used DFT functionals both for exchange and correlation have been developed earlier by J.P. Perdew and his collaborators. The Perdew–Wang-91 exchange functional is similar to the Becke-88 functional, but with a somewhat different function [43]. We use it in some cases too for comparison of data. Although DFT is widely used in computational chemistry, the most popular density functional B3LYP has some serious shortcomings, which are being now analyzed and corrected [44]. On the other hand, semi-empirical methods, such as new PM6 methods, are being now developed very fast too [45]. Because of this, it is important for practice to make the most effective combinations of these different approaches.
a) |
b) |
c) |
d) |
e) |
f) |
g) |
h) |
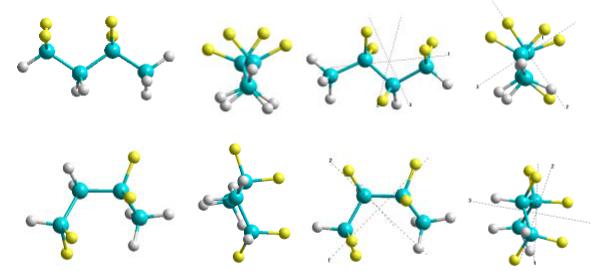
Fig. 4. Structural representation of the modelled polymer building blocks, containing two minimal VDF units (-CH2-CF2-) in the different phase conformations – Trans (T) (upper line) and Gauche (G) (lower line): a) and b) 2VDF-T in Y and Z planes; c) and d) 2(VDF-TrFE)-T in Y and Z planes; e) and f) 2VDF- G in Y and Z planes; g) and h) 2(VDF-TrFE)-G in Y and Z planes.
Firstly we constructed several minimal structural building blocks containing the main PVDF copolymer motive – CH2-CF2 – with TrFE variations and for different conformation phases – Trans (T) and Gauche (G) (fig. 4). The main parameters of these models computed by various methods are presented in table 1. The main obtained values (dipole moments, volume and polarization, E HOMO, E LUMO, Egap, as well as ionization potential IA and
t22
Mathematical Biology and Bioinformatics. 2011. V. 6. № 2. URL: http://www.matbio.org/2011/Bystrov2011(6_t14).pdf
COMPUTATIONAL STUDIES OF PVDF AND P(VDF-TRFE) NANOFILMS POLARIZATION DURING PHASE TRANSITION
computed electron affinity EA, corresponding to the measured χ, showed on Fig. 1) are close to calculated by other authors and used in various DFT approaches [32–37]. But most interesting are results connecting the energies of phase transformation and related energies of E LUMO (and EA), which are close to electron affinities.
Table 1. Computed parameters for the different structural conformations with 2 main VDF and VDF-TrFE units (e.i. P = 2 for polymers PVDF and P(VDF_TrFE))
|
Methods |
|
|
Parameters |
|
|
PVDF-T |
|
|
PVDF–G |
|
∆ETG = |
|
P(VDF- |
|
|
P(VDF- |
|
∆ETG = |
|
|
|
|
|
|
|
|
EG–ET, eV |
|
|
|
|
EG –ET, eV |
||||||
|
|
|
|
|
|
|
|
|
TrFE)-T |
|
|
TrFE)-G |
|
||||||
|
|
|
|
|
|
|
|
|
|
|
|
(kcal/mol) |
|
|
|
|
(kcal/mol) |
||
|
|
|
|
|
|
|
|
|
|
|
|
|
|
|
|
|
|
||
1 |
|
2 |
|
3 |
|
4 |
|
5 |
6 |
|
7 |
|
8 |
||||||
|
PM3 |
|
Etot, a.u. |
|
–85.602 |
|
–85.599 |
0.0964 |
|
–101.2096 |
|
–101.2108 |
–0.033 |
||||||
|
|
|
|
|
|
|
|
|
|
|
|
(2.622) |
|
|
|
|
|
|
(–0.76) |
|
|
|
|
E LUMO, eV |
1.4617 |
1.336 |
–0.125 |
0.806 |
0.717 |
|
–0.089 |
||||||||
|
|
|
|
E HOMO, eV |
|
–12.674 |
|
–12.848 |
|
|
–12.73 |
|
–12.93 |
|
|||||
|
|
|
|
Egap, eV |
14.136 |
14.184 |
|
13.54 |
|
13.64 |
|
|
|||||||
|
|
|
|
Dipole, D |
4.103 |
2.588 |
|
3.235 |
2.967 |
|
|
||||||||
|
|
|
|
Volume, A3 |
89.58 |
89.684 |
|
92.47 |
|
90.78 |
|
|
|||||||
|
|
|
|
Polarization, |
0.153 |
0.096 |
|
0.117 |
0.109 |
|
|
||||||||
|
|
|
|
C/m2 |
|
|
|
|
|
|
|
|
|
|
|
|
|
|
|
|
|
|
|
EA, eV |
1.0945 |
0.9737 |
–0.121 |
0.567 |
0.312 |
|
–0.26 |
||||||||
|
|
|
|
IA, eV |
12.500 |
12.677 |
|
12.18 |
12.97 |
|
|
||||||||
|
DFT 1 |
|
Etot, a.u. |
|
–555.23 |
|
–555.233 |
–0.077 |
|
–654.4227 |
|
–654.42 |
–0.057 |
||||||
|
(HCT |
|
|
|
|
|
|
|
|
|
(–1.77) |
|
|
|
|
|
|
(–1.32) |
|
|
|
E LUMO, eV |
1.5129 |
1.3576 |
–0.155 |
0.689 |
0.854 |
|
0.165 |
||||||||||
|
H98) |
|
|
||||||||||||||||
|
|
E HOMO, eV |
|
–7.066 |
|
–7.324 |
|
|
–7.053 |
|
–7.289 |
|
|||||||
|
|
|
|
|
|
|
|
|
|
||||||||||
|
|
|
|
Egap, eV |
8.579 |
8.681 |
|
7.742 |
8.143 |
|
|
||||||||
|
|
|
|
Dipole, D |
3.592 |
2.207 |
|
2.767 |
2.514 |
|
|
||||||||
|
|
|
|
Volume, A3 |
89.58 |
89.68 |
|
90.68 |
|
90.78 |
|
|
|||||||
|
|
|
|
Polarization, |
0.134 |
0.082 |
|
0.102 |
0.092 |
|
|
||||||||
|
|
|
|
C/m2 |
|
|
|
|
|
|
|
|
|
|
|
|
|
|
|
|
|
|
|
EA, eV |
3.993 |
3.896 |
–0.097 |
3.988 |
3.699 |
|
–0.289 |
||||||||
|
|
|
|
IA, eV |
10.16 |
10.435 |
|
9.816 |
10.381 |
|
|
||||||||
|
DFT 2 |
|
Etot, a.u. |
|
–555.27 |
|
–555.272 |
–0.081 |
|
–654.4903 |
|
–654.4923 |
–0.055 |
||||||
|
(Becke |
|
|
|
|
|
|
|
|
|
(–1.87) |
|
|
|
|
|
|
(–1.23) |
|
|
|
E LUMO, eV |
1.439 |
1.335 |
–0.105 |
0.811 |
|
0.976 |
|
0.1647 |
|||||||||
-88, |
|
|
|
|
|||||||||||||||
|
|
E HOMO, eV |
|
–6.829 |
|
–7.089 |
|
|
–6.81 |
|
–7.044 |
|
|||||||
|
LYP) |
|
|
|
|
|
|
|
|||||||||||
|
|
Egap, eV |
8.506 |
8.424 |
|
7.621 |
8.019 |
|
|
||||||||||
|
|
|
|
|
|
|
|||||||||||||
|
|
|
|
Dipole, D |
3.447 |
2.115 |
|
2.647 |
2.372 |
|
|
||||||||
|
|
|
|
Volume, A3 |
89.58 |
89.68 |
|
90.68 |
|
90.78 |
|
|
|||||||
|
|
|
|
Polarization, |
0.134 |
0.082 |
|
0.097 |
0.092 |
|
|
||||||||
|
|
|
|
C/m2 |
|
|
|
|
|
|
|
|
|
|
|
|
|
|
|
|
|
|
|
EA, eV |
3.993 |
3.896 |
–0.097 |
3.988 |
3.699 |
|
–0.289 |
||||||||
|
|
|
|
IA, eV |
10.16 |
10.44 |
|
9.816 |
10.38 |
|
|
||||||||
In our case we obtain that the values of the total energy advantage under the phase transition between G and T conformations ∆ETG = EG – ET are following (Table 1):
a) for PVDF it is ~ 1.8…1.9 kcal/mol (or ~ 0.08 eV) for both used DFT methods, in comparison with the value ~ 2.3 kcal/mol in [37]; b) for P(VDF-TrFE) it is ~ 1.3 kcal/mol (~ 0.056 eV) in comparison with ~ 1.46 kcal/mol and ~ 1.92 kcal/mol for two various conformers in [37]. These results prove the truth of the computational description of the direction of phase transitions from T to G in our cases. The PM3 is not as good for the case of pure 2VDF unit (∆ETG have the opposite sign), but it is appropriate for the 2(VTD-TrFE) case
t23
Mathematical Biology and Bioinformatics. 2011. V. 6. № 2. URL: http://www.matbio.org/2011/Bystrov2011(6_t14).pdf