

3.2 Elementary excitations: resonance peak and kink |
125 |
equations, this procedure is repeated until one reaches convergence. However, despite the fact that material–dependent predictions can be made (knowing only one quantity, σ(ω) or Im χ(ω)), this procedure cannot provide a microscopic explanation of both types of experimental data. This is the main advantage of our theory where the spin excitations follow from an electronic theory. The parameters used are only those of the original Hubbard Hamiltonian.
Another possible explanation for the resonance peak has been provided by Demler and coworkers [93], who claim, within the t–J model, that the resonance peak follows from a π–resonance in the particle–particle channel that couples to the dynamical spin correlation function within the framework of the SO(5) theory [94] only below Tc. However, Chubukov and coworkers [95] have argued against that explanation. They have demonstrated that the π–resonance always exceeds 2∆, twice the maximum of the d–wave gap, and might be observed only around 100 meV. Instead, a bound state of a particle and a hole, a spin exciton, seems to yield good agreement with experimental data. In our approach, we also consider a particle–hole excitation, via the spin susceptibility χ(q, ω), where in addition the superconducting gap is calculated self–consistently and doping–dependently. In other words, ∆(q, ω) does not enter as a parameter into our theory. We obtain also the correct spin spectrum for electron–doped cuprates, whereas this is not considered in the theories mentioned above (and also not in some earlier approaches [96, 97, 98]).
Finally, we would like to mention that Brinckmann and Lee [89, 99] and Li and coworkers [90, 100] studied the doping dependence of the resonance peak in hole–doped cuprates within a slave–boson approach with the t–J model, and Norman and coworkers [101] have connected their result to available ARPES data and find a consistent picture. But again, neither a connection to optical–conductivity data nor an electronic theory for electron–doped cuprates has been presented. In the future, we believe that a good test for those theories might be the sensitivity of the resonance peak to impurities of nonmagnetic or magnetic kind [102, 103, 104, 105]. Note that in the clean limit our theory is able to account for the most important properties, such as the peak position and the doping dependence of ωres/Tc.
3.2.2 The Spectral Density Observed by ARPES: Explanation of the Kink Feature
For understanding the high-Tc cuprates, their elementary excitations are of central significance. In particular, angular–resolved photoemission spectroscopy is a powerful tool for studying the observed elementary excitations A(k, ω) in high–Tc superconductors because the spectral density contains all information about self-energy e ects.
In general, in a photoemission experiment, incident photons excite electrons (or holes) above the vacuum level, where they can be collected and analyzed. A simplified spectrum of a single-band material would consist of
126 3 Results for High–Tc Cuprates: Doping Dependence
only a single peak in the intensity and some background. If the momentum of the corresponding quasiparticle is assumed to be
|k| = |
h¯2 |
|
1/2 |
(3.11) |
, |
||||
|
2meEkin |
|
|
|
where me denotes the (band mass) of the quasiparticle and Ekin its kinetic energy, one can obtain a relation between the binding energy of an electron Ebin and the energy of an incident photon Ephoton via Ebin = Ephoton −Ekin . Furthermore, if the angle Θ of the emitted electron or hole with respect to the Fermi surface is varied (ARPES), it is possible to analyze the dependence of Ebin on the momentum k , where
k = |k| cos(Θ) . |
(3.12) |
It has turned out that for the layered cuprates, Ebin versus k is su cient to determine the band structure and the elementary excitations in the whole Brillouin zone.
In a simple approximation, the peak obtained in the intensity for energies below the Fermi level is proportional to the local density of states, i.e.A(k, ω) [106]. Recently, owing to an improved angular resolution (which allows one to obtain the momentum distribution curve and energy distribution curve), data have become available which provide new insight into the momentum and frequency dependence of the self-energy Σ(k, ω). These data reveal a “kink” feature at hω¯ 50 ± 15 meV, which has been observed in hole–doped cuprates such as Bi2Sr2CaCu2O8, Pb–doped Bi2Sr2CuO6, YBa2Cu3O7, and La2−xSrxCuO4 [107, 108, 109, 110, 111]. Furthermore, it is interesting that the experiments also observe a change in the dispersion of the elementary excitations on going from the normal to the superconducting state [107, 108, 109]. In contrast, the electron–doped counterparts (e.g. Nd2−xCexCuO4) do not show a “kink” [112]. In hole–doped superconductors, experiments by Shen and coworkers [110, 111] have observed the kink feature in the nodal and (0, 0) → (π, 0) directions of the first Brillouin zone and the “kink” exists in both the normal and the superconducting state. On the other hand, Kaminski et al. [109] discussed only the break along the (0, 0) → (π, π) direction that occurs when one goes from the normal to the superconducting state. Therefore, they did not analyze the feature observed by the group mentioned previously [110, 111]. However, it is quite interesting that a closer inspection of the data of Kaminski et al. [109] for the normal state reveals the same changes of the Fermi velocity vF as noted by Shen and coworkers [110, 111]. Thus, there seems to exist a “new” energy scale in hole–doped cuprates. Shortly after its discovery, interpretations where given in terms of the presence of a strong electron–phonon interaction [111, 112], stripe formation [113], or coupling to a resonating mode [80, 109].
In this subsection we show that the kink in the spectral density can be naturally explained as arising from the interaction of the quasiparticles (holes)

3.2 Elementary excitations: resonance peak and kink |
127 |
with spin fluctuations. We present results for the spectral density A(k, ω) corresponding to the crossover from Im Σ(k, ω) ω to Im Σ(k, ω) ω2, for the feedback of superconductivity on the excitations, and for the superconducting order parameter ∆(k, ω). In agreement with recent experiments, we demonstrate that the kink feature in the nodal direction is present in both the normal and the superconducting state [108, 110, 111, 112]. Thus, we are able to explain recent ARPES experiments which study in detail the spectral density and, in particular, the energy dispersion ω(k) = (k) + Σ(k, ω). It is significant that the self–energy Σ(k, ω) resulting from the scattering of the quasiparticles by spin fluctuations can explain the main features observed. These results relate also to the inelastic neutron scattering and tunneling experiments discussed in the previous section, and shed important light on the essential ingredients that a theory of the elementary excitations in the cuprates must contain. We also analyze the feedback e ects due to superconductivity on the elementary excitations and find fair agreement with [109].
Results for the Spectral Density
In Fig. 3.17, we present results for the frequency and momentum dependence of the spectral density given by (2.122) in the normal state along the (0, 0) → (π, 0) direction, calculated using the canonical parameters U = 4t, and t = 250 meV.9 The changes in the k dependence of the peak in A(k, ω) reflect the characteristic features in the self–energy Σ(k, ω) or in the velocity vk of the quasiparticles. The kink occurs at energies of about hω¯ ≈ 65 ± 15 meV for optimal doping (x = 0.15), and Tc ≈ 65 K. We also find that the kink feature is present in nearly all directions in the BZ (ω ≈ ωsf + vF (φ) · k, k = k(k, φ)) and, in particular, along the diagonal (0, 0) → (π, π) direction as shown in the inset of Fig. 3.17. We find that the kink is more pronounced in the (0, 0) → (π, 0) direction. This is in agreement with ARPES experiments, see for example Fig. 1.6. Moreover, we see from our calculations that this feature has only a weak temperature dependence over a wide temperature range. It changes only at very small temperatures, as we shall describe later.
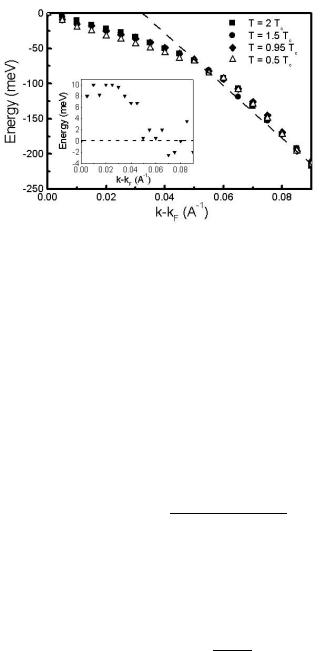
Next, we come to the discussion of the e ective dispersion relation (see (2.123)) of the quasiparticles due to strong correlation e ects. In Fig. 3.18, we show the positions of the peaks along (0, 0) → (π, 0) shown in Fig. 3.17 as a function of (k − kF ) for di erent temperatures. We obtain only small changes due to superconductivity which almost coincide with the position
− ≈ ˚−1
of the kink. Remarkably, the deviation at k kF 0.05 A is due to the frequency dependence of the self–energy and reflects the transition from Fermi liquid to non–Fermi liquid behavior along the path (0, 0) → (π, 0) in
9Our calculations were performed in the “clean-limit” and thus do not consider the additional scattering of the carriers by impurities. Also, the intrinsic width of the spectral function due to scattering by the antiferromagnetic spin fluctuations provides a small uncertainty.

128 3
Fig. 3.17. Calculated self–energy e ects in the spectral density (see (2.122)) of the quasiparticles in hole-doped superconductors in the normal state at T = 100 K along the (0, 0) → (π, 0) direction. The dashed line at ω = 0 denotes the unrenormalized chemical potential. In the inset, the spectral density along the (0, 0) → (π, π) direction is shown. In both cases a kink occurs at energies of about ¯hω ≈ 65 ± 15 meV, since the velocity of the quasiparticles changes.The results are in good agreement with experiments (see, for example Fig. 3 in [110] or Fig. 4b in [111]). Note that the width of the spectral density peak for (0, 0) → (π, 0) is twice the width for (0, 0) → (π, π).
the BZ for both the normal and the superconducting state. In the inset, we show results for the di erence between the peak positions for the normal and the superconducting state along the (0, 0) → (π, 0) direction in order to see the feedback of superconductivity. Note that this di erence disappears at k−kF ≈ 0.05, corresponding to approximately 65 meV. We obtain changes of about 10 meV, while Kaminski et al., [109] observe along the (0, 0) → (π, π) direction a larger di erence of about 20 meV. This might be due to the antibonding bands of Bi2212. This can be expected from an inspection of (3.8) since the feedback e ect of superconductivity on χ is larger for Q ≈ (π, π). In order to understand the feedback of superconductivity and the crossover from non–Fermi liquid to Fermi liquid behavior, we shall analyze the frequency and temperature dependence of the self–energy more in detail.
How can one understand the kink feature in a simple way? At first glance the occurrence of a kink in the nodal direction seems to be surprising, since the main interaction of the carriers with spin fluctuations occurs at the hot spots. Note that the kink feature is present along the diagonal of the BZ close to the cold spots. However, slightly away from the Fermi level but still close to it (along (0, 0) → (π, π)), the quasiparticles couple strongly to spin fluctuations. Most importantly, as can be seen from Fig. 3.19, the largest scattering will occur at values of k − kF = Q and ω = ωsf . In Appendix B we show that
3.2 Elementary excitations: resonance peak and kink |
129 |
Fig. 3.18. Positions of the peaks in the spectral density A(k, ω) versus k - kF (energy dispersion, see (2.123)) along the (0, 0) → (π, 0) direction of the BZ calculated within the FLEX approximation. These results should be compared with the positions of the peaks derived from the momentum distribution curve for a hole–doped superconductor measured experimentally. The curves show a kink at energies of about ¯hω ≈ 65 ± 15 meV. The dashed line is a guide to the eye. We find small changes due to superconductivity which almost coincide with the kink position. Inset: change in the peak position in A(k, ω) in the superconducting state (T = 0.5Tc ). The results are in fair agreement with ARPES data [109].
|
|
|
|
|
|
|
|
|
|
|
|
|
|
|
|
|
|
||||||
Σ(k, iωn) = −T 2 |
|
|
|
|
τ˜0G(k − k , iωn − iνm)˜τ0U 2 |
|
|
||||||||||||||||
|
|
|
|
|
|
|
ωm,νm k ,q |
|
|
|
|
|
|
|
|
|
|
||||||
1 |
Tr [˜τ0G(k + q, iωm + iνm)˜τ0G(q, iωm)] . |
(3.13) |
|||||||||||||||||||||
× |
|
||||||||||||||||||||||
2 |
|||||||||||||||||||||||
Approximating the Green’s function, |
|
|
|
|
|
|
|
|
|
|
|||||||||||||
G(k, iω |
) |
≈ |
G (k, iω |
|
) = |
iωnτ˜0 + kτ˜3 − φkτ˜1 |
, |
(3.14) |
|||||||||||||||
n |
|
|
|
0 |
|
|
|
|
m |
|
|
(iωn)2 − Ek2 |
|
|
|
|
|||||||
one obtains the following, after some algebra using the fact that E2 |
= 2 |
+φ2 , |
|||||||||||||||||||||
on the real axis: |
|
|
|
|
|
|
|
|
|
|
|
|
|
|
|
|
|
|
|
k |
k |
k |
|
|
|
|
|
|
|
|
|
|
|
|
|
|
|
|
|
|
|
|
|
|
|
||
Σ(k, ω) |
≈ − |
U 2 |
|
|
∞ dω ImχRP A(k − k , ω ) |
|
|
|
|||||||||||||||
|
|
|
|
|
|
|
|
|
|
|
|
|
|
|
|
|
|||||||
|
|
|
4 |
|
k |
|
|
0 |
|
ω |
− |
ω |
− |
Ek |
|
|
|
|
|||||
|
|
|
|
|
|
|
|
|
|
|
|
|
|
|
|
|
|
|
|||||
|
|
|
× |
|
|
|
|
|
|
− |
|
|
|
|
|
|
|
|
|||||
|
|
|
|
|
|
|
2T |
2T |
|
|
|
|
|||||||||||
|
|
|
|
|
|
coth |
|
|
ω |
|
tanh |
ω |
− |
ω |
|
. |
|
(3.15) |
|||||
|
|
|
|
|
|
|
|
|
|
|
|
|
|
|
|
||||||||
The imaginary part of the spin susceptibility is approximately given by the Ornstein–Zernicke expression, which has a peak structure at the wave vector q and the frequency ω = ωsf . Furthermore, the self–energy is mainly
130 3 Results for High–Tc Cuprates: Doping Dependence
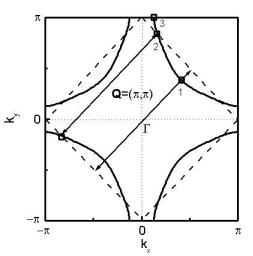
Fig. 3.19. Illustration of the anisotropy of the elementary excitations using the calculated Fermi surface for hole–doped cuprates in the first Brillouin zone for a single CuO2 layer. The anisotropy can be characterized by three di erent points on the Fermi surface. Point number 1 (called the nodal point or cold spot) is related to the diagonal part of the BZ and point number 3 (called the antinodal point) is close to (0, π). The dashed line denotes the magnetic BZ, which crosses the electronic Fermi surface exactly at the “hot spots” (labeled 2). The antiferromagnetic wave vector Q connects the two pieces of the Fermi surface via scattering by spin fluctuations mainly at the hot spots. At the (0, π) points and along the diagonals the wave vector Q connects quasiparticle states below the Fermi level only. Note that the characteristic anisotropic behavior of the elementary excitations may help one to distinguish the resultant kink structure from any structure that might be caused by electron–phonon coupling (see Appendix C).
frequency-dependent, while the bare dispersion of the carriers is not. Even in the normal state, the self–energy Σ(k, ω) has a maximum, reflecting a corresponding maximum of Im χ at q ≈ Q and ω ≈ ωsf . The position of the kink follows from the pole of the denominator of (3.15). This leads to the “kink condition”
ωkink ≈ Ek−Q + ωsf (x) . |
(3.16) |
Note that this gives an estimate of the position of the kink and explains the behavior of the spectral density A(k, ω) in the nodal direction.
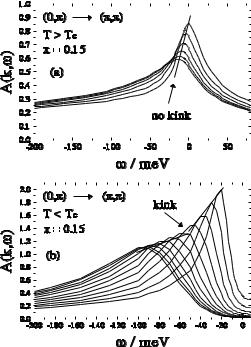
Next, we focus on an important antinodal direction that has been measured by Dessau and coworkers [114]. Interestingly, these researchers find a kink only below Tc. In Fig. 3.20a, we show our results for the spectral density A(k, ω) along the path (π, 0) → (π, π), i.e. the antinodal direction of the first BZ, in the normal state. Note that the spectral density at the (0, π) point is broader than at the antinodal point owing to stronger coupling to spin excitations peaked at q = Q = (π, π), as discussed in the caption of Fig. 3.19.
3.2 Elementary excitations: resonance peak and kink |
131 |
||||
|
|
|
|
|
|
|
|
|
|
|
|
|
|
|
|
|
|
|
|
|
|
|
|
|
|
|
|
|
|
|
|
|
|
|
|
|
|
|
|
|
|
|
|
|
|
|
|
Fig. 3.20. Calculated spectral density A(k, ω) along the antinodal (π, 0) → (π, π) direction in the first BZ as a function of frequency in the normal (a) and the superconducting (b) state. Owing to the flat band close to the Fermi level, the spectral density shows no kink structure in the normal state. Below Tc, the superconducting gap φ(ω) opens, yielding a kink structure in the spectral density that occurs at energies ωkink ≈ 50 ± 10 meV for optimal doping.
Clearly, no kink is present. The absence of a kink structure can be explained by the flat structure of the CuO2 plane around the M point (see Fig. 2.1). Simply speaking, for a flat band the frequency dependence of Σ in (2.123) does not play a significant role, and therefore no change in the velocity and no kink structure are present.
What happens in the superconducting state? Below Tc, the superconducting gap φ(k, ω) opens rapidly with decreasing temperature T and becomes maximal in momentum space around the M point, reflecting the momentum dependence of the e ective pairing interaction (see (2.28)). In addition, owing to the frequency dependence of the gap, the flat band around M disappears. In Fig. 3.20b we show results for A(k, ω) at a temperature T = 0.5Tc where the superconducting gap has opened. A kink structure around ωkink ≈ 50±10 meV is present, reflecting the magnitude of φ. Hence, in the (π, 0) → (π, π) direction, this kink feature is present only below Tc and is connected to the feedback e ect of φ on the elementary excitations. This is similar to the
132 3 Results for High–Tc Cuprates: Doping Dependence
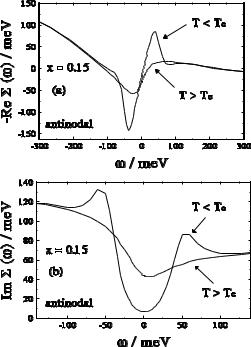
Fig. 3.21. (a) Calculated frequency dependence of the self-energy Re Σ(ka, ω) at the antinodal point ka of the first BZ in the normal state (solid curve) and superconducting state (dashed curve). Owing to the feedback e ect of the superconducting gap φ(ω), a peak and a dip occur for ω > 0 (ω < 0), respectively, which roughly define the position of the kink structure. (b) The corresponding imaginary part at the antinodal point Im Σ(k = ka , ω). Again, owing to the feedback e ect of φ(ω), a maximum occurs below Tc. Note that Re Σ is not fully antisymmetric and Im Σ is not fully symmetric with respect to ω at the optimum doping x = 0.15.
feedback e ect that yields the resonance peak seen in INS. Note that the superconducting gap φ(k, ω) is calculated self–consistently in our theory and reflects the underlying spin fluctuations which dominate the pairing potential Vef f . Therefore, the occurrence of a kink structure only below Tc in the antinodal direction is a direct fingerprint of the spin excitation spectrum. Furthermore, as we have discussed above, Im χ(Q, ω) in (3.15) is peaked at the resonance frequency ωres (roughly ωsf +∆). Therefore, the kink condition is given by
ωkink ≈ Ek−Q + ωres(x) . |
(3.17) |
In Fig. 3.21a, the frequency dependence of Re Σ(ka, ω) in the normal and superconducting states at the antinodal point k = ka is shown. Owing to the occurrence of the resonance feature in Im χ(Q, ω) and the related feedback of the superconducting gap φ(ω), Re Σ shows a pronounced structure below
3.2 Elementary excitations: resonance peak and kink |
133 |
Tc at energies of about ωres + ∆0. Also the corresponding imaginary part Im Σ(k = ka, ω) shows a peak below Tc (see Fig. 3.21b). This pronounced behavior is responsible for the formation of a kink along the (π, 0) → (π, π) direction in the BZ.
Therefore, while kink features are present along the (0, 0) → (π, π) and (π, 0) → (π, π) directions in the superconducting state of hole-doped cuprates, their nature is qualitatively di erent. Along the nodal direction the superconducting gap is zero (for ω = 0) and thus the feedback e ect of superconductivity on the elementary and spin excitations is small. Therefore, ωsf is the main factor that determines the kink feature. On the other hand, along the antinodal direction, the gap is maximal and leads to a strong feedback of superconductivity on χ. Thus, in the superconducting state, ωres and ∆0 yield a kink structure along the (π, 0) → (π, π) direction that is not present in the normal state.
The di erent reasons for the kink structures in hole-doped cuprates along di erent directions in the first BZ will also be reflected in their doping dependence. The results that we have shown so far were for the optimal doping concentration x = 0.15. This corresponds to a band filling of n = 0.85. Note that the superconducting transition temperature Tc behaves di erently in the
overdoped (OD) and underdoped (UD) regimes: |
|
|
Tc ∆(T → 0) , |
OD-regime |
, |
Tc ns(T → 0) , |
UD-regime |
, |
where ns is the superfluid density calculated self-consistently from the generalized Eliashberg equations.
In the antinodal (0, π) → (π, π) direction, the kink is present only below Tc owing to the feedback of φ(ω). In the OD case the gap φ(ω) decreases, reflecting a mean–field–like behavior. Thus, the energy where the kink occurs must decrease with overdoping:
ωkink (x) ∆0(x) . |
(3.18) |
This behavior is indeed observed by Dessau and coworkers [114]. Note that the above argument remains true in the strongly OD case, where no resonance peak in Im χ(Q, ω) occurs, because the feedback e ect of φ(ω) should always be present.
Regarding the kink along the nodal (0, 0) → (π, π) direction, we note the following: ωsf increases with increasing doping from underdoped to overdoped cuprates. Since ωsf determines the kink position along the (0, 0) → (π, π) direction, we expect that
ωkink (x) ωsf (x) . |
(3.19) |
This is in qualitative agreement with experimental data [129] (for the underdoped regime and for optimally doped superconductors). On the other
134 3 Results for High–Tc Cuprates: Doping Dependence
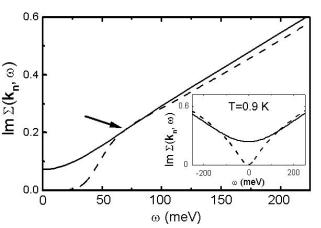
Fig. 3.22. Calculated frequency dependence of the quasiparticle self–energy at the node Σ(kn, ω), kn = (0.4, 0.4)π. The solid curves correspond to the normal state at T = 2Tc, whereas the dashed curves refer to the superconducting state at T = 0.5Tc . At k = kn, where the superconducting gap vanishes, one clearly sees approximately at ¯hω = 65 meV a crossover from Fermi liquid behavior (Σ ω2) to a non–Fermi liquid behavior (Σ ω) for low–energy frequencies as a function of temperature. We show in the inset the behavior of Σ(kn, ω) calculated at very low temperature T = 0.003t 0.9K (dashed line).
hand, the spectral weight of Im χ(Q, ω) decreases drastically with overdoping. Therefore, the coupling of the quasiparticles to spin fluctuations becomes much weaker in the OD case. These two competing e ects seem to be responsible for the nonmonotonic weak doping dependence of the kink position in the nodal direction [114].
It is remarkable that for electron–doped superconductors with a di erent dispersion k [115], in particular with a flat band lying 300 meV below F at (π, 0), we obtain no kink feature up to frequencies of about 100 meV. This is also in agreement with experiment [112]. The reason behind this is that Im χ(q, ω) has a peak at larger frequencies which is much less pronounced than for hole–doped cuprates [116].
Results for the One–Particle Self–Energy: Fermi Liquid Versus Non–Fermi liquid behavior
There is a broad discussion about whether or not layered cuprate superconductors behave like conventional Fermi liquids. Early experiments (for a review, see [88]) revealed non–Fermi liquid properties, in particular a linear resistivity ρ(T ) for optimal doping, poorly defined quasiparticle peaks above the superconducting transition temperature Tc seen in ARPES [117], and a strong temperature dependence of the uniform spin susceptibility observed by NMR [118]. The phenomenological concepts of a marginal–Fermi

3.2 Elementary excitations: resonance peak and kink |
135 |
liquid (MFL) and a nested–Fermi liquid (NFL) have been introduced in order to explain the deviations in the normal state from Fermi liquid theory [119, 120]. Our results shed more light on this question. In agreement with the picture of Ruvalds and coworkers, we obtain the ω and T dependence of the self–energy, which is mainly due to scattering of the quasiparticles by spin fluctuations, this is strongest for a nested Fermi topology. This also provides a microscopic justification for the MFL approach10. Thus, for optimal doping (x = 0.15), the microscopic FLEX approximation includes the phenomenological concepts of both the NFL and the MFL [35].
In order to investigate the e ect of the self–energy Σ(k, ω) on the dispersion ω(k, T ), we show in Fig. 3.22 the results of our calculations of Im Σ(kn, ω) for a wave vector along the node line of the superconducting order parameter in the first BZ. The transition from Σ(k, ω) ω2 to Σ(k, ω) ω for low–lying frequencies is shown for various temperatures. Note that the deviation from Landau’s theory (see solid curve in Fig. 3.22), Im Σ ω, results from the strong scattering of the quasiparticles by the spin fluctuations in our picture and is expected to disappear at temperatures T → 0, see inset of Fig. 3.22. In particular, the changes in the velocity of the quasiparticles with frequency are determined in energy distribution curves (EDC) by vF = vF /(1 + dΣk (ω)/dω). At frequencies around 65 meV, Re Σk (ω) shows a flattening, as can be seen via a Kramers–Kronig analysis of Im Σ. Therefore, at this frequency, the e ect of the scattering by spin fluctuations almost disappears. Thus, we find Fermi liquid behavior. In our microscopic theory we also recover Fermi liquid behavior for T ω ωsf . Here, ωsf is the characteristic spin fluctuation energy measured in INS (roughly the peak position of Im χ(Q, ω) [116]) and is typically around 25 meV for hole–doped superconductors [121]. We have shown previously that our ωsf gives a good description of INS data [76]. On the other hand, for T < Tc, the scattering is also strongly reduced, owing not only to ω < ωsf but also to a feedback e ect of superconductivity.
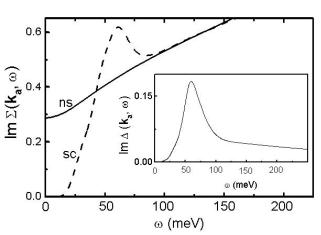
In Fig. 3.23, we demonstrate the feedback of superconductivity on Σ(k, ω). We expect that it is strongest for k ≈ (π, 0.1π), where the gap ∆(ω) is maximal. One can see that the superconducting properties demonstrated, ∆(k, ω) and in particular in Im ∆(k, ω), are the main factor that induces changes in the self–energy. For a comparison with experiment, we also present our results for the superconducting gap. Note that this behavior of Σ(k, ω) and ∆(k, ω) is also related to INS and optical–conductivity experiments. In particular, the peak position of Im Σ(ka, ω) is approximately at 3∆0 − ωsf ≈ ωres + ∆0 (ωres denotes the resonant frequency observed in INS), according to our previous analysis [76]. This is in a good agreement with results obtained within
10Note that although the results of our microscopic calculations agree with MFL theory, we have not proved the existence of a quantum critical point suggested there.
136 3 Results for High–Tc Cuprates: Doping Dependence
Fig. 3.23. Calculated frequency dependence of the quasiparticle self–energy Σ(ka, ω) at the wave vector k = ka ≈ (1, 0.1)π (antinode). The solid curves correspond to the normal state at T = 2Tc , whereas the dashed curves refers to the superconducting state at T = 0.5Tc . This shows ka the feedback e ect of superconductivity on the self–energy at the wave vector ka . Inset: superconducting gap function ∆(ω) at wave vector k = ka versus frequency. Since the behavior of ∆ and Σ is controlled by Im χ(q, ω), we are able to connect these results also to the resonance peak observed by INS in cuprates [76].
the framework of the spin–fermion model [122]. It is an important result that ∆(ω) also agrees well with tunneling experiments [76].
To summarize this subsection, we have calculated the pronounced momentum and frequency dependence of the quasiparticle self–energy Σ in hole-doped high-Tc cuprates and find that this results in a kink structure in the dispersion ω(k), which agrees well with recent ARPES experiments. An important result for describing the physics in the cuprates is that the origin of this is the coupling of the quasiparticles to the spin fluctuations. The reason for the kink structure is the strong coupling and inelastic scattering of holes to and by spin fluctuations. At the Fermi level, this is reflected in a change of the ω dependence of the self–energy Σ from non–Fermi liquid to Fermi liquid behavior. Owing to a di erent spectrum Im χ(q, ω) of the spin fluctuations in electron–doped cuprates, we do not find a kink in the corresponding spectral density. Furthermore, the feedback e ects due to superconductivity on the elementary excitations clearly reflect the symmetry of the superconducting order parameter, and the calculated density of states
N (ω) ≡ A(ω) = k A(kω) compares well with SIN tunneling data. However, owing to spatial averaging such experiments do not exhibit a kink structure.
3.3 Electronic Raman Scattering in Hole–Doped Cuprates |
137 |
3.3 Electronic Raman Scattering in Hole–Doped
Cuprates
The use of optical techniques to investigate low–energy excitations in high–Tc superconductors has traditionally been of great importance, not only allowing the study of the superconducting gap directly, but also providing detailed information on the unusual normal and superconducting states in these compounds. One optical probe is polarization–dependent inelastic light (Raman) scattering. Using Raman spectroscopy, not only electronic or magnetic, but also phononic excitations can be investigated. In this regard, the renormalization of phonons due to interaction with the pair–breaking peak is of particular interest. A well–known example is the B1g Raman–active phonon at ≈ 340 cm−1 in RBa2Cu3O7−δ , where R denotes a rare-earth atom such as yttrium [123, 124]. This phonon corresponds to an out–of–plane vibration of the planar oxygen (e.g. [125]). Owing to the coupling of this mode to the low– energy electronic excitations, it has a Fano–type lineshape. The change of the lineshape at low temperatures was identified from the superconducting redistribution of the electronic spectrum and was investigated in detail in [126]. However, in this section, we shall focus on the electronic part of the Raman intensity after all phonons have been subtracted. The remaining signal due purely to electronic Raman scattering (and its polarization dependence) provides important information about the quasiparticle scattering rate τ −1(ω) in the normal state and the anisotropy of the gap function ∆(k, ω) in the superconducting state.
Polarization–dependent Raman scattering data below Tc from optimally doped Bi2Sr2CaCu2O8+δ (Bi2212) for the polarization channels of A1g , B1g , and B2g symmetry have been analyzed by weak–coupling BCS theory and found to be in agreement with a dx2−y2 pairing symmetry [127]. In the weak– coupling limit, it has been shown that good agreement with the Ax x and B1g Raman data from YBa2Cu3O7 (YBCO) can be obtained if vertex corrections due to the pairing interaction and short–range Hubbard–type interactions between the electrons are taken into account [128]. The relationship between the normal-state anomalous Raman spectrum and the optical conductivity of high-Tc superconductors has been discussed in the context of marginal Fermi liquid theory, where it has been noted that a linear variation of the quasiparticle damping with frequency is responsible for these phenomena [119]. This is consistent with the results of the nested–Fermi liquid model, which describes the qualitative features of the optical conductivity and Raman response in the normal state correctly and can be generalized in a simple way to the superconducting state [129]. Strong–coupling calculations with anisotropic Eliashberg equations have been carried out by using a phenomenological anisotropic spin fluctuation interaction in a nearly–antiferromagnetic Fermi liquid theory [130]. These theories are capable of explaining many features of the observed Raman spectra in La2−xSrxCuO4 [131], Bi2212 [132], and YBCO [133]. In the last of these works, it is shown that the Raman response is extremely