

Dressel.Gruner.Electrodynamics of Solids.2003
.pdf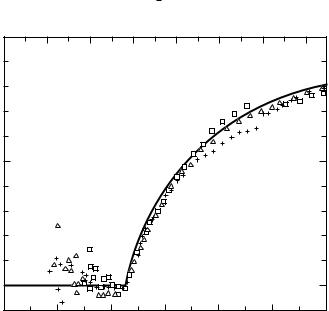
14.1 Superconductors |
379 |
Energy hω (meV)
|
1.0 0 |
1 |
2 |
3 |
4 |
5 |
6 |
7 |
|
|
Pb |
|
|
|
|
|
|
n |
|
|
|
|
|
|
|
|
/ σ |
|
|
|
|
|
|
|
|
1 |
|
|
|
|
|
|
|
|
σ |
0.5 |
|
|
|
|
|
|
|
Conductivity |
|
|
|
|
|
|
|
|
|
|
|
|
|
|
|
|
|
|
0.0 |
|
|
|
|
|
|
|
|
0 |
10 |
20 |
|
30 |
40 |
50 |
60 |
|
|
|
Frequency ν (cm−1) |
|
|
|||
Fig. 14.4. Frequency dependence of the conductivity σ1(ω) in different lead films, normalized to the normal state conductivity σn. The results are obtained from reflection and transmission measurements at T = 2 K. The full line is calculated using the Mattis–Bardeen theory with a gap of 2 /h¯ = 22.5 cm−1 (after [Pal68]).
obtained by time domain spectroscopy (cf. Section 10.2), as shown in Fig. 10.5. The data are fitted by the Mattis–Bardeen equations (7.4.20) to extract the temperature dependence of the superconducting gap.
As discussed in Section 7.4, various length scales and their relative magnitude determine the electrodynamic properties of the superconducting state. Let us first estimate these length scales; this can be done for each material in question by using the optical properties of the normal state together with the Fermi velocity and the superconducting gap. For the plasma frequency of a typical metal of h¯ ωp = 10 eV, the London penetration depth λL = c/ωp is of the order of 100 A˚ at zero temperature. The second length scale, the correlation length ξ0 = h¯ vF/π , is at T = 0 for a typical Fermi velocity of 5 × 107 cm s−1 and for a superconducting energy gap of 1 meV, about 1000 A˚ . Finally the mean free path = vFτ , where the relaxation time τ (the parameter which depends on the purity of the specimen, and as such can be easily varied for a metal) is assumed to be the same in both the normal and the superconducting states, is approximately 500 A˚ with the previous
14.1 Superconductors |
381 |
The most obvious parameter, and therefore also the quantity experiments have the easiest access to, is the mean free path and correlation length dependent penetration depth which we call λ – in contrast to the London penetration depth λL, which is measured only in the clean limit and for ξ0 λL and also for ξ0 . Let us start by considering the effects related to the finite mean free path . If this length scale is smaller than the coherence length ξ0 (i.e. the spatial extension of the Cooper pairs), the effectiveness of pair formation is reduced, and thus the penetration depth is increased since λ is inversely related to the number of condensed pairs. In Section 7.4.1 we derived an appropriate expression based on spectral weight arguments (the Tinkham–Ferrell sum rule) in the limit when is short; Eq. (7.4.8) can be extended to a long mean free path (for which we should recover the London penetration depth) by the interpolation expression (7.4.18).
The above applies when ξ0 > λ. As discussed in Section 7.4, the penetration depth plays a similar role to the skin depth in the case of normal metals, and – through the ineffectiveness concept – the coherence length takes the role of the mean free path. Therefore the inequality above corresponds to what is called the normal skin effect in metals. In the opposite, i.e. the anomalous, limit Eq. (7.4.16) applies, in full analogy to the expression of the skin depth in metals. Again we can postulate an interpolation of the form
λeff = λL |
1 + B λL |
1/3 |
||
, |
||||
|
|
ξ0 |
|
|
where the constant B is of the order of unity. The validity of these considerations can be explored by measuring the penetration depth in various materials of different purity. In Table 14.1 we have collected the values of λ obtained for some typical metals, together with the parameters, such as the London penetration depth, the coherence length, and the mean free path, all estimated using the procedures discussed before. The values calculated for the penetration depth λ are in excellent agreement with the measured data, both for the corrections due to short mean free path (7.4.18) and large coherence length (7.4.16).
The experimental results, displayed in Figs 14.4 and 14.5 have been obtained on lead and niobium films with thicknesses less than the penetration depth λL and less than the coherence length ξ0. In this case the electric field within the film is independent of position and thus non-local effects can be neglected. These effects, however, become important for experiments on bulk samples; and here the full q dependence of the electromagnetic response has to be included. This was done by using expressions for the q dependent surface impedance as derived by Reuter and Sondheimer [Reu48] and by Dingle [Din53], and the corresponding calculations for σ1/σn were performed by Miller [Mil60]. Of course these issues are also related to the behavior of the superconducting state in the presence of a magnetic field;

382 |
14 Broken symmetry states of metals |
Table 14.1. Values of the actual penetration depth λ as calculated and as measured, the London penetration depth λL, the mean free path , the coherence length ξ0, the transition temperature Tc, and the gap ratio 2 / kBTc of
several metals. Data taken from [Bar61, Kle94, Tur91].
Material |
Tc |
2 / kBTc |
λL |
ξ0 |
|
λ (exp.) |
λ (theory) |
|
(K) |
|
˚ |
˚ |
˚ |
˚ |
˚ |
|
|
(A) |
(A) |
(A) |
(A) |
(A) |
|
Al |
1.18 |
3.4 |
157 |
16 000 |
|
500 |
530 |
Sn |
3.7 |
3.5 |
355 |
2 300 |
|
510 |
560 |
Pb |
7.2 |
4.1 |
370 |
830 |
2000 |
390 |
480 |
Nb |
9.0 |
3.7 |
330 |
380 |
200 |
440 |
450 |
|
|
|
|
|
|
|
|
|
|
|
|
|
|
|
|
studies under such conditions confirm the fundamental differences between type I (λL < ξ0) and type II (λL > ξ0) superconductors.
14.1.2 Non-BCS superconductors
By now a wide range of superconductors have been discovered where the superconducting state cannot be described by the simplest BCS calculations, i.e. the solution which relies on two assumptions: weak electron–phonon coupling and s wave symmetry of the condensate wavefunction.
Materials with relatively high transition temperatures clearly fall into the regime of what is called strong coupling; for a small coupling constant the transition temperature is (exponentially) small. In other superconductors, which are mainly based on CuO and go by the name high temperature superconductors, the order parameter is dominantly d wave, while in the so-called heavy fermion superconductors, the unusual normal state properties and also the coexistence or progressive development of several superconducting phases signal the possibility of novel superconducting states. There are indications that electron–phonon coupling is not solely responsible for superconductivity.
In metals where the electron–phonon interactions are not particularly weak, the BCS theory has to be modified and details of the electron–phonon interaction have to be included. The appropriate theory has been worked out by Eliashberg [Eli60] and is reviewed among others in [Sca69]; strong electron–phonon interaction results in a renormalized (and complex) gap. The real part corresponds to the mass enhancement
m |
(14.1.3) |
m = 1 + λP , |

14.1 Superconductors |
383 |
with the value given by |
|
|
|
|
λP = 2 0 |
∞ α2(ωP)F(ωP) |
dωP ; |
||
|
ωP |
|
||
i.e. Eq. (12.2.12), which we encountered before when the electron–phonon interaction in metals was discussed. There are several consequences: first, the magnitude of the gap is enhanced over what is predicted by the BCS theory 2 / kBTc = 3.53; approximate expressions which relate the gap to the enhancement [Mit84] are in good agreement with the experimental findings. Second, the selfconsistent gap equation is modified, and consequently the temperature dependence of the various quantities, such as the penetration depth, surface impedance, and the coherence effects are also modified; this was experimentally verified. Also seen is a modified frequency dependence of the absorption which can be related to the phonon spectrum through the Holstein process discussed in Section 12.2.2. Because of the existence of a single-particle gap and the particular behavior of the density of states near to the gap, the Holstein process of phonon emission is modified. Instead of Eq. (12.2.15), we find that in the superconducting state the absorptivity is
A(ω) |
1 |
|
ω |
− |
2 |
dωP (ω − ωP) 1 − |
|
4 |
2 |
α2 F(ωP) . (14.1.4) |
ω |
0 |
|
|
(hω |
|
hωP)2 |
||||
|
|
|
|
|
¯ |
− ¯ |
|
|||
This result can be arrived at by following the same procedure as for the normal state [All71].
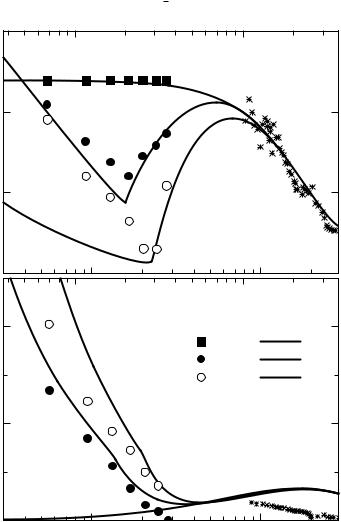
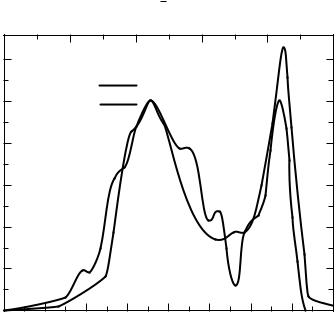
The frequency dependent absorption can be measured both above and below Tc and thus the difference between the absorption in the normal state and superconducting state can be evaluated with high precision. The advantage then is that many of the unknown parameters drop out by such normalization, and consequently the above expression can be analyzed in detail. In addition, the same information is provided by tunneling experiments [McM69] conducted in the superconducting state. The factors α2 F(ω) as evaluated from tunneling and from optical measurements of lead are displayed in Fig. 14.6. The two are in good agreement and give a reliable description of this so-called Eliashberg factor. This factor can be inserted into the relevant expressions of the transition temperature
|
θD |
|
|
1.04(1 |
+ |
λP) |
|
|
||
Tc ≈ |
|
exp |
λP |
|
µ (1 |
0.62λP) |
(14.1.5) |
|||
1.45 |
− |
+ |
||||||||
|
|
|
|
|
|
|
|
|
||
to establish (if it agrees with experiment) the mechanism of Cooper pair formation [McM68]. Here θD is the Debye temperature and µ refers to the effective screened Coulomb interaction. Needless to say, the procedure works equally well for other types of bosonic fluctuations which may mediate superconducting pairing; optical experiments can potentially be extremely useful in clarifying such coupling mechanisms.

14.1 Superconductors |
385 |
states. Thus in the clean limit we obtain
|
c |
= |
m c2 |
|
1/2 |
|
|
λL = |
, |
(14.1.6) |
|||||
ωp |
4π N e2 |
and the penetration depth is significantly enhanced by electron–electron interactions. This enhancement can also be derived using a two-component Fermi-liquid theory [Var86]. The above equation – with m values evaluated from the thermodynamic or electrodynamic response of the normal state; see Fig. 12.14 – accounts well for the extremely large penetration depth values found [Hef96] in various heavy fermion superconductors. The above analysis assumes that the materials are in the clean limit – a by no means obvious assumption. If this is not the case, the Tinkham–Ferrell sum rule arguments (7.4.6) should be used with the frequency dependent mass and relaxation rate included.
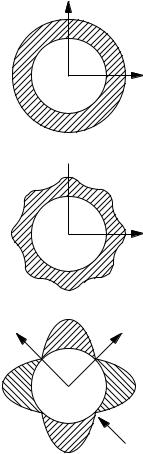
Mechanisms different from the well known phonon mediated superconductivity are also possible, and they may lead to pairing symmetry different from the s wave symmetry we have considered before. Higher momentum pairing implies momentum dependent gaps (in analogy to the atomic wavefunctions corresponding to different quantum numbers) with zeros expected for certain k values in momentum space and a possible change in phase. If this occurs, the temperature dependencies of various quantities are modified, which can be tested by experiment; also the influence of impurities is modified, for example. This scenario happens for the so-called high temperature superconductors, such as YBa2Cu3O7−δ (here δ refers to the varying oxygen content which corresponds to a doping of charge carriers) where the pairing has d wave symmetry. The momentum dependence of the gap is drawn in Fig. 14.7, together with the momentum dependence of the superconducting gap as expected for isotropic and anisotropic s wave pairing where the gap does not have spherical symmetry, but its momentum dependence reflects the underlying crystal symmetry; in both cases there is a minimum gap value min (which might be zero).
If the gap is anisotropic with a finite minimum min, the temperature dependence of the penetration depth is led by an exponential term
λ(0) |
|
|
− kBT |
|
|
|
λ(T ) − λ(0) |
|
exp |
|
min |
. |
(14.1.7) |
|
|
|
|
|||
Higher momentum pairing, such as a pairing with d wave symmetry, leads to several novel features. First, because the modes in the gap extend to zero energy, the exponential temperature dependence turns into a power law behavior, and
λ(0) |
|
T0 |
|
n |
|
|
|
|
|||||
λ(T ) − λ(0) |
|
|
T |
|
, |
(14.1.8) |
|
|
|
|
|
||
 k
k14.2 Density waves |
387 |
Needless to say, the rapid advances in the area of unusual superconductors may lead to other pairing symmetries or superconducting phases with competing order parameters. The exploration of the electrodynamic response is likely to play an important role.
14.2 Density waves
The electrodynamic properties of density waves have many features common to those that describe superconducting state. In both types of condensates, the collective mode couples to the electromagnetic field, and there is also a single-particle gap with single-particle excitations occurring for photon energies h¯ ω > 2 . There are, however, several important differences. As discussed in Section 7.3, the coherence factors appear in different combinations in the two types of condensates, leading to significant differences as far as the conductivities and spectral weights are concerned. Also, the effective mass of the charge density wave is large, and the sum rule arguments for superconductors have to be modified. In addition, due to lattice imperfections, the collective mode is pinned to the underlying lattice, shifting the mode to finite frequencies.
14.2.1 The collective mode
For a perfect crystal and for an incommensurate density wave, the collective mode contribution occurs at ω = 0 due to the translational invariance of the ground state. In the presence of impurities, however, this translational invariance is broken, and the collective modes are tied to the underlying lattice due to interactions with impurities [Gru88, Gru94a]. To first order this can be described by an average restoring force K = ω02m . The interaction between the collective mode and the lattice imperfections, impurities etc. may also lead to a finite relaxation time τ . With these effects the equation of motion for the phase becomes
d2φ |
+ |
1 dφ |
+ ω02 |
φ = − |
N e |
E(t) . |
(14.2.1) |
||
|
|
|
|
|
|||||
dt2 |
τ dt |
m |
|||||||
This equation is somewhat different from that derived in Eq. (7.2.12). Here we have neglected the term which is associated with the spatial deformation of the mode, and we have included a damping term – which leads to dissipation – together with a restoring force term – which shifts the response from zero to finite frequencies. Also, kF has been replaced by kF = π/N , a relation valid in one dimension. This differential equation is solved with a response σˆ coll(ω) similar to that of the Lorentz