

A_Compelling_Global_Resource
.pdfMcKinsey Sustainability & Resource Productivity |
|
Energy efficiency: A compelling global resource |
9 |
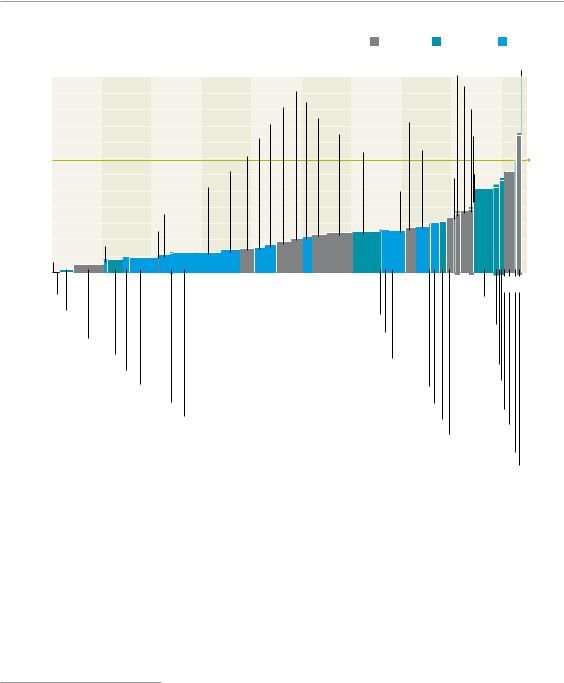
Exhibit 3
Clusters of efficiency potential in stationary uses of energy—2020
Percent, 100% = 9,100 trillion BTUs of end-use energy
40 |
35 |
|
|
|
25 |
Industrial
Total (trillion BTUs)
3,650
Non-energy-intensive 24 industry processes
Energy-intensive 43 industry processes
Energy support |
33 |
|
|
systems |
|
|
|
|
|
|
|
N = 330,000 enterprises
Commercial
Total (trillion BTUs) |
|
|
|
|
2,290 |
||
|
|
|
|
Community |
|
12 |
|
infrastructure |
|
|
|
|
13 |
|
|
Office and |
|
|
|
|
|
|
|
noncommercial equip. |
|
16 |
|
New private buildings |
|
|
|
|
25 |
|
|
Government buildings |
|
|
|
|
|
|
|
Existing private |
|
35 |
|
buildings |
|
|
|
|
|
|
|
N = 4.9 million buildings, ~3 billion devices
Residential
Total (trillion BTUs) |
|
|
|
|
3,160 |
||
Lighting and major |
|
|
|
|
11 |
|
|
appliances |
|
|
|
|
19 |
|
|
Electrical devices and |
|
|
|
small appliances |
|
|
|
|
10 |
|
|
New private buildings |
|
|
|
|
19 |
|
|
Government buildings |
|
|
|
|
|
|
|
Existing private |
|
41 |
|
buildings |
|
|
|
|
|
|
|
N = 129 million homes, 2.5 billion devices
%; 100% = 18,410 trillion BTUs of primary energy
CHP 8
33
27
32
Industrial
Total (trillion BTUs)
5,030
Non-energy-intensive 21 industry processes
Energy-intensive 37 industry processes
Energy support |
42 |
|
|
systems |
|
|
|
|
|
|
|
N = 330,000 enterprises
Commercial
Total (trillion BTUs)
|
5,970 |
||
|
|
|
|
Community |
|
15 |
|
infrastructure |
|
|
|
|
|
|
|
Office and |
|
30 |
|
non-commercial equip. |
|
|
|
New private buildings |
|
|
|
|
10 |
|
|
Government buildings |
|
14 |
|
Existing private |
|
|
|
|
31 |
|
|
buildings |
|
|
|
|
|
|
|
N = 4.9 million buildings, ~3 billion devices
Residential
Total (trillion BTUs)
|
6,020 |
||
Lighting and major |
|
|
|
|
16 |
|
|
appliances |
|
|
|
|
|
|
|
Electrical devices and |
|
30 |
|
small appliances |
|
|
|
New private buildings |
|
|
|
|
8 |
|
|
Government buildings |
|
15 |
|
|
|
|
|
Existing private |
|
31 |
|
buildings |
|
|
|
|
|
|
|
N = 129 million homes, 2.5 billion devices
Source: EIA AEO 2008, McKinsey analysis
10
(the amount of energy consumed per unit produced) and a 10 percent improvement in residential energy intensity compared with its projections of four years ago.10
Exhibit 4
US energy-efficiency supply curve—2020
|
|
|
|
|
|
|
|
|
|
Residential |
Commercial |
Industrial |
|||
|
|
|
|
|
|
|
|
|
|
|
Window improvements |
Freezers1 |
|||
|
|
24 |
|
|
|
|
|
|
|
|
|
|
|||
|
|
|
|
|
Programmable thermostats Non-energy-intensive large |
Air sealing |
|
|
|||||||
|
|
22 |
|
|
|
|
Sheath |
|
|
||||||
|
|
|
|
|
Lighting efficiencies |
establishments processes |
|
|
|
||||||
energy |
|
20 |
|
|
|
Basement insulation |
Attic |
|
improvements |
|
|||||
|
|
|
|
|
|
|
|
|
|||||||
|
|
Energy management for waste-heat recovery |
|
insulation |
|
Refrigeration |
|
||||||||
|
18 |
|
|
Pulp and paper processes |
|
|
Duct sealing |
Iron and steel |
improvements |
|
|||||
cost for end-use |
|
|
|
|
|
|
|||||||||
$ per MMBTU |
16 |
|
|
New building shell improvements |
|
|
Insulation |
processes |
|
|
|
||||
14 |
|
|
|
|
Water |
Boiler pipe |
13.801 |
||||||||
|
Waste heat recovery efficiencies |
|
|
|
|
||||||||||
12 |
|
|
|
|
Steam |
heaters |
insulation |
|
|||||||
|
Energy management for energy- |
|
|
|
|
||||||||||
|
|
|
|
|
systems |
|
|
|
|
||||||
10 |
|
intensive processes |
|
|
|
|
|
|
|
|
|||||
|
|
|
|
|
|
|
|
|
|
|
|||||
|
|
|
|
|
|
|
|
|
|
|
|
|
|
||
Average |
savings, |
8 |
Noncommercial electrical devices |
|
|
|
|
|
|
|
|
|
|
||
6 |
|
|
Home AC |
|
|
|
|
|
|
|
|
|
|
||
4 |
Cement processes |
|
|
|
|
|
|
|
|
|
|
||||
|
|
|
|
|
|
|
|
|
|
|
|
||||
|
|
2 |
Computers |
|
|
|
|
|
|
|
|
|
|
|
|
|
|
0 |
0 |
1,000 |
2,000 |
3,000 |
4,000 |
|
5,000 |
6,000 |
7,000 |
8,000 |
9,000 |
|
|
|
|
|
|
|
|||||||||||
Refrigerators |
|
|
|
Potential, trillion BTUs |
|
Lighting |
|
|
|||||||
|
Non-PC office |
|
|
|
|
|
Cooking efficiencies |
|
efficiencies |
|
|
||||
|
|
|
|
|
|
|
|
|
|
|
|||||
|
equipment |
|
|
|
|
|
|
Ventilation |
|
|
|||||
|
|
|
|
|
Non-energy-intensive small |
|
|
|
|||||||
|
Electrical devices |
|
|
|
|
|
improve- |
|
|
||||||
|
|
|
|
|
establishments processes |
|
|
ments |
|
|
|||||
|
Community infrastructure |
|
|
|
|
|
|
|
|||||||
|
|
|
|
Non-energy-intensive medium |
Dishwashers |
|
|
||||||||
|
|
|
|
|
|
|
|
|
|
||||||
|
|
|
Electric motors |
|
|
establishments processes |
|
|
|
||||||
|
|
|
|
|
|
|
Cooling |
|
|
||||||
Energy management for support systems |
|
|
|
|
Clothes washers |
|
|
|
|||||||
|
|
|
|
efficiencies |
|
|
|||||||||
|
|
|
|
Chemical processes |
|
|
|
|
Building utilities |
Wall insulation |
|
||||
|
|
|
|
|
|
|
|
|
|
|
|
|
|||
Energy management for non–energy intensive processes |
Heating efficiencies |
Heat |
|
Retrocommissioning |
efficiencies |
|
|
Slab insulation |
|
|
Water heaters1 |
1Average price of avoided energy consumption at the industrial price; $35.60/MMBTU represents the highest regional electricity price used; new build cost based on AEO 2008 future construction costs.
Source: EIA AEO 2008, McKinsey analysis
As impressive as the gains have been, however, an even greater potential remains because of the fundamental nature of energy efficiency and the presence of multiple, persistent barriers at both the individual opportunity level and overall system level. By their nature, energy-efficiency measures typically require a substantial upfront investment in exchange for savings that accrue over the
10 AEO 2004 and 2008.

McKinsey Sustainability & Resource Productivity |
|
Energy efficiency: A compelling global resource |
11 |
lifetime of the deployed measures. Additionally, efficiency potential is highly fragmented, spread across more than 100 million locations and billions of devices used in residential, commercial, and industrial settings. This dispersion virtually ensures that efficiency captures only limited mind-share—it is rarely the highest priority for anyone. Finally, measuring and verifying energy not consumed is by its nature difficult.
These attributes of energy efficiency give rise to opportunity-specific barriers that require opportunitylevel solution strategies and suggest components of an overarching strategy (Exhibit 5).
Exhibit 5
Multiple challenges associated with pursuing energy efficiency
Fundamental attributes of energy efficiency
•Requires outlay: Full capture would require initial outlay of approximately $520 billion, plus program costs
•Fragmented: Potential is spread across more than 100 million locations and billions of devices
•Low mind-share: Improving efficiency is rarely the primary focus of any in the economy
•Difficult to measure: Evaluating, measuring, and verifying savings, are more difficult than measuring consumption, impairing investor confidence
Opportunity-specific barriers
|
Structural |
• Agency: Incentives split between parties, impeding capture of potential |
|
• Pricing distortions: Regulatory, tax, or other distortions |
|
|
|
• Ownership transfer issue: Owner expects to leave before payback time |
|
|
• Transaction barriers: Unquantifiable incidental costs of deployment1 |
|
|
|
|
Behavioral |
• Risk and uncertainty: Regarding ability to capture benefit of the investment |
|
• Custom and habit: Practices that prevent capture of potential |
|
|
|
• Lack of awareness/information: About product efficiency and own |
|
|
consumption behavior |
|
|
• Elevated hurdle rate: Similar options treated differently |
|
|
|
|
Availability |
• Adverse bundling: Combining efficiency savings with costly options |
|
• Capital constraints: Inability to finance initial outlay |
|
|
|
|
|
|
• Product availability: Insufficient supply or channels to market |
|
|
• Installation and use: Improperly installed and/or operated |
|
|
|
Opportunity-specific solution strategies
•Information and education
•Incentives and financing
•Codes and standards
•Third-party involvement
Components of an overarching strategy
•Recognize energy efficiency as an important energy resource
while the nation concurrently develops new energy sources
•Launch an integrated portfolio of proven, piloted, and emerging approaches
•Identify methods to provide upfront funding
•Forge greater alignment among stakeholders
•Foster development of next-generation energy-efficient technologies
1Financial transaction barriers and actual quality trade-offs are factored into the initial NPV-positive potential calculation as real costs. Source: McKinsey analysis

12
Our research suggests that unlocking the full potential of a given opportunity requires addressing all barriers in a holistic rather than piecemeal fashion. To simplify the discussion, we have grouped individual opportunity barriers into three broad categories: structural, behavioral, and availability.
Structural barriers prevent an end-user from having the choice to capture what would otherwise be attractive efficiency potential; for example, tenants in an apartment building customarily have little choice about the efficiency of the HVAC system, even though they pay the utility bills.11 This type of agency barrier affects some 9 percent of the end-use energy-efficiency potential. Behavioral barriers include situations in which lack of awareness or end-user inertia block pursuit of an opportunity; for example, a facility manager, lacking awareness of energy consumption differences, might replace
a broken pump with a model having the lowest upfront cost rather than a more energy-efficient model with lower total ownership cost. Availability barriers include situations in which an end-user interested in and willing to pursue a measure cannot access it in an acceptable form; for example, a lack of access to capital might prevent the upgrade to a new heating system, or the bundling of
premium features with energy-efficiency measures in a dishwasher might dissuade an end-user from purchasing a more efficient model.
Solutions available to address the barriers
Experience over the past several decades reveals a large array of tools to address the barriers that impede capture of attractive efficiency potential. Some of these have been proven on a national scale, some have been piloted in select geographic areas or at certain times on a city scale, and others are emerging and merit trial but are not yet thoroughly tested. The array of proven, piloted, and emerging solutions falls into four broad categories:
Information and education. Increasing awareness of energy use and knowledge about specific energy-saving opportunities would enable end-users to act more swiftly in their own financial interest. Options include providing more information on utility bills or use of in-building displays, voluntary standards, additional deviceand building-labeling schemes, audits and assessments, and awareness campaigns.
Incentives and financing. Given the large upfront investment needed to capture efficiency potential, various approaches could reduce financial hurdles that end-users face. Options include traditional and creative financing vehicles (such as on-bill financing), monetary incentives and grants, including tax and cash incentives, and price signals, such as tiered pricing and externality pricing (carbon price, for example).
Codes and standards. In certain clusters, some form of mandate may be warranted to expedite the process of capturing potential, particularly where end-user or manufacturer awareness and attention are low. Options include mandatory audits and assessments, equipment standards, and building codes, including improving code enforcement.
11We refer to space conditioning systems generically as HVAC systems (heating, ventilation, and air conditioning), whether a building has a heating system, a cooling system, an air exchanger, or all three systems.

McKinsey Sustainability & Resource Productivity |
|
Energy efficiency: A compelling global resource |
13 |
Third-party involvement. A private company, utility, or government agency could support a “do-it-for-me” model for energy end-users by providing the operational engine to deploy measures, thereby addressing most noncapital barriers. When coupled with monetary incentives, this solution strategy could address the majority of barriers, though some number of end-users might decline the opportunity to receive the efficiency upgrade, preventing capture of the full potential.
For most opportunities a comprehensive approach will require multiple solutions to address the entire set of barriers facing a cluster of efficiency potential. Through an extensive review of the literature on energy efficiency and interviews with experts in this and related fields, we have attempted to define solutions that can address the various barriers under a variety of conditions.
Exhibit 6 illustrates how we mapped alternative solutions against the barriers for a cluster; Chapter 1 explains this approach in detail.
Exhibit 6
Addressing barriers in existing non-low-income homes
|
Barriers |
Manifestation of barrier |
|
|
|
|
|
Potential approach |
|
|
|
|
|
|
|
|
|
|
|
|
|
|
Agency |
Landlord-tenant issues |
|
|
|
|
|
|
|
|
|
issues |
impact 4% of potential |
|
|
|
|
|
Home labeling and |
|
|
|
|
|
|
|
|
|
|
|||
Structural |
Transaction |
Research, procurement, and |
|
|
|
|
|
assessments |
|
|
|
|
|
|
|
|
|
||||
|
barriers |
preparation time, and lifestyle impact |
|
|
|
|
|
|
|
|
|
Pricing |
|
|
|
|
|
|
|
|
|
|
distortions |
|
|
|
|
|
|
|
|
|
|
|
|
|
|
|
|
|
|
|
|
|
Ownership |
Limits payback to time owner lives in |
|
|
|
|
|
|
|
|
|
|
|
|
|
|
|
|
|
||
|
transfer issues |
home; impacts 40% of potential |
|
|
|
|
|
|
|
|
|
|
|
|
|
|
|
|
|
||
|
Risk and |
|
|
|
|
|
|
Innovative |
|
|
|
uncertainty1 |
|
|
|
|
|
|
financing vehicles |
|
|
Behavioral |
Awareness and |
Limited understanding of energy use |
|
|
|
|
|
Tax and other |
|
|
|
|
|
|
|
|
|
||||
|
information |
and measures to reduce |
|
|
|
|
|
incentives |
|
|
|
Custom and |
|
|
|
|
|
|
|
|
|
|
habit |
|
|
|
|
|
|
|
|
|
|
|
|
|
|
|
|
|
|
|
|
|
Elevated |
Cognitively shortened expected payback |
|
|
|
|
|
|
|
|
|
hurdle rate |
of 2.5 years, 40% discount factor |
|
|
|
|
|
|
|
|
|
Adverse |
|
|
|
|
|
|
|
|
|
|
|
|
|
|
|
|
Required upgrades |
|
|
|
|
bundling |
|
|
|
|
|
|
at point of sale/rent |
|
|
Availability |
Capital |
Competing uses for capital from |
|
|
|
|
|
|
|
|
|
constraints |
a constrained budget |
|
|
|
|
|
|
|
|
|
Product |
Limited availability of |
|
|
|
|
|
|
|
|
|
|
|
|
|
|
Develop certified |
|
|
||
|
availability |
contractors |
|
|
|
|
|
contractor market |
|
|
|
Installation |
Improper installation of measures; improper |
|
|
|
|
|
|
|
|
|
and use |
use of programmable thermostats |
|
|
|
|
|
|
|
|
|
|
|
|
|
|
|
|
|
|
|
1 Represents a minor barrier. Source: McKinsey analysis
Solution strategies
Educate users on energy consumption
Promote voluntary standards/labeling
Establish pricing signals
Increase availability of financing vehicles
Provide incentives and grants
Raise mandatory codes and standards
Support third-party installation
outlay Capital flow Information

14
Elements of a holistic implementation strategy
Capturing the full efficiency potential identified in this study would require an additional investment of $50 billion per year, four to five times 2008 levels of investment, sustained over a decade. Even the fastest-moving technologies of the past century that achieved widespread adoption, such as cellular telephones, microwaves, or radio, took 10 to 15 years to scale up at similar rates. Without an increase in national commitment it will remain challenging to unlock the full potential of energy efficiency. As noted previously, there are five important aspects to incorporate into the nation’s approach to scaling up and capturing the full potential of energy efficiency. An overarching strategy would need to:
1.Recognize energy efficiency as an important energy resource that can help meet future energy needs, while the nation concurrently develops new noand low-carbon energy sources. Energy efficiency is an important resource that is critical in the overall portfolio of energy solutions. Likewise, as indicated in our prior greenhouse gas abatement work,12 new sources of noand low-carbon generation are also important components of the portfolio. While it may initially seem counterintuitive given the magnitude of the energy-efficiency potential available over the next decade, there are important reasons for continuing to develop new
noand low-carbon options for energy supply. First, as described in our original report on US greenhouse gas abatement (Exhibit 7), energy efficiency in stationary uses of energy represents less than half of the potential abatement available to meet any future reduction targets. Additionally, some areas of the country will continue to experience growth, and some may need to retire and replace aging assets. Although it is uncertain, the growth of electric vehicles could add to these requirements. Finally, pursuing energy efficiency at the scale of the opportunity identified will present a set of risks related to the timing and magnitude of potential capture. As such there remains a strong rationale to diversify risk across supply and demand resources.
2.Formulate and launch at both national and regional levels an integrated portfolio of proven, piloted, and emerging approaches to unlock the full potential of energy
efficiency. There are multiple combinations of approaches the nation could take to help scale up the capture of energy efficiency. In addition to seeking the impact of national efforts, this portfolio should effectively and fairly reflect regional differences in energy-efficiency potential. Any approach would need to make the following three determinations:
—— The extent to which government should mandate energy efficiency through the expansion and enforcement of codes and standards
—— Beyond codes and standards, the extent to which government (or other publicly funded third parties) should directly deploy energy efficiency
—— The best methods by which to stimulate demand further and enable capture of the remaining energy-efficiency potential
12“Reducing US Greenhouse Gas Emissions: How Much at What Cost?” on www2.mckinsey.com/clientservice/ccsi/costcurves.

McKinsey Sustainability & Resource Productivity
Energy efficiency: A compelling global resource |
15 |
Exhibit 7
US mid-range greenhouse gas abatement curve—2030
NPV-positive efficiency in stationary energy uses
90 |
Commercial buildings— |
Industrial process |
|
||
improvements |
|
||||
|
|
||||
|
CFL lighting |
|
|
Nonrefrigerator appliances |
|
60 |
Residential |
|
|
|
|
|
|
|
|
||
|
electronics |
Commercial |
Residential |
|
|
|
|
|
|||
|
|
water heaters |
|
||
30 |
Residential |
water heaters |
|
||
buildings— |
|
|
|
|
|
|
|
|
|
|
|
|
Lighting |
|
|
|
|
e |
|
|
|
|
2 |
0 |
|
|
|
per ton CO |
|
|
|
|
–30 |
|
Industry— |
|
|
dollars |
|
|
||
|
|
|
||
|
|
Combined heat |
Commercial buildings—Control systems |
|
|
|
and power |
|
|
$ |
–60 |
|
Advanced process control |
|
Cost, real |
|
|
||
|
|
|
||
–90 |
|
Commercial buildings- |
||
|
|
combined heat and power |
||
|
|
Commercial |
||
|
|
|
|
|
|
|
buildings— |
Refrigeration |
|
|
–120 |
LED lighting |
|
|
|
Commercial buildings—New shell improvements |
|||
|
|
Commercial |
||
|
|
Fire and steam systems improvement |
||
|
|
electronics |
||
|
|
|
|
|
–150 |
Electric motor systems |
|
Residential buildings—
New shell improvements
–230 |
|
|
|
|
|
|
|
|
|
|
|
|
|
|
|
|
0 |
0.2 |
0.4 |
0.6 |
0.8 |
1.0 |
1.2 |
1.4 |
1.6 |
1.8 |
2.0 |
2.2 |
2.4 |
2.6 |
2.8 |
3.0 |
3.2 |
Potential, gigatons CO2e per year
Source: McKinsey analysis

16
Exhibit 8 illustrates one example of a portfolio of solution strategies focusing on those that have so far proven most successful. Such a tool facilitates evaluation of a portfolio against the relevant parameters of cost, risk (experience), and return (size of the potential).
Exhibit 8
Portfolio representing cost, experience, and potential of clusters possible with specified solution strategies
approach1 |
Emerging |
with relevant |
Piloted |
Experience |
Proven |
|
Office and non- |
|
|
|
Existing |
non–low |
|
|
||||||
|
commercial equipment |
|
|
|
|
|||||||||
|
|
|
income |
homes |
|
|
||||||||
|
Energy support |
Non-energy-intensive |
Existing private |
|
|
|||||||||
|
systems |
|
industry processes |
|
|
|
||||||||
|
|
|
|
|
|
|
|
|
buildings |
|
|
|
||
|
Electrical |
|
|
|
|
|
|
|
|
|
|
|
|
|
|
devices and |
|
|
Energy-intensive |
|
|
|
|||||||
|
small |
|
|
|
|
|
||||||||
|
|
|
industry processes |
|
|
|
||||||||
|
appliances |
|
|
|
|
|
||||||||
|
|
|
|
|
|
|
|
|
|
|
|
|
||
|
|
|
|
|
|
|
|
|
|
|
|
Government |
|
|
|
|
|
|
|
|
New homes |
|
|
buildings |
|
||||
|
|
|
|
|
|
|
|
|
|
|
||||
|
|
|
|
|
|
|
|
|
|
Existing low- |
|
|
||
|
Community |
|
|
|
|
|
|
|
income homes |
|
|
|||
|
|
|
|
|
|
|
|
|
|
|
|
|
||
|
infrastructure |
|
|
New private buildings |
|
|
||||||||
|
Combined heat |
|
|
Lighting and major appliances |
|
|||||||||
|
and power |
|
|
|
|
|||||||||
|
|
|
|
|
|
|
|
|
|
|
|
|
||
0 |
1 |
2 |
3 |
4 |
5 |
|
|
6 |
7 |
8 |
9 |
10 |
||
Cost of saved energy, $/MMBTU
Residential
Commercial
Industrial
CHP
Bubble area represents size of NPV-positive potential expressed in primary energy
1Drawing an analogy to our work with business transformation; piloted solutions represent those tried on the scale of
a state or major city (ie, over 1 million points of consumption), emerging are untested at that level, and proven have broad success at a national scale.
Source: EIA AEO 2008, McKinsey analysis
3.Identify methods to provide the significant upfront funding required by any plan to capture energy efficiency. End-user funding by consumers has proved difficult. Partial monetary incentives and supportive codes and standards increase direct funding by end-users: the former by reducing initial outlays and raising awareness, the latter by essentially forcing participation. Enhanced performance contracting or loan guarantees are relatively untested but could facilitate end-user funding. Alternatively, the entire national upfront investment of $520 billion (not including program costs) could be recovered through a system-benefit charge on energy on the order of $0.0059 per kilowatt-hour of electricity and $1.12 per MMBTU of other fuels over 10 years. This would represent an increase in average customer energy cost of 10 percent that would be more than offset by the eventual average bill savings of 27 percent. Different solution strategies and policies would result in different administrative cost structures. For example, codes and standards have been typically shown to incur less than 10 percent program cost, whereas low-income weatherization programs have averaged from 20 to 30 percent.13 Federal energy legislation under
13 Further discussion of program costs is included in Chapter 5 of the report.
McKinsey Sustainability & Resource Productivity |
|
Energy efficiency: A compelling global resource |
17 |
discussion at the time of this report’s publication will likely offer flexibility in the level of energy efficiency each state and energy provider may pursue. It will therefore be incumbent on states and local energy providers to undertake a rigorous analysis to assess the role of efficiency in the context of their overall regional energy strategy.
4.Forge greater alignment across utilities, regulators, government agencies, manufacturers, and energy consumers. Designing and executing a scaled-up national energy-efficiency program will require collaboration among many stakeholders. Three tasks in particular will need to be addressed to achieve the necessary level of collaboration. First, aligning utility regulation with the goal of greater energy efficiency is a prerequisite for utilities to support fully the pursuit of efficiency opportunities while continuing to meet the demands of their public or private owners. Second, setting customer expectations that energy efficiency will reduce energy bills, but not necessarily rates, will be important to securing customer support. Finally, measuring energy efficiency requires effective evaluation, measurement, and verification to provide assurance to stakeholders that programs and projects are achieving the savings claimed for them. Rather than attempting to provide “perfect” information, such programs can provide “sufficient” assurance by focusing on consistency, simplicity of design, and addressing both inputs and impact.
5.Foster innovation in the development and deployment of next-generation energyefficiency technologies to ensure ongoing productivity gains. With the launch of a significant national campaign to pursue energy efficiency, the country should also have a strategy to sustain the innovation required to secure future productivity gains. By design, technology development plays a minor role in the potential identified in this report, given its near-term focus. However,
we expect that innovative and cost-effective energy-saving technology will continue to emerge. Ongoing funding and support of energy-efficiency research and development can help keep the United States on a trajectory to even greater productivity gains than those presented in this report.
* * *
In the nation’s pursuit of energy affordability, climate change mitigation, and energy security, energy efficiency stands out as perhaps the single most promising resource. In the course of this work, we have highlighted the significant barriers to overcome, but have also provided evidence that none are insurmountable. We hope the information in this report further enriches the national debate and gives policy makers and business executives the added confidence and courage needed to take bold steps to formulate constructive ways to unlock the full potential of energy efficiency.

18


 The energy advantage:


 Germany can benefit
By Kalle Greven, Anja Hartmann, and Florian Jaeger
Energy has become a strategic factor for many global businesses today. The volatile price of fossil fuels, along with increasing demand for energy to support economic growth and the prospect of government-led efforts to reduce carbon emissions, suggests that energy will be of increasing relevance to companies’ cost structures and operating models in the years ahead. Energy considerations influence companies’ customers (businesses and consumers), as they demand more energy-efficient products and services. Energy-efficient process design could become a new wave in process reengineering. In the energy industry itself, the demand for innovative, climatefriendly technologies to produce heat and power is also growing.
Executives will focus on two perspectives about energy which, when combined, will be fundamental to developing strategic insights on the role of energy as a competitive factor in their sectors: 1) identifying the products and markets that are arising from new energy trends and the key capabilities required to succeed in these markets; and 2) pinpointing the energy-saving opportunities their own organization can capture through economically viable measures.
To get a better understanding of the strategic implications of energy, we looked closely at energy opportunities and costs in a single developed economy—Germany. While the issues of energy and sustainability matter around the globe, it is especially relevant for Germany. By our analysis, energy influences competitive advantage in roughly 44 percent of the German economy. This share is significantly higher than for all other Western industrialized countries. In looking closely at Germany the implications and dynamics become very clear; extrapolated, the implications apply globally, as well.1
Energy: A competitive factor for 40 percent of the global economy
In 2008, economic activity generated total estimated revenue of €90,750 billion worldwide. About 40 percent of the total—some €36,500 billion—is attributable to companies for which it is of strategic importance to manage the type, quantity, and cost of the energy used in their products and production processes. This share is likely to remain constant through 2020 (Exhibit 1). These sectors are:
1This article only captures highlights of the full analysis. The complete report, “Energy: A key to competitive advantage,” can be obtained from McKinsey & Company, Germany.