440 |
PART SIX THE ECONOMICS OF LABOR MARKETS |
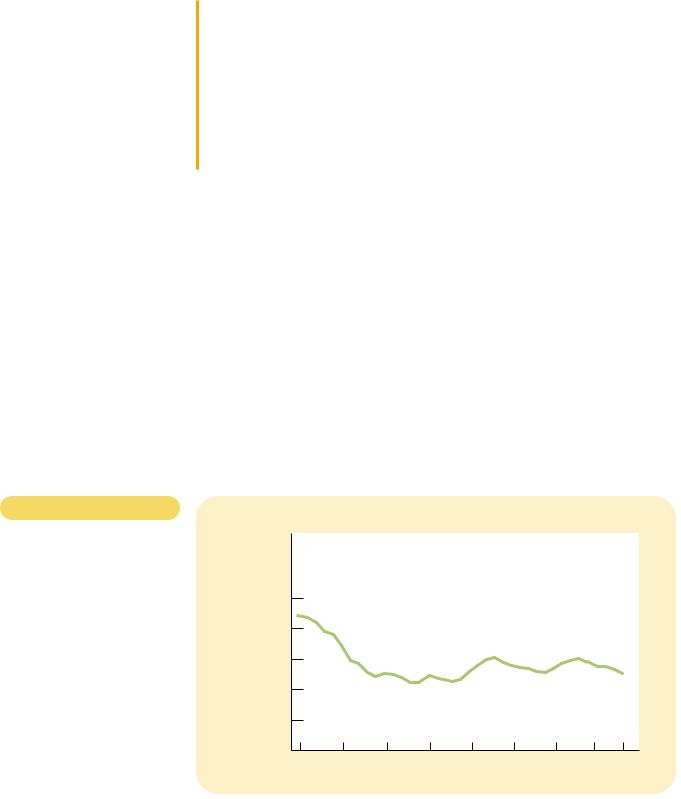
Table 20-2
INCOME INEQUALITY IN THE
UNITED STATES. This table shows the percent of total beforetax income received by families in each fifth of the income distribution and by those families in the top 5 percent.
|
BOTTOM |
SECOND |
MIDDLE |
FOURTH |
TOP |
TOP |
YEAR |
FIFTH |
FIFTH |
FIFTH |
FIFTH |
FIFTH |
5 PERCENT |
|
|
|
|
|
|
|
1998 |
4.2% |
9.9% |
15.7% |
23.0% |
47.3% |
20.7% |
1990 |
4.6 |
10.8 |
16.6 |
23.8 |
44.3 |
17.4 |
1980 |
5.2 |
11.5 |
17.5 |
24.3 |
41.5 |
15.3 |
1970 |
5.5 |
12.2 |
17.6 |
23.8 |
40.9 |
15.6 |
1960 |
4.8 |
12.2 |
17.8 |
24.0 |
41.3 |
15.9 |
1950 |
4.5 |
12.0 |
17.4 |
23.4 |
42.7 |
17.3 |
1935 |
4.1 |
9.2 |
14.1 |
20.9 |
51.7 |
26.5 |
|
|
|
|
|
|
|
Source: U.S. Bureau of the Census.
has received about 4 to 5 percent of income, while the top fifth has received about 40 to 50 percent of income. Closer inspection of the table reveals some trends in the degree of inequality. From 1935 to 1970, the distribution gradually became more equal. The share of the bottom fifth rose from 4.1 to 5.5 percent, and the share of the top fifth fell from 51.7 percent to 40.9 percent. In more recent years, this trend has reversed itself. From 1970 to 1998, the share of the bottom fifth fell from 5.5 percent to 4.2 percent, and the share of the top fifth rose from 40.9 to 47.3 percent.
In Chapter 19 we discussed some of the reasons for this recent increase in inequality. Increases in international trade with low-wage countries and changes in technology have tended to reduce the demand for unskilled labor and raise the demand for skilled labor. As a result, the wages of unskilled workers have fallen relative to the wages of skilled workers, and this change in relative wages has increased inequality in family incomes.
CASE STUDY THE WOMEN’S MOVEMENT AND
THE INCOME DISTRIBUTION
Over the past several decades, there has been a dramatic change in women’s role in the economy. The percentage of women who hold jobs has risen from about 32 percent in the 1950s to about 54 percent in the 1990s. As full-time homemakers have become less common, a woman’s earnings have become a more important determinant of the total income of a typical family.
Although the women’s movement has led to more equality between men and women in access to education and jobs, it has also led to less equality in family incomes. The reason is that the rise in women’s labor-force participation has not been the same across all income groups. In particular, the women’s movement has had its greatest impact on women from high-income households. Women from low-income households have long had high rates of participation in the labor force, even in the 1950s, and their behavior has changed much less.
In essence, the women’s movement has changed the behavior of the wives of high-income men. In the 1950s, a male executive or physician was likely to marry a woman who would stay at home and raise the children. Today, the wife of a male executive or physician is more likely to be an executive or physician herself. The result is that rich households have become even richer, a pattern that raises inequality in family incomes.

CHAPTER 20 INCOME INEQUALITY AND POVERTY |
441 |
As this example shows, there are social as well as economic determinants of the distribution of income. Moreover, the simplistic view that “income inequality is bad” can be misleading. Increasing the opportunities available to women was surely a good change for society, even if one effect was greater inequality in family incomes. When evaluating any change in the distribution of income, policymakers must look at the reasons for that change before deciding whether it presents a problem for society.
EQUALITY FOR WOMEN HAS MEANT
LESS EQUALITY FOR FAMILY INCOMES.
CASE STUDY INCOME INEQUALITY AROUND THE WORLD
How does the amount of income inequality in the United States compare to that in other countries? This question is interesting, but answering it is problematic. For many countries, data are not available. Even when they are, not every country in the world collects data in the same way; for example, some countries collect data on individual incomes, whereas other countries collect data on family incomes. As a result, whenever we find a difference between two countries, we can never be sure whether it reflects a true difference in the economies or merely a difference in the way data are collected.
With this warning in mind, consider Table 20-3, which compares the income distribution of the United States to that of seven other countries. The countries
COUNTRY |
BOTTOM FIFTH |
SECOND FIFTH |
MIDDLE FIFTH |
FOURTH FIFTH |
TOP FIFTH |
|
|
|
|
|
|
Germany |
9.0% |
13.5% |
17.5% |
22.9% |
37.1% |
Canada |
7.5 |
12.9 |
17.2 |
23.0 |
39.3 |
Russia |
7.4 |
12.6 |
17.7 |
24.2 |
38.2 |
United Kingdom |
7.1 |
12.8 |
17.2 |
23.1 |
39.8 |
China |
5.5 |
9.8 |
14.9 |
22.3 |
47.5 |
United States |
4.8 |
10.5 |
16.0 |
23.5 |
45.2 |
Chile |
3.5 |
6.6 |
10.9 |
18.1 |
61.0 |
Brazil |
2.5 |
5.7 |
9.9 |
17.7 |
64.2 |
|
INCOME INEQUALITY AROUND THE WORLD. This table shows the percent of total before- |
Table 20-3 |
|
tax income received by families in each fifth of the income distribution. |
|
|
Source: World Development Report: 1998/99, pp. 198–199.
CHAPTER 20 INCOME INEQUALITY AND POVERTY |
443 |
GROUP |
POVERTY RATE |
|
|
All persons |
12.7% |
White, not Hispanic |
8.2 |
Black |
26.1 |
Hispanic |
25.6 |
Asian, Pacific Islander |
12.5 |
Children (under age 18) |
18.9 |
Elderly (over age 64) |
10.5 |
Female household, no husband present |
33.1 |
|
|
Source: U.S. Bureau of the Census. Data are for 1998.
for inflation) rose more than 50 percent during this period. Because the poverty line is an absolute rather than a relative standard, more families are pushed above the poverty line as economic growth pushes the entire income distribution upward. As John F. Kennedy once put it, a rising tide lifts all boats.
Since the early 1970s, however, the economy’s rising tide has left some boats behind. Despite continued (although somewhat slower) growth in average income, the poverty rate has not declined. This lack of progress in reducing poverty in recent years is closely related to the increasing inequality we saw in Table 20-2. Although economic growth has raised the income of the typical family, the increase in inequality has prevented the poorest families from sharing in this greater economic prosperity.
Poverty is an economic malady that affects all groups within the population, but it does not affect all groups with equal frequency. Table 20-4 shows the poverty rates for several groups, and it reveals three striking facts:
Poverty is correlated with race. Blacks and Hispanics are about three times more likely to live in poverty than are whites.
Poverty is correlated with age. Children are more likely than average to be members of poor families, and the elderly are less likely than average to be poor.
Poverty is correlated with family composition. Families headed by a female adult and without a husband present are more than twice as likely to live in poverty as the average family.
These three facts have described U.S. society for many years, and they show which people are most likely to be poor. These effects also work together: Among black and Hispanic children in female-headed households, more than half live in poverty.
Table 20-4
WHO IS POOR? This table shows that the poverty rate varies greatly among different groups within the population.
PROBLEMS IN MEASURING INEQUALITY
Although data on the income distribution and the poverty rate help to give us some idea about the degree of inequality in our society, interpreting these data is not as straightforward as it might first appear. The data are based on households’
446 |
PART SIX THE ECONOMICS OF LABOR MARKETS |
ECONOMIC MOBILITY
People sometimes speak of “the rich” and “the poor” as if these groups consisted of the same families year after year. In fact, this is not at all the case. Economic mobility, the movement of people among income classes, is substantial in the U.S. economy. Movements up the income ladder can be due to good luck or hard work, and movements down the ladder can be due to bad luck or laziness. Some of this mobility reflects transitory variation in income, while some reflects more persistent changes in income.
Because economic mobility is so great, many of those below the poverty line are there only temporarily. Poverty is a long-term problem for relatively few families. In a typical ten-year period, about one in four families falls below the poverty line in at least one year. Yet fewer than 3 percent of families are poor for eight or more years. Because it is likely that the temporarily poor and the persistently poor face different problems, policies that aim to combat poverty need to distinguish between these groups.
Another way to gauge economic mobility is the persistence of economic success from generation to generation. Economists who have studied this topic find substantial mobility. If a father earns 20 percent above his generation’s average income, his son will most likely earn 8 percent above his generation’s average income. There is almost no correlation between the income of a grandfather and the income of a grandson. There is much truth to the old saying, “From shirtsleeves to shirtsleeves in three generations.”
One result of this great economic mobility is that the U.S. economy is filled with self-made millionaires (as well as with heirs who squandered the fortunes they inherited). According to estimates for 1996, about 2.7 million households in the United States had net worth (assets minus debts) that exceeded $1 million. These households represented the richest 2.8 percent of the population. About four out of five of these millionaires made their money on their own, such as by starting and building a business or by climbing the corporate ladder. Only one in five millionaires inherited their fortunes.
QUICK QUIZ: What does the poverty rate measure? Describe three potential problems in interpreting the measured poverty rate.
THE POLITICAL PHILOSOPHY
OF REDISTRIBUTING INCOME
We have just seen how the economy’s income is distributed and have considered some of the problems in interpreting measured inequality. This discussion was positive in the sense that it merely described the world as it is. We now turn to the normative question facing policymakers: What should the government do about economic inequality?
This question is not just about economics. Economic analysis alone cannot tell us whether policymakers should try to make our society more egalitarian. Our views on this question are, to a large extent, a matter of political philosophy. Yet
CHAPTER 20 INCOME INEQUALITY AND POVERTY |
447 |
because the government’s role in redistributing income is central to so many debates over economic policy, here we digress from economic science to consider a bit of political philosophy.
UTILITARIANISM
A prominent school of thought in political philosophy is utilitarianism. The founders of utilitarianism are the English philosophers Jeremy Bentham (1748–1832) and John Stuart Mill (1806–1873). To a large extent, the goal of utilitarians is to apply the logic of individual decisionmaking to questions concerning morality and public policy.
The starting point of utilitarianism is the notion of utility—the level of happiness or satisfaction that a person receives from his or her circumstances. Utility is a measure of well-being and, according to utilitarians, is the ultimate objective of all public and private actions. The proper goal of the government, they claim, is to maximize the sum of utility of everyone in society.
The utilitarian case for redistributing income is based on the assumption of diminishing marginal utility. It seems reasonable that an extra dollar of income to a poor person provides that person with more additional utility than does an extra dollar to a rich person. In other words, as a person’s income rises, the extra wellbeing derived from an additional dollar of income falls. This plausible assumption, together with the utilitarian goal of maximizing total utility, implies that the government should try to achieve a more equal distribution of income.
The argument is simple. Imagine that Peter and Paul are the same, except that Peter earns $80,000 and Paul earns $20,000. In this case, taking a dollar from Peter to pay Paul will reduce Peter’s utility and raise Paul’s utility. But, because of diminishing marginal utility, Peter’s utility falls by less than Paul’s utility rises. Thus, this redistribution of income raises total utility, which is the utilitarian’s objective.
At first, this utilitarian argument might seem to imply that the government should continue to redistribute income until everyone in society has exactly the same income. Indeed, that would be the case if the total amount of income— $100,000 in our example—were fixed. But, in fact, it is not. Utilitarians reject complete equalization of incomes because they accept one of the Ten Principles of Economics presented in Chapter 1: People respond to incentives.
To take from Peter to pay Paul, the government must pursue policies that redistribute income, such as the U.S. federal income tax and welfare system. Under these policies, people with high incomes pay high taxes, and people with low incomes receive income transfers. Yet, as we have seen in Chapters 8 and 12, taxes distort incentives and cause deadweight losses. If the government takes away additional income a person might earn through higher income taxes or reduced transfers, both Peter and Paul have less incentive to work hard. As they work less, society’s income falls, and so does total utility. The utilitarian government has to balance the gains from greater equality against the losses from distorted incentives. To maximize total utility, therefore, the government stops short of making society fully egalitarian.
A famous parable sheds light on the utilitarian’s logic. Imagine that Peter and Paul are thirsty travelers trapped at different places in the desert. Peter’s oasis has much water; Paul’s has little. If the government could transfer water from one oasis
utilitarianism
the political philosophy according to which the government should choose policies to maximize the total utility of everyone in society
utility
a measure of happiness or satisfaction
448 |
PART SIX THE ECONOMICS OF LABOR MARKETS |
to the other without cost, it would maximize total utility from water by equalizing the amount in the two places. But suppose that the government has only a leaky bucket. As it tries to move water from one place to the other, some of the water is lost in transit. In this case, a utilitarian government might still try to move some water from Peter to Paul, depending on how thirsty Paul is and how leaky the bucket is. But, with only a leaky bucket at its disposal, a utilitarian government will not try to reach complete equality.
liberalism
the political philosophy according to which the government should choose policies deemed to be just, as evaluated by an impartial observer behind a “veil of ignorance”
maximin criterion
the claim that the government should aim to maximize the well-being of the worst-off person in society
LIBERALISM
A second way of thinking about inequality might be called liberalism. Philosopher John Rawls develops this view in his book A Theory of Justice. This book was first published in 1971, and it quickly became a classic in political philosophy.
Rawls begins with the premise that a society’s institutions, laws, and policies should be just. He then takes up the natural question: How can we, the members of society, ever agree on what justice means? It might seem that every person’s point of view is inevitably based on his or her particular circumstances—whether he or she is talented or less talented, diligent or lazy, educated or less educated, born to a wealthy family or a poor one. Could we ever objectively determine what a just society would be?
To answer this question, Rawls proposes the following thought experiment. Imagine that before any of us is born, we all get together for a meeting to design the rules that govern society. At this point, we are all ignorant about the station in life each of us will end up filling. In Rawls’s words, we are sitting in an “original position” behind a “veil of ignorance.” In this original position, Rawls argues, we can choose a just set of rules for society because we must consider how those rules will affect every person. As Rawls puts it, “Since all are similarly situated and no one is able to design principles to favor his particular conditions, the principles of justice are the result of fair agreement or bargain.” Designing public policies and institutions in this way allows us to be objective about what policies are just.
Rawls then considers what public policy designed behind this veil of ignorance would try to achieve. In particular, he considers what income distribution a person would consider just if that person did not know whether he or she would end up at the top, bottom, or middle of the distribution. Rawls argues that a person in the original position would be especially concerned about the possibility of being at the bottom of the income distribution. In designing public policies, therefore, we should aim to raise the welfare of the worst-off person in society. That is, rather than maximizing the sum of everyone’s utility, as a utilitarian would do, Rawls would maximize the minimum utility. Rawls’s rule is called the maximin criterion.
Because the maximin criterion emphasizes the least fortunate person in society, it justifies public policies aimed at equalizing the distribution of income. By transferring income from the rich to the poor, society raises the well-being of the least fortunate. The maximin criterion would not, however, lead to a completely egalitarian society. If the government promised to equalize incomes completely, people would have no incentive to work hard, society’s total income would fall substantially, and the least fortunate person would be worse off. Thus, the maximin criterion still allows disparities in income, because such disparities can improve incentives and thereby raise society’s ability to help the poor. Nonetheless,