

Baumol & Blinder MACROECONOMICS (11th ed)
.pdfLICENSED TO:
CHAPTER 11 |
Managing Aggregate Demand: Fiscal Policy |
227 |
|
|
Potential |
45° |
|
|
|
|
|
|
Potential |
45° |
|
|
GDP |
|
|
|
|
|
|
GDP |
||
|
|
|
|
|
|
|
|
|
|
||
Real Expenditure |
|
|
|
Real Expenditure |
|
|
|
|
|
F |
|
|
C + I + G0 + |
C + I + G1 + |
|
|
|||||||
|
( |
X |
– |
IM |
) |
C + I + G0 + |
|||||
|
(X – IM ) |
|
|
||||||||
E |
|
|
|
|
|
(X – IM ) |
|||||
|
|
|
|
|
|
|
|||||
|
|
|
|
|
|
|
|
|
|
||
|
Recessionary |
|
|
|
|
|
|
|
|
|
|
|
gap |
|
|
|
|
|
|
|
|
|
|
5,000 |
6,000 |
7,000 |
|
|
5,000 |
6,000 |
7,000 |
|
|||
|
Real GDP |
|
|
|
|
|
|
Real GDP |
|
||
|
(a) |
|
|
|
|
|
|
|
(b) |
|
|
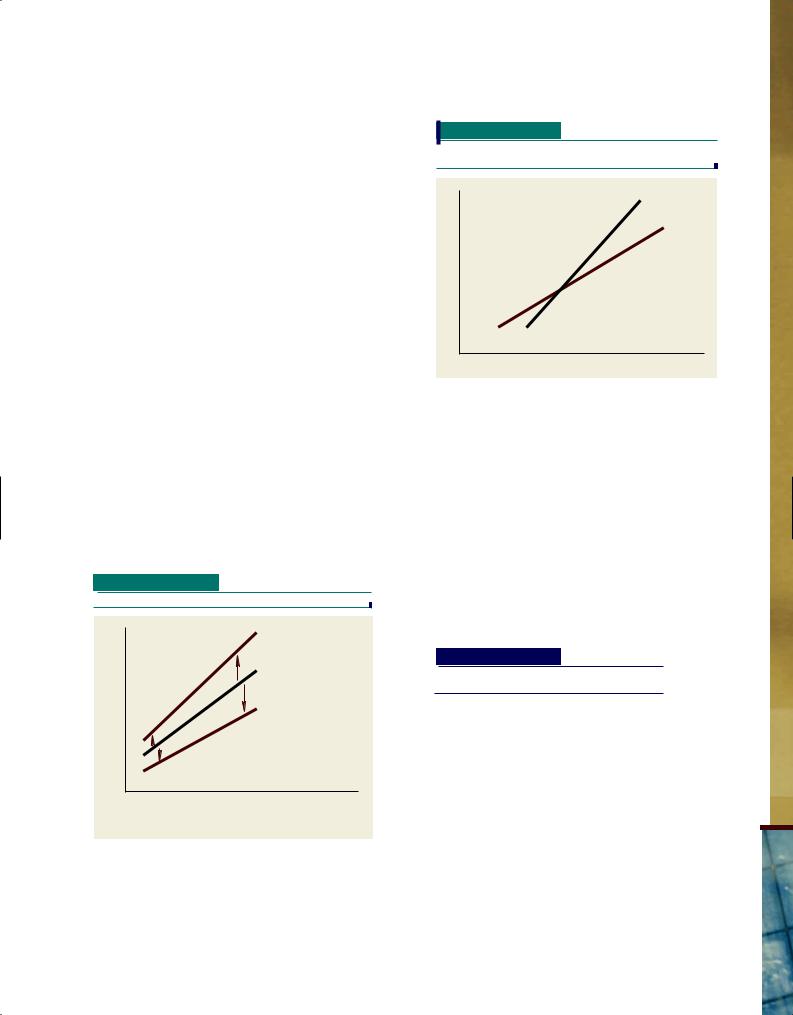
NOTE: Figures are in billions of dollars per year.
FIGURE 3
Fiscal Policy to Eliminate a Recessionary Gap
PLANNING CONTRACTIONARY FISCAL POLICY
The preceding example assumed that the basic problem of fiscal policy is to close a recessionary gap, as was surely the case in 2001 and then again in 2008. But only two years earlier, in 1999, most economists believed that the major macroeconomic problem in the United States was just the opposite: Real GDP exceeded potential GDP, producing an inflationary gap. And some people believed that an inflationary gap emerged once again in 2006 and 2007 when the unemployment rate dropped to around 4.5 percent. In such a case, government would wish to adopt more restrictive fiscal policies to reduce aggregate demand.
It does not take much imagination to run our previous analysis in reverse. If an inflationary gap would arise from a continuation of current budget policies, contractionary fiscal policy tools can eliminate it. By cutting spending, raising taxes, or by some combination of the two, the government can pull the C 1 G 1 I 1 (X 2 IM) schedule down to a noninflationary position and achieve an equilibrium at full employment.
Notice the difference between this way of eliminating an inflationary gap and the natural self-correcting mechanism that we discussed in the last chapter. There we observed that, if the economy were left to its own devices, a cumulative but self-limiting process of inflation would eventually eliminate the inflationary gap and return the economy to full employment. Here we see that we need not put the economy through the inflationary wringer. Instead, a restrictive fiscal policy can avoid inflation by limiting aggregate demand to the level that the economy can produce at full employment.
THE CHOICE BETWEEN SPENDING POLICY AND TAX POLICY
In principle, fiscal policy can nudge the economy in the desired direction equally well by changing government spending or by changing taxes. For example, if the government wants to expand the economy, it can raise G or lower T. Either policy would shift the total expenditure schedule upward, as depicted in Figure 3(b), thereby raising equilibrium GDP on the demand side.
In terms of our aggregate demand-and-supply diagram, either policy shifts the aggregate demand curve outward, as illustrated in the shift from D0D0 to D1D1 in Figure 4 on the next page. As a result, the economy’s equilibrium moves from point E to point A. Both real GDP and the price level rise. As this diagram points out,
Copyright 2009 Cengage Learning, Inc. All Rights Reserved. May not be copied, scanned, or duplicated, in whole or in part.

LICENSED TO: |
|
|
|
|
|
|
|
|
|
|
|
|
|
||
228 |
|
PART 3 |
Fiscal and Monetary Policy |
|
|||||||||||
|
|
|
|
|
|
|
|
|
|
Any combination of higher spending and lower taxes that produces the same aggregate |
|||||
|
FIGURE 4 |
|
|
|
|||||||||||
|
|
|
|
|
|
|
|
|
|
demand curve leads to the same increases in real GDP and prices. |
|||||
|
Expansionary Fiscal |
|
|
|
|||||||||||
|
|
|
|
|
|
|
|
|
|
|
|||||
|
Policy |
|
|
|
|
|
|
|
|
|
|
|
|
How, then, do policy makers decide whether to raise spending |
|
|
|
|
|
|
|
|
|
|
|
|
|
|
|||
|
|
|
|
|
|
|
|
|
|
|
|
|
|
|
|
|
|
|
|
|
|
|
|
|
|
|
|
|
|
|
or to cut taxes? The answer depends mainly on how large a pub- |
|
|
|
|
|
|
|
|
|
|
|
|
|
|
|
|
|
|
|
|
D1 |
|
|
|
|
|
|
S |
lic sector they want to create—a major issue in the long-running |
|||
|
|
|
|
|
|
|
|
|
|
|
|
|
|
|
debate in the United States over the proper size of government. |
|
|
|
|
|
|
|
|
|
|
|
|
|
|
|
The small-government point of view, typically advocated |
|
|
|
D0 |
|
|
|
|
|
|
|
|
|
by conservatives, says that we are foolish to rely on the public |
||
|
Level |
|
|
|
|
|
|
|
|
A |
|
|
|
|
sector to do what private individuals and businesses can do |
|
|
|
|
|
|
|
|
|
|
|
|
|
better. Conservatives believe that the growth of government |
||
|
|
|
|
|
|
|
|
|
|
|
|
|
|
|
|
|
Price |
|
|
|
|
|
|
|
|
|
|
|
|
|
interferes too much in our everyday lives, thereby curtailing |
|
|
price level |
|
|
|
|
|
|
|
|
|
our freedom. Those who hold this view can argue for tax cuts |
|||
|
|
|
Rise in |
|
E |
|
|
|
|
|
|||||
|
|
|
|
|
|
|
|
|
|
|
|
|
|
|
when macroeconomic considerations call for expansionary fis- |
|
|
|
|
|
|
|
|
|
|
|
|
|
|
|
|
|
|
|
|
|
|
|
|
|
|
|
|
|
|
|
|
|
|
|
|
|
|
|
|
|
|
|
|
D1 |
cal policy, as President Bush did, and for lower public spending |
||
|
|
|
|
|
|
|
|
|
|
|
|
|
|
|
when contractionary policy is required. |
|
|
|
|
S |
Rise in |
|
|
|
|
||||||
|
|
|
|
|
|
|
|
An opposing opinion, expressed more often by liberals, holds |
|||||||
|
|
|
|
real GDP |
|
|
|
|
|||||||
|
|
|
|
|
|
|
D0 |
||||||||
|
|
|
|
|
|
|
|
|
|
|
|
that something is amiss when a country as wealthy as the United |
|||
|
|
|
|
|
|
|
|
|
|
|
|
|
|
|
|
|
|
|
|
|
|
Real GDP |
|
|
|
|
States has such an impoverished public sector. In this view, |
||||
|
|
|
|
|
|
|
|
|
|
|
|
|
|
|
America’s most pressing needs are not for more fast food and |
|
|
|
|
|
|
|
|
|
|
Journal— |
Syndicate |
|
|
|
video games but, rather, for better schools, better transportation |
|
|
|
|
|
|
|
|
|
|
the debate believe that we should increase spending when the economy needs |
|||||
|
|
|
|
|
|
|
|
|
|
StreetWallTheFromSOURCE: |
FeaturesCartoonPermission, |
infrastructure, and health insurance for all of our citizens. People on this side of |
|||
|
|
|
|
|
|
|
|
|
|
stimulus and pay for these improved public services by increasing taxes when it is |
|||||
|
|
|
|
|
|
|
|
|
|
|
|
||||
|
|
|
|
|
|
|
|
|
|
|
|
necessary to rein in the economy. |
|||
|
|
|
|
|
|
|
|
|
|
|
|
It is important not to confuse the fiscal stabilization issue with the “big- |
|||
|
|
|
|
|
|
|
|
|
|
|
|
government” issue. In fact, |
|||
|
|
|
|
|
|
|
|
|
|
|
|
Individuals favoring a smaller public sector can advocate an active fiscal policy |
|||
|
“Free gifts to every kid in the |
|
just as well as those who favor a larger public sector. Advocates of bigger gov- |
||||||||||||
|
|
ernment should seek to expand demand (when appropriate) through higher |
|||||||||||||
|
world? Are you a Keynesian or |
|
government spending and to contract demand (when appropriate) through tax |
||||||||||||
|
|
|
something?” |
|
|||||||||||
|
|
|
|
increases. But advocates of smaller government should seek to expand demand |
|||||||||||
|
|
|
|
|
|
|
|
|
|
|
|
||||
|
|
|
|
|
|
|
|
|
|
|
|
by cutting taxes and to reduce demand by cutting expenditures. |
|||
|
|
|
|
|
|
|
|
|
Indeed, our two most conservative recent presidents, Ronald Reagan and George W. Bush, |
||||||
|
|
|
|
|
|
|
|
|
each pursued activist fiscal policies based on tax cuts. |
||||||
|
|
|
|
|
|
|
|
|
|
|
|
|
|||
|
|
|
|
|
|
|
|
|
ISSUE REDUX: |
|
|
DEMOCRATS VERSUS REPUBLICANS |
|||
|
|
|
|
|
|
|
|
|
|
|
|
|
|
|
|
While both parties favored fiscal stimulus, the choice between extending the Bush tax cuts or replacing them with spending played a central role in the economic debate during the 2008 presidential campaign. John McCain staunchly defended President Bush’s tax cuts, partly on the grounds that “small government” is better than “big government.” He even advocated further tax cuts. But both Barack Obama and Hillary Clinton argued, for example, that providing
health insurance coverage to more Americans was a higher priority than providing tax cuts for the well-to-do. Democrats also favored other spending on such things as environmental protection and infrastructure.
SOME HARSH REALITIES
The mechanics outlined so far in this chapter make the fiscal policy planner’s job look deceptively simple. The elementary diagrams make it appear that policy makers can drive GDP to any level they please simply by manipulating spending and tax programs. It seems they should be able to hit the full-employment bull’s-eye every time. In fact, a
Copyright 2009 Cengage Learning, Inc. All Rights Reserved. May not be copied, scanned, or duplicated, in whole or in part.

LICENSED TO:
CHAPTER 11 |
Managing Aggregate Demand: Fiscal Policy |
229 |
better analogy is to a poor rifleman shooting through dense fog at an erratically moving target with an inaccurate gun and slow-moving bullets.
The target is moving because, in the real world, the investment, net exports, and consumption schedules constantly shift about as expectations, technology, events abroad, and other factors change. For all of these reasons and others, the policies decided on today, which will take effect at some future date, may no longer be appropriate by the time that future date rolls around.
The second misleading feature of our diagrams (the “inaccurate gun”) is that we do not know multipliers as precisely as in our numerical examples. Although our best guess may be that a $20 billion increase in government purchases will raise GDP by $30 billion (a multiplier of 1.5), the actual outcome may be as little as $20 billion or as much as $40 billion. It is therefore impossible to “fine-tune” every little wobble out of the economy’s growth path. Economic science is simply not that precise.
A third complication is that our target—full-employment GDP—may be only dimly visible, as if through a fog. For example, with the unemployment rate hovering around 4.5 percent for parts of 2006 and 2007, there was a vigorous debate over whether the U.S. economy was above or below full employment.
A fourth complication is that the fiscal policy “bullets” travel slowly: Tax and spending policies affect aggregate demand only after some time elapses. Consumer spending, for example, may take months to react to an income-tax cut. Because of these time lags, fiscal policy decisions must be based on forecasts of the future state of the economy. And forecasts are not always accurate. The combination of long lags and poor forecasts may occasionally leave the government fighting the last recession just as the new inflation gets under way.
And, finally, the people aiming the fiscal “rifle” are politicians, not economic technicians. Sometimes political considerations lead to policies that deviate markedly from what textbook economics would suggest. And even when they do not, the wheels of Congress grind slowly.
In addition to all of these operational problems, legislators trying to decide whether to push the unemployment rate lower would like to know the answers to two further questions. First, since either higher spending or lower taxes will increase the government’s budget deficit, what are the long-run costs of running large budget deficits? This is a question we will take up in depth in Chapter 15. Second, how large is the inflationary cost likely to be? As we know, an expansionary fiscal policy that reduces a recessionary gap by increasing aggregate demand will lower unemployment. But, as Figure 4 reminds us, it also tends to be inflationary. This undesirable side effect may make the government hesitant to use fiscal policy to combat recessions.
Is there a way out of this dilemma? Can we pursue the battle against unemployment without aggravating inflation? For about 30 years now, a small but influential minority of economists, journalists, and politicians have argued that we can. They call their approach “supply-side economics.” The idea helped sweep Ronald Reagan to smashing electoral victories in 1980 and 1984 and was revived under President George W. Bush. Just what is supply-side economics?
THE IDEA BEHIND SUPPLY-SIDE TAX CUTS
The central idea of supply-side economics is that certain types of tax cuts increase aggregate supply. For example, taxes can be cut in ways that raise the rewards for working, saving, and investing. Then, if people actually respond to these incentives, such tax cuts will increase the total supplies of labor and capital in the economy, thereby increasing aggregate supply.
Figure 5, on the next page, illustrates the idea on an aggregate supply-and-demand diagram. If policy measures can shift the economy’s aggregate supply to position S1S1, then prices will be lower and output higher than if the aggregate supply curve remained at S0S0. Policy makers will have reduced inflation and raised real output at the same time—as shown by point B in the figure. The trade-off between inflation and unemployment will have been defeated, which is the goal of supply-side economics.
Copyright 2009 Cengage Learning, Inc. All Rights Reserved. May not be copied, scanned, or duplicated, in whole or in part.

LICENSED TO:
230 |
PART 3 |
Fiscal and Monetary Policy |
FIGURE 5
The Goal of Supply-
Side Tax Cuts
D
Price Level
S0
S1
FIGURE 6
A Successful Supply-
Side Tax Reduction
D1
D0
Price Level
S0
What sorts of policies do supply-siders advocate? Here is a sample of their long list of recommended tax cuts:
|
|
|
|
|
|
Lower Personal Income-Tax Rates Sharp cuts in personal |
|
|
|
|
|
|
|
|
|
|
S0 |
|
taxes were the cornerstone of the economic strategy of George W. |
|
|
|
|
|
Bush, just as they had been for Ronald Reagan 20 years earlier. |
||
|
|
|
|
|
S1 |
|
|
|
|
|
|
Since 2001, tax rates on individuals have been reduced in stages, |
|
|
|
|
|
|
|
|
|
|
|
|
|
|
|
|
|
|
|
|
|
and in several ways. The four upper tax bracket rates, which |
|
|
|
|
|
|
were 39.6 percent, 36 percent, 31 percent, and 28 percent when |
A |
|
|
|
President Bush assumed office, have been reduced to 35 percent, |
||
|
|
|
33 percent, 28 percent, and 25 percent, respectively. In addition, |
|||
|
|
|
|
|
|
|
|
|
|
|
|
|
some very low income taxpayers have seen their tax rate fall |
|
|
|
|
|
|
from 15 percent to 10 percent. Lower tax rates, supply-siders ar- |
|
|
|
|
|
|
gue, augment the supplies of both labor and capital. |
|
|
|
|
|
|
Reduce Taxes on Income from Savings One extreme form |
|
|
D |
|
|
|
of this proposal would simply exempt from taxation all income |
|
|
|
|
|
|
from interest and dividends. Because income must be either con- |
Real GDP |
|
|
|
sumed or saved, doing this would, in effect, change our present |
||
|
|
|
|
|
|
|
|
|
|
|
|
|
personal income tax into a tax on consumer spending. Several such |
proposals for radical tax reform have been considered in Washington over the years, but never adopted. However, Congress did reduce the tax rate on dividends to just 15 percent in 2003. And since then, both President Bush and a number of Democrats have proposed additional tax preferences for saving.
Reduce Taxes on Capital Gains When an investor sells an asset for a profit, that profit is called a capital gain. Supply-siders argue that the government can encourage more investment by taxing capital gains at lower rates than ordinary income. This proposal was acted upon in 2003, when the top rate on capital gains was cut to 15 percent.
Reduce the Corporate Income Tax By reducing the tax burden on corporations, proponents argue, the government can provide both greater investment incentives (by raising the profitability of investment) and more investable funds (by letting companies keep more of their earnings).
|
|
Let us suppose, for the moment, that a successful supply-side tax cut is enacted. Be- |
||
|
|
cause both aggregate demand and aggregate supply increase simultaneously, the economy |
||
|
|
may be able to avoid the inflationary consequences of an expansionary fiscal policy |
||
|
|
shown in Figure 4 (page 228). |
||
|
|
Figure 6 illustrates this conclusion. The two aggregate demand curves and the initial ag- |
||
|
|
gregate supply curve S0S0 carry over directly from Figure 4. But now we have introduced |
||
|
|
|
an additional supply curve, S1S1, to reflect the successful sup- |
|
|
|
|
||
|
|
|
||
|
|
|
ply-side tax cut depicted in Figure 5. The equilibrium point for |
|
|
|
|
||
|
|
|
the economy moves from E to C, whereas with a conventional |
|
|
|
S0 |
demand-side tax cut it would have moved from E to A. As com- |
|
|
|
S1 |
pared with point A, which reflects only the demand-side effects |
|
|
|
|
of a tax cut, output is higher and prices are lower at point C. |
|
|
|
A |
A good deal, you say. And indeed it is. The supply-side ar- |
|
|
|
gument is extremely attractive in principle. The question is: |
||
|
|
C |
||
|
|
Does it work in practice? Can we actually do what is depicted |
||
|
|
E |
||
|
|
in Figure 6? Let us consider some of the difficulties. |
||
|
|
|
||
|
|
D1 |
Some Flies in the Ointment |
|
|
|
|
||
S1 |
D0 |
Critics of supply-side economics rarely question its goals or the |
||
Real GDP |
basic idea that lower taxes improve incentives. They argue, |
|||
instead, that supply-siders exaggerate the beneficial effects of |
||||
|
|
|
||
Copyright 2009 Cengage Learning, Inc. All Rights Reserved. May not be copied, scanned, or duplicated, in whole or in part.

LICENSED TO:
CHAPTER 11 |
Managing Aggregate Demand: Fiscal Policy |
231 |
tax cuts and ignore some undesirable side effects. Here is a brief rundown of some of their main objections.
Small Magnitude of Supply-Side Effects The first objection is that supply-siders are simply too optimistic: No one really knows how to do what Figure 5 shows. Although it is easy, for example, to design tax incentives that make saving more attractive financially, people may not actually respond to these incentives. In fact, most of the statistical evidence suggests that we should not expect much from tax incentives for saving. As the economist Charles Schultze once quipped: “There’s nothing wrong with supply-side economics that division by 10 couldn’t cure.”
 FIGURE 7
A More Pessimistic
View of Supply-Side
Tax Cuts
Demand-Side Effects |
The second objection is that supply- |
|
|
D1 |
siders ignore the effects of tax cuts on aggregate demand. If you |
|
|
S0 |
|
cut personal taxes, for example, individuals may possibly work |
D |
0 |
S1 |
|
more. But they will certainly spend more. |
|
|
||
|
|
|
||
The joint implications of these two objections appear in Figure 7. |
Level |
|
C |
|
This figure depicts a small outward shift of the aggregate supply |
|
E |
||
curve (which reflects the first objection) and a large outward shift of |
Price |
|
|
|
|
|
|
||
the aggregate demand curve (which reflects the second objection). |
|
|
|
|
The result is that the economy’s equilibrium moves from point E (the |
|
|
D1 |
|
intersection of S0S0 and D0D0) to point C (the intersection of S1S1 and |
|
|
||
S0 |
|
|||
D1D1). Prices rise as output expands. The outcome differs only a little |
|
S1 |
D0 |
|
from the straight “demand-side” fiscal stimulus depicted in Figure 4. |
|
|
||
|
|
|
||
Problems with Timing Investment incentives are the most promising type of supply-side tax cuts. But the benefits from greater
investment do not arrive by overnight mail. In particular, the expenditures on investment goods almost certainly come before any expansion of capacity. Thus, supply-side tax cuts have their primary short-run effects on aggregate demand. Effects on aggregate supply come later.
Effects on Income Distribution The preceding objections all pertain to the likely effects of supply-side policies on aggregate supply and demand. But a different problem bears mentioning: Most supply-side initiatives increase income inequality. Indeed, some tilt toward the rich is an almost inescapable corollary of supply-side logic. The basic aim of supply-side economics is to increase the incentives for working and investing—that is, to increase the gap between the rewards of those who succeed in the economic game (by working hard, investing well, or just plain being lucky) and those who fail. It can hardly be surprising, therefore, that supply-side policies tend to increase economic inequality.
Losses of Tax Revenue You can hardly help noticing that most of the policies suggested by supply-siders involve cutting one tax or another. Thus supply-side tax cuts are bound to raise the government budget deficit. This problem proved to be the Achilles’ heel of supply-side economics in the United States in the 1980s. The Reagan tax cuts left in their wake a legacy of budget deficits that took 15 years to overcome. Opponents argue that President George W. Bush’s tax cuts put us in a similar position: The tax cuts used up the budget surplus and turned it into a large deficit.
ISSUE: |
THE PARTISAN DEBATE ONCE MORE |
Several of the items on the preceding list played prominent roles in the 2008 presidential campaign. Democrats argued that the Bush tax cuts had very small supplyside incentive effects, were unfair because they went mainly to the well-to-do, and were the primary cause of the large budgets deficits that emerged in 2002. Republicans countered that the tax cuts substantially improved the economy’s growth, that it was fair to give the largest tax cuts to those who pay the highest taxes, and that
the Bush tax cuts were not the major cause of the budget deficit—which they blamed on the 2001 recession and the spending required after September 11, 2001.
Copyright 2009 Cengage Learning, Inc. All Rights Reserved. May not be copied, scanned, or duplicated, in whole or in part.

LICENSED TO:
232 |
PART 3 |
Fiscal and Monetary Policy |
Supply-Side Economics and Presidential Elections
As we have mentioned, Ronald Reagan won landslide victories in 1980 and 1984 by running on a supply-side platform. But in 1992, candidate Bill Clinton attacked supply-side economics as “trickle-down economics,” arguing that it had failed. He emphasized two of the drawbacks of such a fiscal policy: the effects on income inequality and on the budget deficit. The voters apparently agreed with him.
The hallmark of Clintonomics was, first, reducing the budget deficit that Clinton had inherited from the first President George Bush, and second, building up a large surplus. This policy succeeded—for a while. The huge budget deficit turned into a large surplus, the economy boomed, and Clinton, like Reagan before him, was reelected easily.
Then, in the 2000 presidential election, the voters once again switched their allegiance. During that campaign, Democratic candidate Al Gore promised to continue the “fiscal responsibility” of the Clinton years, while Republican candidate George W. Bush echoed Reagan by offering large tax cuts. Bush won in what was virtually a dead heat. Then, in 2004, John Kerry ran against the incumbent George Bush on what amounted to a promise to roll back some of the Bush tax cuts and return to Clintonomics. Bush won again.
In 2008, the very same issue was on the agenda again. The Democrats wanted to repeal most of the Bush tax cuts because, they argued, the government needs the tax revenue. But John McCain wanted to make the tax cuts permanent features of the code.
So which approach do American voters prefer? They appear to be fickle! But one thing is clear: The debate over fiscal policy played a major role in each of the last eight presidential elections.
Wahl-Stevens; (c) © Wally McNamee/CORBIS; |
|
(b) © AP Images/Greg |
Applewhite |
Images |
J. Scott |
(a) © AP |
Images / |
SOURCE: |
(d) © AP |
Toward an Assessment of Supply-Side Economics
On balance, most economists have reached the following conclusions about supply-side tax initiatives:
1.The likely effectiveness of supply-side tax cuts depends on what kinds of taxes are cut. Tax reductions aimed at stimulating business investment are likely to pack more punch than tax reductions aimed at getting people to work longer hours or to save more.
2.Such tax cuts probably will increase aggregate supply much more slowly than they increase aggregate demand. Thus, supply-side policies should not be regarded as a substitute for short-run stabilization policy, but, rather, as a way to promote (slightly) faster economic growth in the long run.
3.Demand-side effects of supply-side tax cuts are likely to overwhelm supply-side effects in the short run.
4.Supply-side tax cuts are likely to widen income inequalities.
5.Supply-side tax cuts are almost certain to lead to larger budget deficits.
Some people will look over this list and decide in favor of supply-side tax cuts; others, perusing the same facts, will reach the opposite conclusion. We cannot say that either group is wrong because, like almost every economic policy, supply-side economics has its pros and cons and involves value judgments that color people’s conclusions.
Copyright 2009 Cengage Learning, Inc. All Rights Reserved. May not be copied, scanned, or duplicated, in whole or in part.

LICENSED TO:
CHAPTER 11 |
Managing Aggregate Demand: Fiscal Policy |
233 |
Why, then, did so many economists and politicians react so negatively to supply-side economics as preached and practiced in the early 1980s? The main reason seems to be that the claims made by the most ardent supply-siders were clearly excessive. Naturally, these claims proved wrong. But showing that wild claims are wild does not eliminate the kernel of truth in supply-side economics: Reductions in marginal tax rates do improve economic incentives. Any specific supply-side tax cut must be judged on its individual merits.
| SUMMARY |
1.The government’s fiscal policy is its plan for managing aggregate demand through its spending and taxing programs. This policy is made jointly by the president and Congress.
2.Because consumer spending (C) depends on disposable income (DI), and DI is GDP minus taxes, any change in taxes will shift the consumption schedule on a 45° line diagram. Such shifts in the consumption schedule have multiplier effects on GDP.
3.The multiplier for changes in taxes is smaller than the multiplier for changes in government purchases because each $1 of tax cuts leads to less than $1 of increased consumer spending.
4.An income tax reduces the size of the multiplier.
5.Because an income tax reduces the multiplier, it reduces the economy’s sensitivity to shocks. It is therefore considered an automatic stabilizer.
6.Government transfer payments are like negative taxes, rather than like government purchases of goods and services, because they influence total spending only indirectly through their effect on consumption.
7.If the multipliers were known precisely, it would be possible to plan a variety of fiscal policies to eliminate either a recessionary gap or an inflationary gap. Recessionary
gaps can be cured by raising G or cutting T. Inflationary gaps can be cured by cutting G or raising T.
8.Active stabilization policy can be carried out either by means that tend to expand the size of government (by raising either G or T when appropriate) or by means that reduce the size of government (by reducing either G or T when appropriate).
9.Expansionary fiscal policy can mitigate recessions, but it also raises the budget deficit.
10.Expansionary fiscal policy also normally exacts a cost in terms of higher inflation. This last dilemma has led to a great deal of interest in “supply-side” tax cuts designed to stimulate aggregate supply.
11.Supply-side tax cuts aim to push the economy’s aggregate supply curve outward to the right. When successful, they can expand the economy and reduce inflation at the same time—a highly desirable outcome.
12.But critics point out at least five serious problems with supply-side tax cuts: They also stimulate aggregate demand; the beneficial effects on aggregate supply may be small; the demand-side effects occur before the supplyside effects; they make the income distribution more unequal; and large tax cuts lead to large budget deficits.
|
|
| KEY TERMS |
| |
Fiscal policy |
221 |
Automatic stabilizer 225 |
Supply-side tax cuts 229 |
Effect of income taxes on the |
|
|
|
multiplier |
224 |
|
|
Copyright 2009 Cengage Learning, Inc. All Rights Reserved. May not be copied, scanned, or duplicated, in whole or in part.

LICENSED TO:
234 |
PART 3 |
Fiscal and Monetary Policy |
| TEST YOURSELF |
1.Consider an economy in which tax collections are always $400 and in which the four components of aggregate demand are as follows:
|
GDP |
Taxes |
DI |
C |
I |
G |
(X 2 IM) |
|
|
$1,360 |
$400 |
$960 |
$720 |
$200 |
$500 |
$30 |
|
|
1,480 |
400 |
1,080 |
810 |
200 |
500 |
30 |
|
|
1,600 |
400 |
1,200 |
900 |
200 |
500 |
30 |
|
|
1,720 |
400 |
1,320 |
990 |
200 |
500 |
30 |
|
1,840 |
400 |
1,440 |
1,080 |
200 |
500 |
30 |
|
|
|
|
|
|
|
|
|
|
|
|
|
|
|
|
|
|
|
|
Find the equilibrium of this economy graphically. What is the marginal propensity to consume? What is the multiplier? What would happen to equilibrium GDP if government purchases were reduced by $60 and the price level remained unchanged?
2.Consider an economy similar to that in the preceding question in which investment is also $200, government purchases are also $500, net exports are also $30, and the price level is also fixed. But taxes now vary with income and, as a result, the consumption schedule looks like the following:
|
GDP |
Taxes |
DI |
C |
|
|
$1,360 |
$320 |
$1,040 |
$810 |
|
|
1,480 |
360 |
1,120 |
870 |
|
|
1,600 |
400 |
1,200 |
930 |
|
|
1,720 |
440 |
1,280 |
990 |
|
1,840 |
480 |
1,360 |
1,050 |
|
|
|
|
|
|
|
|
|
|
|
|
|
|
Find the equilibrium graphically. What is the marginal propensity to consume? What is the tax rate? Use your diagram to show the effect of a decrease of $60 in government purchases. What is the multiplier? Compare this answer to your answer to Test Yourself Question 1 above. What do you conclude?
3.Return to the hypothetical economy in Test Yourself Question 1, and now suppose that both taxes and government purchases are increased by $120. Find the new equilibrium under the assumption that consumer spending continues to be exactly three-quarters of disposable income (as it is in Test Yourself Question 1).
4.Suppose you are put in charge of fiscal policy for the economy described in Test Yourself Question 1. There is an inflationary gap, and you want to reduce income by $120. What specific actions can you take to achieve this goal?
5.Now put yourself in charge of the economy in Test Yourself Question 2, and suppose that full employment comes at a GDP of $1,840. How can you push income up to that level?
| DISCUSSION QUESTIONS |
1.The federal budget for national defense has increased substantially to pay for the Iraq war. How would GDP in the United States have been affected if this higher defense spending led to
a.larger budget deficits?
b.less spending elsewhere in the budget, so that total government purchases remained the same?
2.Explain why G has the same multiplier as I, but taxes have a different multiplier.
3.If the government decides that aggregate demand is excessive and is causing inflation, what options are open to it? What if the government decides that aggregate demand is too weak instead?
4.Which of the proposed supply-side tax cuts appeals to you most? Draw up a list of arguments for and against enacting such a cut right now.
5.(More difficult) Advocates of lower taxes on capital gains argue that this type of tax cut will raise aggregate supply by spurring business investment. Compare the effects on investment, aggregate supply, and tax revenues of three different ways to cut the capital gains tax:
a.Reduce capital gains taxes on all investments, including those that were made before tax rates were cut.
b.Reduce capital gains taxes only on investments made after tax rates are cut.
c.Reduce capital gains taxes only on certain types of investments, such as corporate stocks and bonds.
Which of the three options seems most desirable to you? Why?
Copyright 2009 Cengage Learning, Inc. All Rights Reserved. May not be copied, scanned, or duplicated, in whole or in part.
LICENSED TO:
CHAPTER 11 |
Managing Aggregate Demand: Fiscal Policy |
235 |
| APPENDIX A | Graphical Treatment of Taxes and Fiscal Policy
Most of the taxes collected by the U.S. government— indeed, by all national governments—rise and fall with GDP. In some cases, the reason is obvious: Personal and corporate income-tax collections, for example, depend on how much income there is to be taxed. Sales tax receipts depend on GDP because consumer spending is higher when GDP is higher. However, other types of tax receipts—such as property taxes— do not vary with GDP. We call the first kind of tax variable taxes and the second kind fixed taxes.
This distinction is important because it governs how the consumption schedule shifts in response to a tax change. If a fixed tax is increased, disposable income falls by the same amount regardless of the level of GDP. Hence, the decline in consumer spending is the same at every income level. In other words, the C schedule shifts downward in a parallel manner, as was depicted in Figure 1 in the chapter (page 223).
But many tax policies actually change disposable income by larger amounts when incomes are higher. That is true, for example, whenever Congress alters the tax rates imposed by the personal income tax, as it did in 2001 and 2003. Because higher tax rates decrease disposable income more when GDP is higher, the C schedule shifts down more sharply at higher income levels than at lower ones, as depicted in Figure 8. The same relationships apply for tax decreases, as the upward shift in the figure shows.
 FIGURE 8
How Variable Taxes Shift the Consumption Schedule
|
Variable tax cut |
Spending |
C |
|
|
Real Consumer |
Variable tax |
increase |
|
|
|
|
Real GDP |
Figure 9 illustrates the second reason why the distinction between fixed and variable taxes is important. This diagram shows two different consumption lines. C1 is the consumption schedule used in previous chapters; it reflects the assumption that tax collections are the same regardless of GDP. C2 depicts a more realistic
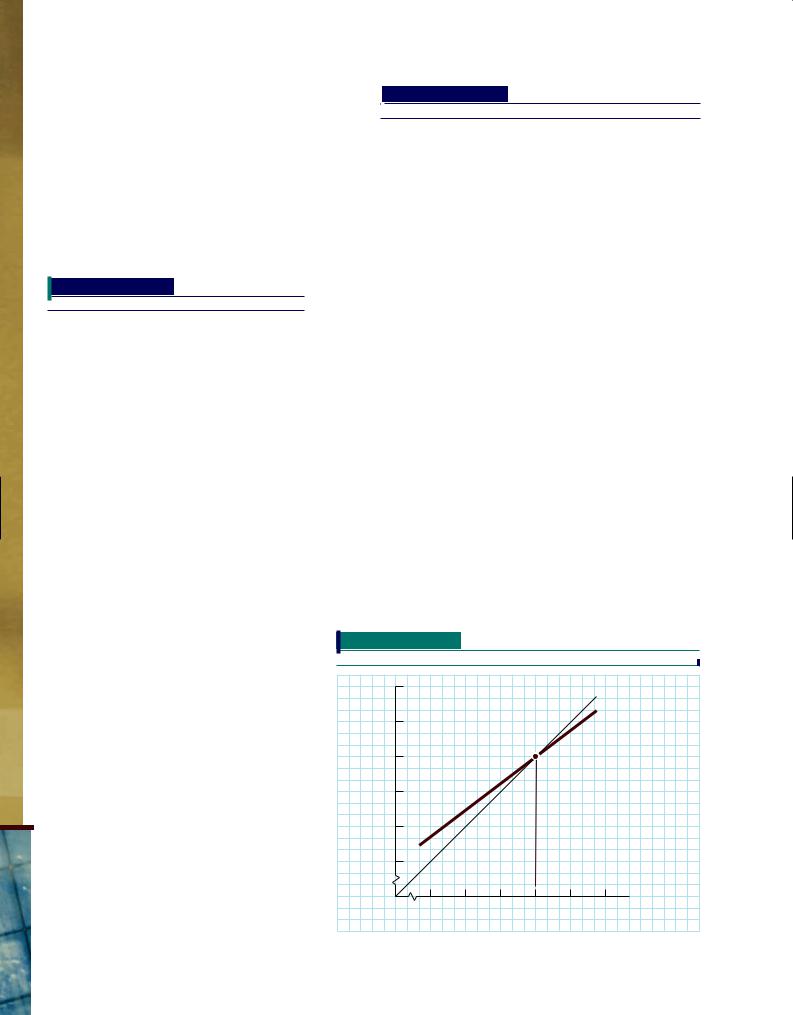
FIGURE 9
The Consumption Schedule with Fixed versus
Variable Taxes
|
C1 |
Real Consumer Spending |
C2 |
|
|
|
Real GDP |
case in which the government collects taxes equal to 20 percent of GDP. Notice that C2 is flatter than C1. This is no accident. In fact, as pointed out in the chapter:
Variable taxes such as the income tax flatten the consumption schedule in a 45° line diagram.
We can easily understand why. Column (1) of Table 1 shows alternative values of GDP ranging from $4.5 trillion to $7.5 trillion. Column (2) then indicates that taxes are always one-fifth of this amount. Column (3) subtracts column (2) from column (1) to arrive at disposable income (DI). Column (4) then gives the amount of consumer spending corresponding to each level of DI. The schedule relating C to Y, which we need for our 45° line diagram, is therefore found in columns (1) and (4).
 TABLE 1
The Effects of an Income Tax on the
Consumption Schedule
(1) |
(2) |
(3) |
(4) |
|
|
|
Gross |
|
Disposable |
|
|
|
Domestic |
|
Income |
|
|
|
Product |
Taxes |
(GDP minus Taxes) |
Consumption |
|
|
$4,500 |
$ 900 |
$3,600 |
$3,000 |
|
|
5,000 |
1,000 |
4,000 |
3,300 |
|
|
5,500 |
1,100 |
4,400 |
3,600 |
|
|
6,000 |
1,200 |
4,800 |
3,900 |
|
|
6,500 |
1,300 |
5,200 |
4,200 |
|
|
7,000 |
1,400 |
5,600 |
4,500 |
|
7,500 |
1,500 |
6,000 |
4,800 |
|
|
|
|
|
|
|
|
|
|
|
|
|
|
NOTE: Figures are in billions of dollars per year.
Notice that each $500 billion increase in GDP in Table 1 leads to a $300 billion rise in consumer spending. Thus, the slope of line C2 in Figure 9 is $300/$500, or 0.60, as we observed in the chapter. But in our
Copyright 2009 Cengage Learning, Inc. All Rights Reserved. May not be copied, scanned, or duplicated, in whole or in part.
LICENSED TO:
236 |
PART 3 |
Fiscal and Monetary Policy |
earlier example in Chapter 9, consumption rose by $300 billion each time GDP increased $400 billion— making the slope $300/$400, or 0.75. (See the steeper line C1 in Figure 9.) Table 2 compares the two cases explicitly. In the Chapter 9 example, taxes were fixed at $1,200 billion and each $400 billion rise in Y led to a $300 billion rise in C—as in the left-hand panel of Table 2. But now, with taxes variable (equal to 20 percent of GDP), each $500 billion increment to Y gives rise to a $300 billion increase in C—as in the righthand panel of Table 2.
TABLE 2
The Relationship between Consumption and GDP
 TABLE 3
Total Expenditure Schedule with a 20 Percent Income Tax
(1) |
(2) |
(3) |
(4) |
(5) |
(6) |
|
|
|
Gross |
|
|
|
|
Total |
|
|
Domestic |
|
|
Government |
|
Expenditures |
|
|
Product |
Consumption |
Investment |
Purchases |
Net Exports |
C 1 I 1 G 1 |
|
|
Y |
C |
I |
G |
(X 2 IM) |
(X 2 IM) |
|
|
$4,500 |
$3,000 |
$900 |
$1,300 2$100 |
$5,100 |
|
|
|
5,000 |
3,300 |
900 |
1,300 |
2100 |
5,400 |
|
|
5,500 |
3,600 |
900 |
1,300 |
2100 |
5,700 |
|
|
6,000 |
3,900 |
900 |
1,300 |
2100 |
6,000 |
|
|
6,500 |
4,200 |
900 |
1,300 |
2100 |
6,300 |
|
|
7,000 |
4,500 |
900 |
1,300 |
2100 |
6,600 |
|
7,500 |
4,800 |
900 |
1,300 |
2100 |
6,900 |
|
|
|
|
|
|
|
|
|
|
|
|
|
|
|
|
|
|
|
With Fixed Taxes |
With a 20 Percent |
|||
|
(T 5 |
$1,200) |
Income Tax |
||
|
(from Table 1, Chapter 9) |
(from Table 1) |
|||
|
Y |
C |
Y |
C |
|
|
$4,800 |
$3,000 |
$4,500 |
$3,000 |
|
|
5,200 |
3,300 |
5,000 |
3,300 |
|
|
5,600 |
3,600 |
5,500 |
3,600 |
|
|
6,000 |
3,900 |
6,000 |
3,900 |
|
|
6,400 |
4,200 |
6,500 |
4,200 |
|
|
6,800 |
4,500 |
7,000 |
4,500 |
|
|
7,200 |
4,800 |
7,500 |
4,800 |
|
|
Line C1 in Figure 9 |
Line C2 in Figure 9 |
|||
|
|
|
|
|
|
previous chapters, full employment may occur above or below Y 5 $6,000 billion. If it is below this level, an inflationary gap arises. Prices will probably start to rise, pulling the expenditure schedule down and reducing equilibrium GDP. If it is above this level, a recessionary gap results, and history suggests that prices will fall only slowly. In the interim, the economy will suffer a period of high unemployment.
In short, once we adjust the expenditure schedule for variable taxes, the determination of national income proceeds exactly as before. The effects of government spending and taxation, therefore, are fairly straightforward and can be summarized as follows:
These differences sound terribly mechanical, but the economic reasoning behind them is vital to understanding tax policies. When taxes are fixed, as in line C1, each additional dollar of GDP raises disposable income (DI) by $1. Consumer spending then rises by $1 times the marginal propensity to consume (MPC), which is 0.75 in our example. Hence, each additional dollar of GDP leads to 75 cents more spending. But when taxes vary with income,
each additional dollar of GDP raises DI by less than $1 because the government takes a share in taxes. In our example, taxes are 20 percent of GDP, so each additional $1 of GDP generates just 80 cents more DI. With an MPC of 0.75, then, spending rises by only 60 cents (75 percent of 80 cents) each time GDP rises by $1. Thus, the slope of line C2 in Figure 9 is only 0.60, instead of 0.75.
Table 3 and Figure 10 take the next step by replacing the old consumption schedule with this new one in both the tabular presentation of income determination and the 45o line diagram. We see immediately that the equilibrium level of GDP is at point E. Here gross domestic product is $6,000 billion, consumption is $3,900 billion, investment is $900 billion, net exports are 2$100 billion, and government purchases are $1,300 billion. As we know from
Government purchases of goods and services add to total spending directly through the G component of C 1 I 1 G 1 (X 2 IM). Higher taxes reduce total spending indirectly by lowering disposable income and thus reducing the C component of C 1 I 1 G 1 (X 2 IM). On balance, then, the government’s actions may raise or
45°
C + I + G + (X – IM )
E
4,000 |
6,000 |
8,000 |
Real GDP
Copyright 2009 Cengage Learning, Inc. All Rights Reserved. May not be copied, scanned, or duplicated, in whole or in part.