

UNCTAD-WIR2012-Full-en
.pdfREGIONAL
TRENDS IN FDI
CHAPTER II
Salient features of 2011 FDI trends by region include the following:
•Sub-Saharan Africa drew FDI not only to its natural resources, but also to its emerging consumer markets as the growth outlook remained positive. Political uncertainty in North Africa deterred investment in that region.
•FDI inflows reached new record levels in both East Asia and South-East Asia, while the latter is catching up with the former through higher FDI growth.
•FDI inflows to South Asia turned around as a result of higher inflows to India, the dominant FDI recipient in the region.
•Regional and global crises still weigh on FDI in West Asia, and prospects remain unclear.
•South America was the main driver of FDI growth in Latin America and the Caribbean. The pattern of investment by traditional investors – Europe and the United States – is changing, while there has been an advance in FDI from developing countries and Japan. A recent shift towards industrial policy in major countries may lead to investment flows to targeted industries.
•FDI flows to economies in transition recovered strongly. They are expected to grow further, partly because of the accession of the Russian Federation to the World Trade Organization (WTO).
•The search for energy and mineral resources resulted in cross-border megadeals in developed countries, but the eurozone crisis and a generally weak outlook still cloud investor sentiment.
•FDI inflows to the structurally weak, vulnerable and small economies were mixed. While FDI to landlocked developing countries (LLDCs) grew strongly, inflows to least developed countries (LDCs) and small island developing States (SIDS) continued to fall.

38 |
World Investment Report 2012: Towards a New Generation of Investment Policies |
|
|
INTRODUCTION
In 2011, FDI inflows increased in all major economic groups − developed, developing and transition economies (table II.1). Developing countries accounted for 45 per cent of global FDI inflows in 2011. The increase was driven by East and SouthEast Asia and Latin America. East and South-East Asia still accounted for almost half of FDI in developing economies. Inflows to the transition economies of South-East Europe, the Commonwealth of Independent States (CIS) and Georgia accounted for another 6 per cent of the global total.
The rise in FDI outflows was driven mainly by the growth of FDI from developed countries.
The growth in outflows from developing economies seen in the past several years appeared to lose some momentum in 2011 because of significant declines in flows from Latin America and the Caribbean and a slowdown in the growth of investments from developing Asia (excluding West Asia).
FDI inflows to the structurally weak, vulnerable and small economies bounced back from $42.2 billion in 2010 to $46.7 billion in 2011, owing to the strong growth in FDI to LLDCs (table II.1). However, the improvement in their share was hardly visible, as FDI inflows to both LDCs and SIDS continued to fall.
Table II.1. FDI flows, by region, 2009–2011
(Billions of dollars and per cent)
Region |
|
FDI inflows |
|
|
|
FDI outflows |
|
|
2009 |
2010 |
2011 |
2009 |
2010 |
2011 |
|||
|
||||||||
World |
1 197.8 |
1 309.0 |
1 524.4 |
1 175.1 |
1 451.4 |
1 694.4 |
||
Developed economies |
606.2 |
618.6 |
747.9 |
857.8 |
989.6 |
1 237.5 |
||
Developing economies |
519.2 |
616.7 |
684.4 |
268.5 |
400.1 |
383.8 |
||
Africa |
52.6 |
43.1 |
42.7 |
3.2 |
7.0 |
3.5 |
||
East and South-East Asia |
206.6 |
294.1 |
335.5 |
176.6 |
243.0 |
239.9 |
||
South Asia |
42.4 |
31.7 |
38.9 |
16.4 |
13.6 |
15.2 |
||
West Asia |
66.3 |
58.2 |
48.7 |
17.9 |
16.4 |
25.4 |
||
Latin America and the Caribbean |
149.4 |
187.4 |
217.0 |
54.3 |
119.9 |
99.7 |
||
Transition economies |
72.4 |
73.8 |
92.2 |
48.8 |
61.6 |
73.1 |
||
Structurally weak, vulnerable and small economiesa |
45.2 |
42.2 |
46.7 |
5.0 |
11.5 |
9.2 |
||
LDCs |
18.3 |
16.9 |
15.0 |
1.1 |
3.1 |
3.3 |
||
LLDCs |
28.0 |
28.2 |
34.8 |
4.0 |
9.3 |
6.5 |
||
SIDS |
4.4 |
4.2 |
4.1 |
0.3 |
0.3 |
0.6 |
||
Memorandum: percentage share in world FDI flows |
|
|
|
|
|
|
|
|
Developed economies |
50.6 |
47.3 |
49.1 |
73.0 |
68.2 |
73.0 |
||
Developing economies |
43.3 |
47.1 |
44.9 |
22.8 |
27.6 |
22.6 |
||
Africa |
4.4 |
3.3 |
2.8 |
0.3 |
0.5 |
0.2 |
||
East and South-East Asia |
17.2 |
22.5 |
22.0 |
15.0 |
16.7 |
14.2 |
||
South Asia |
3.5 |
2.4 |
2.6 |
1.4 |
0.9 |
0.9 |
||
West Asia |
5.5 |
4.4 |
3.2 |
1.5 |
1.1 |
1.5 |
||
Latin America and the Caribbean |
12.5 |
14.3 |
14.2 |
4.6 |
8.3 |
5.9 |
||
Transition economies |
6.0 |
5.6 |
6.0 |
4.2 |
4.2 |
4.3 |
||
Structurally weak, vulnerable and small economiesa |
3.8 |
3.2 |
3.1 |
0.4 |
0.8 |
0.5 |
||
LDCs |
1.5 |
1.3 |
1.0 |
0.1 |
0.2 |
0.2 |
||
LLDCs |
2.3 |
2.2 |
2.3 |
0.3 |
0.6 |
0.4 |
||
SIDS |
0.4 |
0.3 |
0.3 |
0.0 |
0.0 |
0.0 |
||
Source: UNCTAD, FDI/TNC database (www.unctad.org/fdistatistics). a Without double counting.
CHAPTER II Regional Trends in FDI |
39 |
|
|
A. REGIONAL TRENDS
1. Africa
Table A. Distribution of FDI flows among economies, by range,a 2011
|
Range |
Inflows |
Outflows |
|
|
Above |
Nigeria, South Africa |
.. |
|
|
$3.0 billion |
and Ghana |
||
|
|
|||
|
$2.0 to |
Congo, Algeria, Morocco, |
.. |
|
$2.9 billion |
Mozambique, Zambia |
|||
|
||||
|
|
Sudan, Chad, Democratic |
|
|
$1.0 to |
Republic of the Congo, Guinea, |
Angola, Zambia |
||
$1.9 billion |
Tunisia, United Republic |
|
||
|
|
of Tanzania, Niger |
|
|
$0.5 to |
Madagascar, Namibia, Uganda, |
|
||
Equatorial Guinea, Gabon, |
Egypt, Algeria |
|||
$0.9 billion |
||||
Botswana, Liberia |
|
|||
|
|
Zimbabwe, Cameroon, Côte |
|
|
|
|
d'Ivoire, Kenya, Senegal, |
|
|
$0.1 to |
Mauritius, Ethiopia, Mali, |
Liberia, Morocco, Libya |
||
$0.4 billion |
Seychelles, Benin, Central |
|||
|
||||
|
|
African Republic, Rwanda, |
|
|
|
|
Somalia |
|
|
|
|
Swaziland, Cape Verde, Djibouti, Democratic Republic of the Congo, Mauritius, |
||
|
|
Malawi, Togo, Lesotho, Sierra |
Gabon, Sudan, Senegal, Niger, Tunisia, Togo, |
|
Below |
Leone, Mauritania, Gambia, |
Zimbabwe, Kenya, Côte d'Ivoire, Seychelles, |
||
Guinea-Bissau, Eritrea, São |
Ghana, Guinea, Swaziland, Mauritania, Burkina |
|||
$0.1 billion |
||||
Tomé and Principe, Burkina |
Faso, Botswana, Benin, Mali, Guinea-Bissau, |
|||
|
|
Faso, Comoros, Burundi, Egypt, |
São Tomé and Principe, Cape Verde, Namibia, |
|
|
|
Angola |
Mozambique, Cameroon, South Africa, Nigeria |
|
a Economies are listed according to the magnitude of their FDI flows.
Figure A. FDI flows, top 5 host and home economies, 2010–2011
|
|
|
|
|
|
|
|
(Billions of dollars) |
|
|
|
|
|
|
|
||||||
|
|
|
|
|
(Host) |
|
|
|
|
|
|
|
(Home) |
|
|
|
|
||||
|
|
|
|
|
|
|
|
|
|
|
|
|
|
|
|
|
|
|
|
|
|
Nigeria |
|
|
|
|
|
|
|
|
|
|
|
Angola |
|
|
|
|
|
|
|
|
|
|
|
|
|
|
|
|
|
|
|
|
|
|
|
|
|
|
|
|
|
||
|
|
|
|
|
|
|
|
|
|
|
|
|
|
|
|
|
|
|
|
||
South |
|
|
|
|
|
|
|
|
|
|
|
Zambia |
|
|
|
|
|
|
|
|
|
|
|
|
|
|
|
|
|
|
|
|
|
|
|
|
|
|
|
|
|
||
|
|
|
|
|
|
|
|
|
|
|
|
|
|
|
|
|
|
|
|
||
Africa |
|
|
|
|
|
|
|
|
|
|
|
|
|
|
|
|
|
|
|
|
|
|
|
|
|
|
|
|
|
|
|
|
|
|
|
|
|
|
|
|
|
|
|
Ghana |
|
|
|
|
|
|
|
|
|
|
|
Egypt |
|
|
|
|
|
|
|
|
|
|
|
|
|
|
|
|
|
|
|
|
|
|
|
|
|
|
|
|
|
||
Congo |
|
|
|
|
|
|
|
|
|
|
|
Algeria |
|
|
|
|
|
|
|
|
|
|
|
|
|
|
|
|
|
|
|
|
|
|
|
|
|
|
|
|
|
||
Algeria |
|
|
|
|
|
|
|
|
|
|
|
Liberia |
|
|
|
|
|
|
|
|
|
|
|
|
|
|
|
|
|
|
|
|
|
|
|
|
|
|
|
|
|
||
|
|
|
|
|
|
|
|
|
|
|
|
|
|
|
|
|
|
|
|
||
|
|
|
|
|
|
|
|
2011 |
2010 |
|
|
|
|
|
2011 |
2010 |
|
||||
|
|
|
|
|
|
|
|
|
|
|
|
|
|
|
|
||||||
|
|
|
|
|
|
|
|
|
|
|
|
|
|
|
|
|
|
|
|
|
|
0.0 |
1.0 |
2.0 |
3.0 |
4.0 |
5.0 |
6.0 |
7.0 |
8.0 |
9.0 |
10.0 |
0.0 |
0.2 |
0.4 |
0.6 |
0.8 |
1.0 |
1.2 |
1.4 |
1.6 |
||
|
|
|
|
|
|
|
|
|
|
|
|
|
|
|
|
|
|
|
|
|
|
|
|
|
Figure B. FDI inflows, 2005–2011 |
|
|
|
|
|
Figure C. FDI outflows, 2005–2011 |
|
|||||||||
|
|
|
|
(Billions of dollars) |
|
|
|
|
|
|
|
|
(Billions of dollars) |
|
|
||||
|
|
|
|
|
|
|
|
|
|
|
|
|
|
|
|
|
|
|
|
70 |
|
|
|
|
|
|
|
|
|
|
|
10 |
|
|
|
|
|
|
|
|
Central Africa |
Southern Africa |
West Africa |
|
|
|
|
|
|
|
|
|
|
|
|
|
|
||
60 |
East Africa |
|
North Africa |
|
|
|
|
|
|
|
8 |
|
|
|
|
|
|
|
|
50 |
|
|
|
|
|
|
|
|
|
|
|
6 |
|
|
|
|
|
|
|
40 |
|
|
|
|
|
|
|
|
|
|
|
4 |
|
|
|
|
|
|
|
30 |
|
|
|
|
|
|
|
|
|
|
|
2 |
|
|
|
|
|
|
|
20 |
|
|
|
|
|
|
|
|
|
|
|
0 |
|
|
|
|
|
|
|
|
|
|
|
|
|
|
|
|
|
|
|
|
|
|
|
|
|
||
10 |
|
|
|
|
|
|
|
|
|
|
|
- 2 |
Central Africa |
Southern Africa |
West Africa |
|
|
|
|
|
|
|
|
|
|
|
|
|
|
|
|
|
|
|
|
||||
0 |
|
|
|
|
|
|
|
|
|
|
|
- 4 |
East Africa |
North Africa |
|
|
|
|
|
|
2005 |
|
2006 |
2007 |
2008 |
2009 |
2010 |
2011 |
|
|
|
|
2005 |
2006 |
2007 |
2008 |
2009 |
2010 |
2011 |
|
|
|
|
|
|
|
|
|
|
|
|
|
|
|
|
|
|
|
|
|
3.1 |
|
2.5 |
2.6 |
3.2 |
4.4 |
3.3 |
2.8 |
Share in |
|
0.2 |
0.6 |
0.4 |
0.4 |
0.3 |
0.5 |
0.2 |
||
|
|
|
|
|
|
|
|
|
world total |
|
|
|
|
|
|
|
|
||
Table B. Cross-border M&As by industry, 2010–2011
(Millions of dollars)
Sector/industry |
Sales |
|
|
Purchases |
||
2010 |
2011 |
2010 |
2011 |
|||
|
||||||
Total |
8 072 |
7 205 |
3 309 |
4 812 |
||
Primary |
2 516 |
1 664 |
- 28 |
- 22 |
||
Mining, quarrying and petroleum |
2 516 |
1 595 |
- 28 |
- 22 |
||
Manufacturing |
303 |
1 922 |
404 |
4 393 |
||
Food, beverages and tobacco |
263 |
1 026 |
2 |
15 |
||
Chemicals and chemical products |
5 |
155 |
- 15 |
810 |
||
Metals and metal products |
32 |
286 |
- |
- |
||
Electrical and electronic equipment |
- 9 |
470 |
- |
- |
||
Services |
5 253 |
3 619 |
2 933 |
441 |
||
Trade |
84 |
2 161 |
- 49 |
- 181 |
||
Transport, storage and communications |
1 912 |
489 |
- |
- 10 |
||
Finance |
134 |
910 |
2 547 |
674 |
||
Business services |
2 994 |
149 |
436 |
37 |
||
Table C. Cross-border M&As by region/country, 2010–2011
(Millions of dollars)
Region/country |
Sales |
|
|
Purchases |
||
2010 |
2011 |
2010 |
2011 |
|||
|
||||||
World |
8 072 |
7 205 |
3 309 |
4 812 |
||
Developed economies |
6 722 |
4 308 |
1 371 |
4 265 |
||
European Union |
1 838 |
2 528 |
1 240 |
1 987 |
||
United States |
1 931 |
1 408 |
45 |
41 |
||
Japan |
3 199 |
649 |
- |
- |
||
Other developed countries |
- 246 |
- 278 |
86 |
2 236 |
||
Developing economies |
1 048 |
2 865 |
1 550 |
547 |
||
Africa |
365 |
408 |
365 |
408 |
||
East and South-East Asia |
499 |
1 679 |
257 |
- 78 |
||
South Asia |
10 922 |
318 |
38 |
217 |
||
West Asia |
- 10 653 |
464 |
965 |
- |
||
Latin America and the Caribbean |
- 84 |
- 5 |
- 75 |
- |
||
Transition economies |
51 |
- 130 |
388 |
- |
||
Table D. Greenfield FDI projects by industry, 2010–2011
(Millions of dollars)
Sector/industry |
Africa as destination |
Africa as investors |
|||
2010 |
2011 |
2010 |
2011 |
||
|
|||||
Total |
88 918 |
82 315 |
16 662 |
16 551 |
|
Primary |
20 237 |
22 824 |
1 246 |
4 640 |
|
Mining, quarrying and petroleum |
20 237 |
22 824 |
1 246 |
4 640 |
|
Manufacturing |
39 506 |
31 205 |
7 506 |
4 798 |
|
Food, beverages and tobacco |
1 888 |
5 185 |
175 |
628 |
|
Coke, petroleum and nuclear fuel |
23 235 |
9 793 |
5 684 |
2 212 |
|
Metals and metal products |
2 093 |
5 185 |
429 |
9 |
|
Motor vehicles and other transport equipment |
2 568 |
3 118 |
99 |
- |
|
Services |
29 175 |
28 286 |
7 910 |
7 113 |
|
Electricity, gas and water |
5 432 |
10 477 |
899 |
1 441 |
|
Construction |
7 630 |
3 303 |
- |
1 223 |
|
Transport, storage and communications |
6 381 |
5 345 |
2 627 |
68 |
|
Business services |
5 429 |
5 619 |
1 274 |
2 282 |
|
Table E. Greenfield FDI projects by region/country, 2010–2011
(Millions of dollars)
Partner region/economy |
Africa as destination |
|
Africa as investors |
|||
2010 |
2011 |
2010 |
2011 |
|||
|
||||||
World |
88 918 |
82 315 |
16 662 |
16 551 |
||
Developed economies |
48 554 |
38 939 |
1 192 |
487 |
||
European Union |
32 095 |
23 633 |
373 |
182 |
||
United States |
5 507 |
6 627 |
49 |
259 |
||
Japan |
473 |
1 299 |
- |
- |
||
Other developed countries |
10 479 |
7 380 |
769 |
45 |
||
Developing economies |
37 752 |
42 649 |
15 462 |
16 064 |
||
Africa |
12 226 |
10 368 |
12 226 |
10 368 |
||
East and South-East Asia |
9 929 |
12 357 |
141 |
400 |
||
South Asia |
4 890 |
11 113 |
75 |
980 |
||
West Asia |
9 897 |
7 038 |
2 517 |
150 |
||
Latin America and the Caribbean |
809 |
1 774 |
503 |
1 167 |
||
Transition economies |
2 612 |
727 |
8 |
- |
||

40 |
World Investment Report 2012: Towards a New Generation of Investment Policies |
|
|
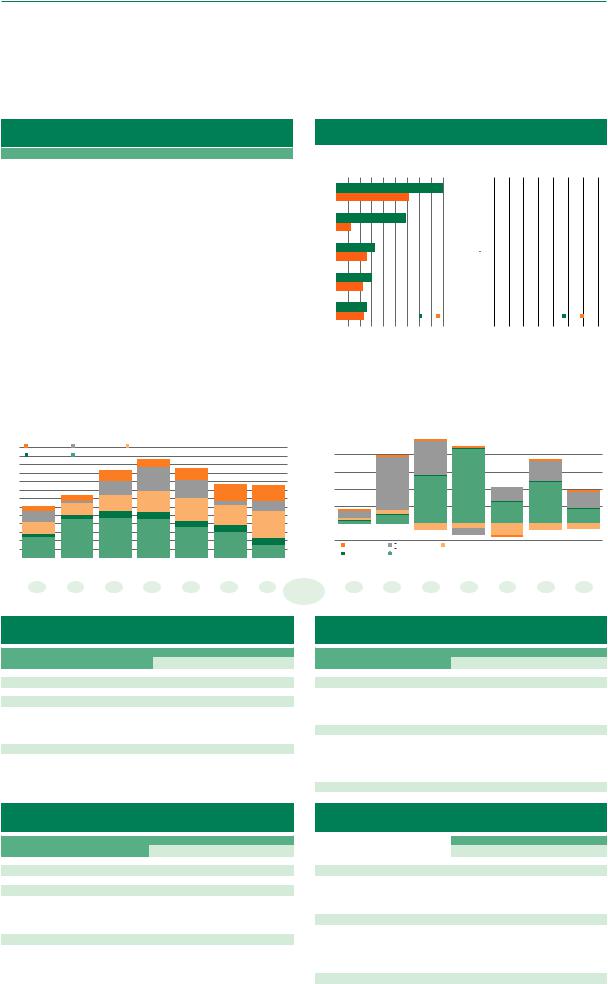
Continued fall in FDI inflows to Africa but some cause for optimism. FDI flows to Africa were at $42.7 billion in 2011, marking a third successive year of decline, although the decline is marginal (figure B). Both cross-border mergers and acquisitions (M&As) (tables B and C) and greenfield investments by foreign transnational corporations (TNCs) (tables D and E) decreased. In terms of share in global FDI flows, the continent’s position diminished from 3.3 per cent in 2010 to 2.8 per cent in 2011 (figure B). FDI to Africa from developed countries fell sharply, leaving developing and transition economies to increase their share in inward FDI to the continent (in the case of greenfield investment projects, from 45 per cent in 2010 to 53 per cent in 2011; table E).
However, this picture of an overall declining trend in FDI does not reflect the situation across all parts of the continent. The negative growth for the continent as a whole was driven in large part by reduced flows to North Africa caused by political unrest and by a small number of other exceptions to a generally more positive trend. Inflows to sub-Saharan Africa1 recovered from $29.5 billion in 2010 to $36.9 billion in 2011, a level comparable with the peak in 2008 ($37.3 billion).
North Africa has traditionally been the recipient of about one third of inward FDI to the continent. Inflows in 2011 halved, to $7.69 billion, and those to the two major recipient countries, Egypt and Libya, were negligible. Outward FDI from North Africa also fell sharply in 2011 to $1.75 billion, compared with $4.85 billion in 2010. These figures are in stark contrast with the peak of 2008 when the outward FDI of North African countries reached $8.75 billion.
Flows to West Africa were destined primarily for Ghana and Nigeria, which together accounted for some three quarters of the subregion’s inflows. Guinea emerged with one of the strongest gains in FDI growth in 2011, a trend that is likely to continue in the next few years in view of the $6 billion that State-owned China Power Investment Corporation plans to invest in bauxite and alumina projects. Overall, inward FDI flows to West Africa expanded by 36 per cent, to $16.1 billion.
The bulk of FDI in Central Africa goes to three commodity-rich countries: the primarily oil-export- ing Congo and Equatorial Guinea and the mineralexporting Democratic Republic of the Congo.
Although inward FDI flows to Congo grew strongly in 2011, weak inflows to the Democratic Republic of the Congo affected the region as a whole and resulted in inward investment flows to Central Africa falling by 10.2 per cent overall to $8.53 billion.
Inward FDI to Southern Africa, recovered from a 78 per cent decline in 2010, more than doubling its total to $6.37 billion. This reversal was precipitated primarily by the sharp rebound of flows to South Africa, the region’s largest FDI recipient. Inflows to Angola, however, declined by over $2 billion.
East Africa, with historically the lowest FDI inflows in sub-Saharan Africa, reversed the downward trend of 2009–2010 to reach $3.96 billion, a level just 5 per cent below the peak of 2008. As most countries in this subregion have not been considered rich in natural resources, they have not traditionally attracted large investments into exportoriented production in the primary sector, except in agriculture. However, the discovery of gas fields is likely to change this pattern significantly.
New oiland gas-producing countries are emerging as major recipients of FDI. Oil production in subSaharan Africa has been dominated by the two principal producer countries, Angola and Nigeria. Nigeria was Africa’s largest recipient of FDI flows ($8.92 billion) in 2011, accounting for over one fifth of all flows to the continent. In gross terms, Angola attracted FDI inflows worth $10.5 billion, although in net terms, divestments and repatriated income left its inflows at -$5.59 billion.
Aside from these major oil-producing countries, investors are looking farther afield in search of oil and gas reserves. Ghana, in particular, benefited from FDI in the newly developed Jubilee oil field, where commercial production started in December 2010. Elsewhere, Tullow Oil (United Kingdom) announced its plan to invest $2.0 billion to establish an oil refinery in Uganda. Noble Energy (United States) also announced plans to invest $1.6 billion to set up production wells and a processing platform in Equatorial Guinea. Inward FDI flows to Uganda and Equatorial Guinea were $792 million and $737 million respectively in 2011, but announced greenfield projects show future investments of $6.1 billion in Uganda and $4.8 billion in Equatorial Guinea, indicating strong FDI growth in these countries.

CHAPTER II Regional Trends in FDI |
41 |
|
|
If oil reserves off the Atlantic coast of Africa have drawn significant FDI to that region, natural gas reserves in East Africa, especially the offshore fields of Mozambique and the United Republic of Tanzania, hold equal promise. In 2011, inflows of FDI to Mozambique doubled from the previous year, to $2.09 billion. New discoveries of large-scale gas reserves continue to be made in 2012. Development of gas fields and the liquefied natural gas (LNG) industry will require huge upfront investments and presents considerable technological challenges. FDI is certain to play a large role in developing this industry in the region, as exemplified by the plans announced by Eni (Italy) to invest $50 billion to develop the gas fields recently discovered in Mozambique.
Sectoral shift emerging, especially towards services. The limited volume of FDI to Africa tends to make inflows vary widely from year to year. Nevertheless, viewed over a longer time period, a discernible sectoral shift is taking place in FDI to Africa. Data on greenfield projects by three-year periods show that, contrary to popular perceptions, the relative importance of the primary sector is declining, although the total value of projects is holding steady (figure II.1).
The data on projects in services in the period 2006–2008 are inflated by the announcements of no fewer than 13 construction projects worth more than $3 billion each, which take many years to complete. Still, a general ascendancy of the services sector is clear. Aside from the construction industry, projects are drawn into industries such as electric, gas and water distribution, and transport,
storage and communications in the services sector and industries such as coke, petroleum products and nuclear fuel in the manufacturing sector.
This shift is more about diversification of natural- resource-related activities than a decline of the extractive industry. Many of the projects in manufacturing and services are premised on the availability of natural resources or play a supporting role for the extractive industry. Such projects include a $15 billion project by Western Goldfields (Canada) to construct a coal-fired power station in Nigeria and an $8 billion project by Klesch & Company (United Kingdom) to build an oil refinery in Libya, both announced in 2008.
Better prospects for 2012. The region’s prospects for FDI in 2012 are promising, as strong economic growth, ongoing economic reforms and high commodity prices have improved investor perceptions of the continent. Relatively high profitability of FDI in the continent is another factor. Data on the profitability of United States FDI (FDI income as a share of FDI stock) show a 20 per cent return in Africa in 2010, compared with 14 per cent in Latin America and the Caribbean and 15 per cent in Asia (United States Department of Commerce, 2011: 51). In addition to traditional patterns of FDI to the extractive industries, the emergence of a middle class is fostering the growth of FDI in services such as banking, retail and telecommunications. UNCTAD’s forecast of FDI inflows also points to this pattern (figure I.10). It is especially likely if investor confidence begins to return to North Africa and compensates for the recent declines in this region.
Figure II.1. Value of greenfield investments in Africa, by sector, 2003–2011
(Billions of dollars)
500 |
Services |
|
|
450 |
|
|
|
Manufacturing |
|
|
|
400 |
|
|
|
Primary |
|
|
|
350 |
|
|
|
|
|
|
|
300 |
|
|
|
250 |
|
|
|
200 |
|
|
|
150 |
|
|
|
100 |
|
|
|
50 |
|
|
|
0 |
2003–2005 |
2006–2008 |
2009–2011 |
|
Source: UNCTAD, based on data from Financial Times Ltd, fDi Markets (www.fDimarkets.com).

42 |
World Investment Report 2012: Towards a New Generation of Investment Policies |
|
|
2. East and South-East Asia
Table A. Distribution of FDI flows among economies, by range,a 2011
Range |
Inflows |
Outflows |
|
Above $50 |
China, Hong Kong (China), |
Hong Kong (China), China |
|
billion |
Singapore |
||
|
|||
|
|
|
|
$10 to $49 |
|
Singapore, Republic of Korea, |
|
Indonesia, Malaysia |
Malaysia, Taiwan Province of China, |
||
billion |
|||
|
Thailand |
||
|
|
||
|
|
|
|
$1.0 to $9.9 |
Viet Nam, Thailand, Mongolia, |
|
|
billion |
Republic of Korea, Macao (China), |
Indonesia, Viet Nam |
|
Philippines, Brunei Darussalam |
|
||
|
|
||
|
|
|
|
$0.1 to $0.9 |
Cambodia, Myanmar, Lao People's |
.. |
|
billion |
Democratic Republic |
||
|
|||
|
|
|
|
Below $0.1 |
Democratic People's Republic of |
Mongolia, Macao (China), Cambodia, |
|
Korea, Timor-Leste, Taiwan Province |
Brunei Darussalam, Philippines, Lao |
||
billion |
|||
of China |
People's Democratic Republic |
||
|
a Economies are listed according to the magnitude of their FDI flows.
Figure A. FDI flows, top 5 host and home economies, 2010–2011
|
|
|
|
|
(Billions of dollars) |
|
|
|
|
|
|
|
|
|
|||||
|
|
|
(Host) |
|
|
|
|
|
|
|
(Home) |
|
|
|
|
|
|
||
|
|
|
|
|
|
|
|
|
|
|
|
|
|
|
|
|
|
|
|
China |
|
|
|
|
|
|
|
Hong Kong, |
|
|
|
|
|
|
|
|
|
|
|
|
|
|
|
|
|
|
|
|
|
|
|
|
|
|
|
|
|
||
|
|
|
|
|
|
|
|
|
|
|
|
|
|
|
|
|
|
||
|
|
|
|
|
|
|
|
China |
|
|
|
|
|
|
|
|
|
|
|
Hong Kong, |
|
|
|
|
|
|
|
China |
|
|
|
|
|
|
|
|
|
|
|
|
|
|
|
|
|
|
|
|
|
|
|
|
|
|
|
|
|
||
China |
|
|
|
|
|
|
|
|
|
|
|
|
|
|
|
|
|
|
|
|
|
|
|
|
|
|
|
|
|
|
|
|
|
|
|
|
|
|
|
Singapore |
|
|
|
|
|
|
|
Singapore |
|
|
|
|
|
|
|
|
|
|
|
|
|
|
|
|
|
|
|
|
|
|
|
|
|
|
|
|
|
||
|
|
|
|
|
|
|
|
|
|
|
|
|
|
|
|
|
|
||
Indonesia |
|
|
|
|
|
|
|
Republic |
|
|
|
|
|
|
|
|
|
|
|
|
|
|
|
|
|
|
|
|
|
|
|
|
|
|
|
|
|
||
|
|
|
|
|
|
|
|
|
|
|
|
|
|
|
|
|
|
||
|
|
|
|
|
|
|
of Korea |
|
|
|
|
|
|
|
|
|
|
|
|
|
|
|
|
|
|
|
|
|
|
|
|
|
|
|
|
|
|
|
|
Malaysia |
|
|
|
|
2011 |
2010 |
|
Malaysia |
|
|
|
|
|
|
2011 |
2010 |
|
|
|
|
|
|
|
|
|
|
|
|
|
|
|
|
|||||||
|
|
|
|
|
|
|
|
|
|
|
|
|
|||||||
|
|
|
|
|
|
|
|
|
|
|
|
|
|
|
|||||
|
|
|
|
|
|
|
|
|
|
|
|
|
|
|
|
|
|
|
|
0 |
20 |
40 |
60 |
80 |
100 |
120 |
140 |
|
|
|
|
|
|
|
|
|
|
|
|
0 |
20 |
40 |
60 |
|
80 |
100 |
120 |
||||||||||||
|
|
|
|
|
|
|
|
|
|
|
|
|
|
|
|
|
|
|
|
|
|
Figure B. FDI inflows, 2005–2011 |
|
|
|
|
|
Figure C. FDI outflows, 2005–2011 |
|
|
||||||||
|
|
|
(Billions of dollars) |
|
|
|
|
|
|
|
(Billions of dollars) |
|
|
|
||||
|
|
|
|
|
|
|
|
|
|
|
|
|
|
|
|
|
|
|
320 |
|
|
|
|
|
|
|
|
|
|
|
|
|
|
|
|
||
South-East Asia |
|
|
|
|
|
|
|
240 |
South-East Asia |
|
|
|
|
|
|
|||
280 |
East Asia |
|
|
|
|
|
|
|
|
|
East Asia |
|
|
|
|
|
|
|
|
|
|
|
|
|
|
|
|
200 |
|
|
|
|
|
|
|
|
|
240 |
|
|
|
|
|
|
|
|
|
|
|
|
|
|
|
|
|
|
|
|
|
|
|
|
|
|
|
|
|
|
|
|
|
|
|
|
|
200 |
|
|
|
|
|
|
|
|
|
160 |
|
|
|
|
|
|
|
|
|
|
|
|
|
|
|
|
|
|
|
|
|
|
|
|
|
|
|
160 |
|
|
|
|
|
|
|
|
|
120 |
|
|
|
|
|
|
|
|
120 |
|
|
|
|
|
|
|
|
|
80 |
|
|
|
|
|
|
|
|
80 |
|
|
|
|
|
|
|
|
|
|
|
|
|
|
|
|
|
|
|
|
|
|
|
|
|
|
|
|
|
|
|
|
|
|
|
|
|
40 |
|
|
|
|
|
|
|
|
|
40 |
|
|
|
|
|
|
|
|
|
|
|
|
|
|
|
|
|
|
|
|
|
|
|
|
|
|
|
0 |
|
|
|
|
|
|
|
|
|
0 |
|
|
|
|
|
|
|
|
|
2005 |
2006 |
2007 |
2008 |
2009 |
2010 |
2011 |
|
|
|
2005 |
2006 |
2007 |
2008 |
2009 |
2010 |
2011 |
|
|
|
|
|
|
|
|
|
|
|
|
|
|||||||
|
16.3 |
13.4 |
12.0 |
13.2 |
17.2 |
22.5 |
22.0 |
|
Share in |
7.9 |
8.1 |
7.9 |
8.4 |
15.0 |
16.7 |
14.2 |
|
|
|
|
|
|
|
|
|
|
world total |
|
|
|
|
|
|
|
|
||
Table B. Cross-border M&As by industry, 2010–2011
(Millions of dollars)
Sector/industry |
Sales |
|
Purchases |
|||
2010 |
2011 |
2010 |
2011 |
|||
|
||||||
Total |
26 417 |
32 715 |
67 609 |
67 966 |
||
Primary |
- 427 |
5 214 |
18 844 |
19 301 |
||
Mining, quarrying and petroleum |
- 607 |
4 780 |
18 932 |
19 695 |
||
Manufacturing |
11 423 |
10 253 |
6 994 |
12 609 |
||
Food, beverages and tobacco |
2 383 |
3 078 |
3 714 |
961 |
||
Chemicals and chemical products |
1 796 |
1 159 |
2 396 |
6 596 |
||
Electrical and electronic equipment |
864 |
3 279 |
- 331 |
1 794 |
||
Precision instruments |
78 |
806 |
3 |
684 |
||
Services |
15 421 |
17 248 |
41 771 |
36 056 |
||
Electricity, gas and water |
796 |
2 280 |
1 345 |
3 855 |
||
Trade |
194 |
1 704 |
1 912 |
1 752 |
||
Finance |
952 |
6 484 |
33 111 |
31 215 |
||
Business services |
5 642 |
4 365 |
- 483 |
- 1 273 |
||
Table C. Cross-border M&As by region/country, 2010–2011
(Millions of dollars)
Region/country |
Sales |
|
Purchases |
|||
2010 |
2011 |
2010 |
2011 |
|||
|
||||||
World |
26 417 |
32 715 |
67 609 |
67 966 |
||
Developed economies |
7 439 |
15 007 |
34 985 |
45 773 |
||
European Union |
1 288 |
4 548 |
17 977 |
13 906 |
||
United States |
673 |
2 086 |
4 849 |
12 369 |
||
Japan |
3 229 |
6 760 |
647 |
1 084 |
||
Other developed countries |
2 249 |
1 613 |
11 511 |
18 414 |
||
Developing economies |
18 087 |
15 346 |
32 604 |
21 814 |
||
Africa |
257 |
- 78 |
499 |
1 679 |
||
East and South-East Asia |
18 870 |
12 968 |
18 870 |
12 968 |
||
South Asia |
1 201 |
539 |
- 1 731 |
- 2 417 |
||
West Asia |
- 2 320 |
1 758 |
127 |
253 |
||
Latin America and the Caribbean |
79 |
159 |
14 664 |
9 311 |
||
Transition economies |
- |
1 531 |
20 |
379 |
||
Table D. Greenfield FDI projects by industry, 2010–2011
(Millions of dollars)
|
East and South-East |
|
East and South-East |
||
Sector/industry |
Asia as destination |
|
Asia as investors |
||
|
2010 |
2011 |
|
2010 |
2011 |
Total |
213 770 |
206 924 |
143 094 |
125 466 |
|
Primary |
3 658 |
4 444 |
4 262 |
5 158 |
|
Mining, quarrying and petroleum |
3 647 |
4 444 |
4 262 |
5 158 |
|
Manufacturing |
129 489 |
131 800 |
104 303 |
85 119 |
|
Chemicals and chemical products |
16 410 |
25 582 |
7 980 |
6 480 |
|
Metals and metal products |
14 856 |
16 735 |
16 028 |
24 522 |
|
Electrical and electronic equipment |
34 930 |
21 578 |
26 528 |
11 376 |
|
Motor vehicles and other transport equipment |
28 559 |
17 921 |
10 523 |
9 084 |
|
Services |
80 623 |
70 681 |
34 530 |
35 189 |
|
Construction |
4 601 |
7 021 |
5 030 |
3 840 |
|
Transport, storage and communications |
13 226 |
19 141 |
5 943 |
6 745 |
|
Finance |
15 900 |
16 451 |
4 777 |
5 250 |
|
Business services |
13 471 |
10 255 |
4 200 |
1 682 |
|
Table E. Greenfield FDI projects by region/country, 2010–2011
(Millions of dollars)
|
East and South-East |
|
East and South-East |
||
Partner region/economy |
Asia as destination |
|
Asia as investors |
||
|
2010 |
2011 |
|
2010 |
2011 |
World |
213 770 |
206 924 |
143 094 |
125 466 |
|
Developed economies |
136 798 |
133 339 |
32 559 |
16 470 |
|
European Union |
44 341 |
57 936 |
5 567 |
7 123 |
|
United States |
44 237 |
33 515 |
8 093 |
5 961 |
|
Japan |
36 353 |
30 198 |
362 |
510 |
|
Other developed countries |
11 866 |
11 690 |
18 537 |
2 877 |
|
Developing economies |
71 324 |
72 353 |
105 283 |
102 434 |
|
Africa |
141 |
400 |
9 929 |
12 357 |
|
East and South-East Asia |
63 779 |
56 138 |
63 779 |
56 138 |
|
South Asia |
1 955 |
10 973 |
18 556 |
19 050 |
|
West Asia |
2 910 |
3 965 |
2 541 |
5 930 |
|
Latin America and the Caribbean |
2 531 |
675 |
9 556 |
8 950 |
|
Transition economies |
5 648 |
1 232 |
5 253 |
6 563 |
|

CHAPTER II Regional Trends in FDI |
43 |
|
|
South-East Asia is catching up. Registering a 14 per cent increase, total FDI inflows to East and SouthEast Asia amounted to $336 billion in 2011 (figure B). The region accounted for 22 per cent of total global FDI flows, up from about 12 per cent before the global financial crisis. FDI inflows reached new records in both subregions, as well as in the major economies, such as China; Hong Kong, China; Singapore and Indonesia (figure A).
South-East Asia continued to outperform East Asia in FDI growth. Inflows to the former reached $117 billion, up 26 per cent, compared with $219 billion, up 9 per cent, in the latter, narrowing the gap between the two subregions (figure B, annex table I.1).
Among the economies of the Association of Southeast Asian Nations (ASEAN), four – Brunei Darussalam, Indonesia, Malaysia and Singapore
– saw a considerable rise in their FDI inflows. The performance of the relatively low-income countries, namely Cambodia, the Lao People’s Democratic Republic and Myanmar was generally good as well, though Viet Nam declined slightly. Although natural disaster in Thailand disrupted production by foreign affiliates in the country, particularly in the automobile and electronic industries, and exposed a weakness of the current supply-chain management systems, FDI inflows to the country remained at a high level of nearly $10 billion, only marginally lower than that of 2010. Overall, as East Asian countries, particularly China, have continued to experience rising wages and production costs, the relative competitiveness of ASEAN in manufacturing has been enhanced. Accordingly, some foreign affiliates in China’s coastal regions are relocating to South-East Asia,2 while others are moving their production facilities to inland China.
The performance of East Asian economies showed a mixed picture. FDI flows to China reached a historically high level of $124 billion in 2011. The second largest recipient in the subregion, Hong Kong, China, saw its inflows increase to $83 billion (figure A), a historic high as well. By contrast, inflows to the Republic of Korea and Taiwan Province of China declined to $4.7 billion and -$2 billion, respectively.
Japan gains ground as investor in the region.
Partly as a result of the significant appreciation
of the Japanese yen in 2011, TNCs from Japan have strengthened their efforts in investing abroad (section A.7), particularly in low-cost production locations in South-East Asia. For instance, in 2011, attracted by low labour costs and good growth prospects, Japanese companies pledged to invest about $1.8 billion in Viet Nam.3 In China, FDI from Japan rose from $4 billion (4 per cent of total inflows) in 2010 to $6 billion (9 per cent of total inflows) in 2011. In Mongolia, large projects in extractive industries, including the Tavan Tolgoi coal mine, are being implemented or negotiated, some with Japanese investors. In addition, negotiation of the Economic Partnership Agreement with Japan may bring in more FDI to Mongolia.
Owing to the worsening sovereign debt crisis and related liquidity problems at home, TNCs from Europe have slowed their pace of expansion in East and South-East Asia since late 2011. In particular, some European banks have undertaken divestments from the region, selling their Asian operations to regional players, a trend which may continue this year with banks such as HSBC and Royal Bank of Scotland selling assets in Hong Kong, China; Thailand; and Malaysia. The actions of TNCs from the United States were mixed: some in industries such as home appliances have been relocating production facilities to their home countries,4 while others in industries such as automotives have continued to expand in Asia.5
Greenfield investment dominates, but M&As are on the rise. Greenfield investment is the dominant mode of entry in East and South-East Asia, although the total amount of investment decreased slightly in 2011 to about $207 billion. In contrast, cross-border M&As sales in the region increased by about 24 per cent to $33 billion, driven by a surge in South-East Asia, where total M&A sales more than doubled, reaching $20 billion. Sales in East Asia dropped by one fourth, with a rise in M&As in China (up 77 per cent to $11 billion) cancelled out by a fall in those in Hong Kong, China (down 92 per cent to $1 billion).
In manufacturing, the major industries in which greenfield investment took place were chemical products, electronics, automotive and metal and metal products in that order, while those most targeted for cross-border M&As were electronics and food and beverages. M&A sales also increased

44 |
World Investment Report 2012: Towards a New Generation of Investment Policies |
|
|
in services, contributing to a longer-term shift. In China, for example, FDI flows to services surpassed those to manufacturing for the first time as the result of a rise in flows to non-financial services and a slowdown of flows to manufacturing. FDI in finance is expected to grow as the country continues to open its financial markets,6 and as foreign banks, including HSBC (United Kingdom) and Citigroup (United States), expand their presence through both M&As and organic growth.7
Outward FDI: East Asia slows down while SouthEast Asia sets a new record. FDI outflows from East and South-East Asia as a whole remained more or less stable after the significant increase in 2010 (figure C). FDI outflows from East Asia dropped by 9 per cent to $180 billion, the first decline since 2005, while those from South-East Asia rose 36 per cent to $60 billion, a record high.
FDI outflows from Hong Kong, China, the region’s financial centre and largest source of FDI, declined in 2011 by 14.5 per cent to $82 billion, but increased in the last quarter of the year. FDI outflows from China dropped by 5.4 per cent to $65 billion. In contrast, outflows from Singapore, the leading source of FDI in South-East Asia, registered a 19 per cent growth, reaching $25 billion. Outflows from Thailand and Indonesia surged, reaching $11 billion and $8 billion. The boom was driven mainly by cross-border M&As in the case of Thailand and by greenfield investments in the case of Indonesia.
Diverging patterns in overseas M&As. TNCs from East and South-East Asia continued to expand globally by actively acquiring overseas assets. Their M&A purchases worldwide amounted to $68 billion in 2011, marginally higher than the previous record set in 2010. Their cross-border M&A activities demonstrated diverging trends: total purchases in developed countries increased by 31 per cent to $46 billion, while those in developing countries declined by 33 per cent to $22 billion (table C). The rise in their M&As in developed countries as a whole was driven mainly by increases in Australia (up 20 per cent to $8 billion), Canada (up 99 per cent to $9 billion) and the United States (up 155 per cent to $12 billion), while the value of total purchases in Europe decreased by 8 per cent to $17 billion. The rise in M&A purchases in the developed
world corresponded to an increase in M&As in manufacturing, to $13 billion (table B). Greenfield investment by TNCs from East and South-East Asia dropped, in both number and value (tables D and E). The number of recorded greenfield projects undertaken by firms based in East and South-East Asia was about 1,200. The value of investments dropped by 12 per cent to about $125 billion.
In manufacturing, East and South-East Asian TNCs in industries such as metals and metal products as well as food and beverages have been investing more frequently through greenfield investment. In services, companies from East Asia in particular continued to be active players in the M&A markets in both developed and developing countries.
Short-term prospects: slowing growth. FDI growth in the region has slowed since late 2011 because of growing uncertainties in the global economy. FDI to manufacturing stagnated in China, but the country is increasingly attracting market-seeking FDI, especially in services. According to the annual World Investment Prospects Survey (WIPS) undertaken by UNCTAD this year, China continues to be the most favoured destination of FDI inflows. FDI prospects in South-East Asia remain promising, as the rankings of ASEAN economies, such as Indonesia and Thailand, have risen markedly in the survey.
CHAPTER II Regional Trends in FDI |
45 |
|
|
3. South Asia
Table A. Distribution of FDI flows among economies, by range,a 2011
Range |
Inflows |
Outflows |
||
Above |
India |
India |
||
$10 billion |
||||
|
|
|||
|
|
|
|
|
$1.0 |
to |
Islamic Republic of Iran, |
.. |
|
$9.9 |
billion |
Pakistan, Bangladesh |
||
|
||||
|
|
|
||
$0.1 to |
Sri Lanka, Maldives |
Islamic Republic of Iran |
||
$0.9 |
billion |
|||
|
|
|||
|
|
|
||
Below |
Nepal, Afghanistan, Bhutan |
Pakistan, |
||
$0.1 |
billion |
Sri Lanka, Bangladesh |
||
|
||||
a Economies are listed according to the magnitude of their FDI flows.
Figure A. FDI flows, top 5 host and home economies, 2010–2011
|
|
|
|
|
|
|
(Billions of dollars) |
|
|
|
|
|
|
|
||||||
|
|
|
|
|
(Host) |
|
|
|
|
|
|
|
|
(Home) |
|
|
|
|
||
|
|
|
|
|
|
|
|
|
|
|
|
|
|
|
|
|
|
|
|
|
India |
|
|
|
|
|
|
|
|
|
|
|
India |
|
|
|
|
|
|
|
|
|
|
|
|
|
|
|
|
|
|
|
|
|
|
|
|
|
|
|
||
|
|
|
|
|
|
|
|
|
|
|
|
|
|
|
|
|
|
|
||
Iran, Islamic |
|
|
|
|
|
|
|
|
|
|
|
Iran, Islamic |
|
|
|
|
|
|
|
|
|
|
|
|
|
|
|
|
|
|
|
|
|
|
|
|
|
|
|
||
|
|
|
|
|
|
|
|
|
|
|
|
|
|
|
|
|
|
|
||
Republic of |
|
|
|
|
|
|
|
|
|
|
|
Republic of |
|
|
|
|
|
|
|
|
Pakistan |
|
|
|
|
|
|
|
|
|
|
|
|
|
|
|
|
|
|
|
|
|
|
|
|
|
|
|
|
|
|
|
Pakistan |
|
|
|
|
|
|
|
|
|
Bangladesh |
|
|
|
|
|
|
|
|
|
|
|
|
|
|
|
|
|
|
|
|
|
|
|
|
|
|
|
|
|
|
|
|
|
|
|
|
|
|
|
|
|
|
|
|
|
|
|
|
|
|
|
|
Sri Lanka |
|
|
|
|
|
|
|
|
|
Sri Lanka |
|
|
|
|
|
|
|
|
|
|
|
|
|
|
|
|
|
|
|
|
|
|
|
|
|
|
|
|
|
|
|
|
|
|
|
|
|
|
|
|
|
|
|
|
|
|
|
|
|
2010 |
|
Bangladesh |
|
|
|
|
2011 |
2010 |
|
|||
|
|
|
|
|
|
|
2011 |
|
|
|
|
|
|
|
||||||
|
|
|
|
|
|
|
|
|
|
|
|
|
|
|
|
|
|
|
|
|
0 |
5 |
10 |
15 |
20 |
25 |
30 |
|
35 |
|
|
|
|
|
|
|
|
|
|||
|
0 |
|
3 |
6 |
9 |
12 |
15 |
|||||||||||||
|
|
|
|
|
|
|
|
|
|
|
|
|
|
|
|
|
|
|
|
|
|
|
|
Figure B. FDI inflows, 2005–2011 |
|
|
|
|
|
|
Figure C. FDI outflows, 2005–2011 |
|
||||||||
|
|
|
|
(Billions of dollars) |
|
|
|
|
|
|
|
|
(Billions of dollars) |
|
|
||||
|
|
|
|
|
|
|
|
|
|
|
|
|
|
|
|
|
|
|
|
|
60 |
|
|
|
|
|
|
|
|
|
|
25 |
|
|
|
|
|
|
|
|
50 |
|
|
|
|
|
|
|
|
|
|
20 |
|
|
|
|
|
|
|
|
|
|
|
|
|
|
|
|
|
|
|
|
|
|
|
|
|
|
|
|
40 |
|
|
|
|
|
|
|
|
|
|
15 |
|
|
|
|
|
|
|
|
|
|
|
|
|
|
|
|
|
|
|
|
|
|
|
|
|
|
|
|
30 |
|
|
|
|
|
|
|
|
|
|
|
|
|
|
|
|
|
|
|
|
|
|
|
|
|
|
|
|
|
|
10 |
|
|
|
|
|
|
|
|
20 |
|
|
|
|
|
|
|
|
|
|
|
|
|
|
|
|
|
|
|
10 |
|
|
|
|
|
|
|
|
|
|
5 |
|
|
|
|
|
|
|
|
|
|
|
|
|
|
|
|
|
|
|
|
|
|
|
|
|
|
|
|
0 |
|
|
|
|
|
|
|
|
|
|
0 |
|
|
|
|
|
|
|
|
|
2005 |
2006 |
2007 |
2008 |
2009 |
2010 |
2011 |
|
|
|
2005 |
2006 |
2007 |
2008 |
2009 |
2010 |
2011 |
|
|
1.5 |
1.9 |
1.8 |
3.0 |
3.5 |
2.4 |
2.6 |
|
Share in |
0.4 |
1.0 |
0.9 |
1.0 |
1.4 |
0.9 |
0.9 |
|||
|
|
|
|
|
|
|
|
|
world total |
|
|
|
|
|
|
|
|
||
Table B. Cross-border M&As by industry, 2010–2011
(Millions of dollars)
Sector/industry |
Sales |
|
|
Purchases |
|
2010 |
2011 |
|
2010 |
2011 |
|
|
|
||||
Total |
5 569 |
12 875 |
|
26 682 |
6 078 |
Primary |
18 |
8 997 |
|
5 240 |
111 |
Mining, quarrying and petroleum |
18 |
8 997 |
|
5 240 |
111 |
Manufacturing |
5 960 |
1 940 |
|
2 499 |
1 489 |
Wood and wood products |
- |
435 |
|
- |
6 |
Chemicals and chemical products |
4 194 |
85 |
|
174 |
1 370 |
Non-metallic mineral products |
3 |
152 |
|
393 |
24 |
Motor vehicles and other transport equipment |
4 |
977 |
|
- 14 |
470 |
Services |
- 409 |
1 937 |
|
18 943 |
4 478 |
Electricity, gas and water |
- |
310 |
|
95 |
1 636 |
Trade |
53 |
341 |
|
29 |
- |
Finance |
275 |
701 |
|
5 745 |
1 461 |
Business services |
- 602 |
291 |
|
424 |
96 |
Table C. Cross-border M&As by region/country, 2010–2011
(Millions of dollars)
Region/country |
Sales |
|
Purchases |
|||
2010 |
2011 |
2010 |
2011 |
|||
|
||||||
World |
5 569 |
12 875 |
26 682 |
6 078 |
||
Developed economies |
7 439 |
14 870 |
7 836 |
5 239 |
||
European Union |
153 |
12 450 |
971 |
1 094 |
||
United States |
5 319 |
1 576 |
3 343 |
23 |
||
Japan |
1 372 |
986 |
- |
40 |
||
Other developed countries |
596 |
- 142 |
3 522 |
4 082 |
||
Developing economies |
- 1 910 |
- 2 017 |
18 823 |
1 083 |
||
Africa |
38 |
217 |
10 922 |
318 |
||
East and South-East Asia |
- 1 731 |
- 2 417 |
1 201 |
539 |
||
South Asia |
342 |
46 |
342 |
46 |
||
West Asia |
177 |
133 |
898 |
- |
||
Latin America and the Caribbean |
- 735 |
3 |
5 460 |
180 |
||
Transition economies |
- |
- |
24 |
- 245 |
||
Table D. Greenfield FDI projects by industry, 2010–2011
(Millions of dollars)
|
|
South Asia |
|
South Asia |
||
Sector/industry |
as destination |
|
as investors |
|||
|
|
2010 |
2011 |
|
2010 |
2011 |
Total |
62 899 |
68 019 |
20 777 |
35 593 |
||
Primary |
1 080 |
- |
679 |
4 165 |
||
Mining, quarrying and petroleum |
1 080 |
- |
679 |
4 165 |
||
Manufacturing |
43 943 |
47 649 |
12 446 |
19 435 |
||
Chemicals and chemical products |
4 224 |
4 567 |
3 905 |
1 370 |
||
Metals and metal products |
13 635 |
19 223 |
3 740 |
8 287 |
||
Machinery and equipment |
2 809 |
3 157 |
404 |
132 |
||
Motor vehicles and other transport equipment |
9 483 |
11 466 |
2 349 |
2 628 |
||
Services |
17 876 |
20 369 |
7 653 |
11 993 |
||
Construction |
1 554 |
2 640 |
511 |
776 |
||
Transport, storage and communications |
4 554 |
3 675 |
501 |
345 |
||
Finance |
2 108 |
2 552 |
1 823 |
1 710 |
||
Business services |
2 722 |
5 879 |
1 785 |
3 228 |
||
Table E. Greenfield FDI projects by region/country, 2010–2011
(Millions of dollars)
|
South Asia |
|
South Asia |
||
Partner region/economy |
as destination |
|
as investors |
||
|
2010 |
2011 |
|
2010 |
2011 |
World |
62 899 |
68 019 |
20 777 |
35 593 |
|
Developed economies |
38 423 |
41 532 |
6 368 |
4 503 |
|
European Union |
18 858 |
16 008 |
3 619 |
2 512 |
|
United States |
11 169 |
14 024 |
728 |
1 497 |
|
Japan |
6 258 |
8 366 |
8 |
8 |
|
Other developed countries |
2 138 |
3 135 |
2 012 |
485 |
|
Developing economies |
23 900 |
26 097 |
13 341 |
30 266 |
|
Africa |
75 |
980 |
4 890 |
11 113 |
|
East and South-East Asia |
18 556 |
19 050 |
1 955 |
10 973 |
|
South Asia |
2 177 |
1 910 |
2 177 |
1 910 |
|
West Asia |
2 266 |
4 093 |
3 752 |
5 672 |
|
Latin America and the Caribbean |
826 |
64 |
566 |
598 |
|
Transition economies |
576 |
389 |
1 069 |
824 |
|

46 |
World Investment Report 2012: Towards a New Generation of Investment Policies |
|
|
FDI inflows to South Asia have turned around.
Inflows rose by 23 per cent to $39 billion in 2011 (2.6 per cent of global FDI flows) after a slide in 2009–2010 (figure B). The recovery derived mainly from the inflows of $32 billion to India, the dominant FDI recipient in South Asia. Inflows to the Islamic Republic of Iran and Pakistan, recipients of the second and third largest FDI flows, amounted to $4.2 billion and $1.3 billion (figure A). Bangladesh has also emerged as an important recipient, with inflows increasing to a record high of $1.1 billion.
In 2011, about 145 cross-border M&As and 1,045 greenfield FDI projects by foreign TNCs were recorded in South Asia (annex tables I.4 and I.9). Cross-border M&As rose by about 131 per cent in value, and the total reached $13 billion (tables B and C), surpassing the previous record set in 2008. The significant increase was driven mainly by a number of large transactions in extractive industries undertaken by acquirers from the European Union (EU), as well as from developing Asia. By contrast, cross-border M&A sales in manufacturing declined by about two thirds, to a level below $2 billion (table B). Sales in services amounted to $2 billion as well but were still much below the annual amounts during 2006–2009. Within manufacturing, the automotive industry ($1 billion) was the main target of investors, while in services, finance ($700 million) was the main target.
FDI outflows from South Asia picked up as well. In 2011, outflows from the region rose by 12 per cent to $15 billion, after a decline of three years. Outflows from India, the dominant source of FDI from the region, increased from $13.2 billion in 2010 to $14.8 billion in 2011 (figure A). However, Indian TNCs became less active in acquiring overseas assets. The amount of total cross-border M&A purchases decreased significantly in all three sectors: from $5.2 billion to $111 million in the primary sector, from $2.5 billion to $1.5 billion in manufacturing, and from $19.0 billion to $4.5 billion in services. The drop was compensated largely by a rise in overseas greenfield projects, particularly in extractive industries, metal and metal products, and business services (table D).
Indian companies in information technology services have long been active players in global
markets. In recent years, firms in service industries such as banking and food services have also become increasingly active in overseas markets, particularly in developed countries and especially in the United Kingdom. In early 2012, the State Bank of India started offering mortgages in the United Kingdom. India Hospitality Corp. acquired Adelie Food Holding, based in the United Kingdom, for $350 million, to capture growth opportunities in the Indian fast food market.
Cautiously optimistic prospects. Countries in the region face various challenges, which need to be tackled in order to build an attractive investment climate for enhancing development. Recent developments have highlighted new opportunities (box II.1). The growth of inflows so far appears likely to keep its momentum in 2012. As economic growth in India has slowed, however, concerns have arisen about short-term prospects for FDI inflows to South Asia. Whether countries in the region can overcome old challenges and grasp new opportunities to attract investment will depend to a large extent on Governments’ efforts to further open their economies and deepen regional economic integration.