


Improving performance in SignalR services
In all applications, we have to be careful and prudent in the use of resources to ensure that the host they run on can work at its full potential, and even more so in SignalR applications, where real-time and immediacy are essential features. Moreover, sometimes this is purely a matter of survival, because these are applications that can keep hundreds of active sessions with thousands of messages circulating. A small mistake or neglect is significantly amplified and can be fatal.
The following are general recommendations to be carefully taken into account when developing systems using SignalR if we want to achieve the best performance and application stability:
■■Never use blocking calls, especially those that use external resources such as an invocation of a web service or a heavy query to a database. Use asynchrony whenever possible, as well as ASP.NET 4.5, to make better use of these features.
■■Do not send messages that are too long. A message several tens or hundreds of KB in size and distributed to thousands of clients adds a load in terms of memory and bandwidth that can hardly be supported on the server side. Minimize submissions as much as possible, and meticulously optimize the data structures used to reduce size. For example, we can modify the way messages are serialized so as to minimize their additional load:
public class MyMessage
{
[JsonProperty("a")]
public double Address { get; set; }
[JsonProperty("n")]
public double FullName { get; set; }
[JsonIgnore] // Don't serialize this property public string OtherProperty { get; set; }
}
■■Minimize the number of messages circulating through the network. In certain scenarios, it is possible to group messages and send them all at once or to send them with a certain frequency and make the other end interpolate the intermediate states. For example, if we want to inform thousands of clients that an object is being moved across the screen in a multiuser game, it is not necessary to inform them of each pixel of movement so that they refresh their interface. Sending the information periodically each time the displacement reaches a certain number of pixels is enough, because the clients could infer the intermediate path given the old and new locations.
Also, it is sometimes possible to perform buffering, or server clustering, and send clients the result of actions performed only from time to time. For example, if there are several clients moving various objects across the screen, the changes could be stored at the server but only notified to the other clients connected every n seconds so that they could update their interfaces. Thus we could get a fixed ratio of state update submissions per second, regardless of
Deploying and scaling SignalR Chapter 8 |
173 |
www.it-ebooks.info

the number of actions performed between each update, which could be useful for real-time high frequency scenarios, as in a multiplayer shooter.
Note The SignalR team does not recommend frequencies above 25 updates per second.
■■Prevent memory leaks that in the medium term might bring the server to its knees. We must be always scrupulous with the release of resources used.
■■Never use session variables. Although this tool is widely used in other web applications, it involves serializing concurrent requests from the same user, which automatically involves the loss of SignalR’s high-performance ability to process in parallel. To maintain state, we must use other mechanisms, such as cookies, state via roundtrips in hubs, client storage, databases, or any other non-blocking systems.
■■Simplify as much as possible the processes that are performed at the server—for example, by moving as much logic as possible to the client side. Thus the processing load becomes distributed among all users, freeing the server from tasks that do not need to be performed on it.
■■Be aware of the transports used. Some consume more resources than others and are less efficient. WebSockets are by far the most efficient transport, making it convenient to execute systems in production on infrastructure that will support them, such as IIS 8 and ASP.NET 4.5.
■■Do not use the server edition of IIS on client computers such as those running Windows 7 or Windows 8, because they include a hard limit of 10 concurrent connections. In these cases, it is better to use IIS Express, but remember that the Express editions should not be used in production environments.
Server configuration
Following the preceding recommendations will certainly result in improved performance and robustness of services, but it is also possible to configure IIS and ASP.NET to optimize their use in SignalR applications. Normally, they are configured for scenarios very much oriented to the traditional web, whose operation is primarily based on the processing of short requests, rather than the long-lived connections that take place during the lifetime of a SignalR client.
In the case of IIS, we can increase the number of concurrent requests that this server can handle, which can be very useful in the case of long-lived connections. To do this, we simply have to open a command console with administrator privileges, go to the %windir%\system32\inetsrv folder, and run the following:
appcmd.exe set config /section:system.webserver/serverRuntime /appConcurrentRequestLimit:50000
The default value for this parameter is 5,000 for IIS 7 and above, which might be on the short side for certain types of SignalR applications.
174 Chapter 8 Deploying and scaling SignalR
www.it-ebooks.info

However, by default, ASP.NET limits the number of concurrent connections that it can handle. In version 4.0 of this framework, this maximum number is set by default to 5,000 for every CPU available in the system. To increase this value, we can go to the aspnet.config file present in the folder of the
.NET Framework version with which we are working and enter the new value:
<?xml version="1.0" encoding="UTF-8" ?> <configuration>
...
<system.web>
<applicationPool maxConcurrentRequestsPerCPU="10000" /> </system.web>
</configuration>
Note In 64-bit environments, .NET 4 is found inside the system folder %windir% \Microsoft.NET\Framework\v4.0.30319.
When the maximum number of connections has been exceeded, ASP.NET enters new connections into a queue, where they wait for the ones already in use to be freed. The default size of this queue is 5,000 connections. After the size is exceeded, the users begin to receive HTTP 503 errors indicating that it is not possible to deal with them.
The size of this queue can be controlled by tweaking the machine.config file, also present in the
.NET Framework folder:
<?xml version="1.0"?> <configuration>
...
<system.web>
...
<processModel enable="true" requestQueueLimit="15000" />
...
</system.web>
</configuration>
Monitoring performance
One of the main tools that we can use to monitor the performance of SignalR applications is the Windows Performance Monitor (Perfmon.exe). In addition to the performance counters that we regularly use in web and ASP.NET applications, we can also install on it a set of counters specific to SignalR that will help us get a precise view of what is happening inside our system.
To install these counters, we must use the Signalr.exe utility that we already employed to generate a static JavaScript proxy based on a hub. As we saw then, we can bring this tool to our computer by using NuGet:
PM> Install-package Microsoft.AspNet.SignalR.Utils
Deploying and scaling SignalR Chapter 8 |
175 |
www.it-ebooks.info
Upon completion of the download, the signalr.exe executable file is entered into the packages folder of our project under the name Microsoft.AspNet.SignalR.Utils-2.0.0\Tools. To install the performance counters, we just need to execute the following command from a console with administrator permissions:
Signalr.exe ipc
The letters “ipc” stand for “install performance counters.” Likewise, we can uninstall them using the sequence “upc” (“uninstall performance counters”).
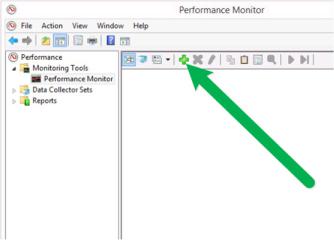
After the installation process has completed, we will have new counters available in the performance monitor that we can add to the monitoring session by clicking the “Add” button pointed to in Figure 8-18 (and also accessible via Ctrl+N).
FIGURE 8-18 Adding new performance counters.
Next we will get the Add Counters dialog box, like the one shown in Figure 8-19, in which we must select the counters that we want to query, as well as the specific application instances that are using them. The counters installed are found grouped under the name SignalR. After selecting them, we can also select the instances to be monitored, in the lower left of the dialog box.
After the counters to be included have been selected and we have clicked OK, we will be able to query their values in real time. See Figure 8-20.
176 Chapter 8 Deploying and scaling SignalR
www.it-ebooks.info
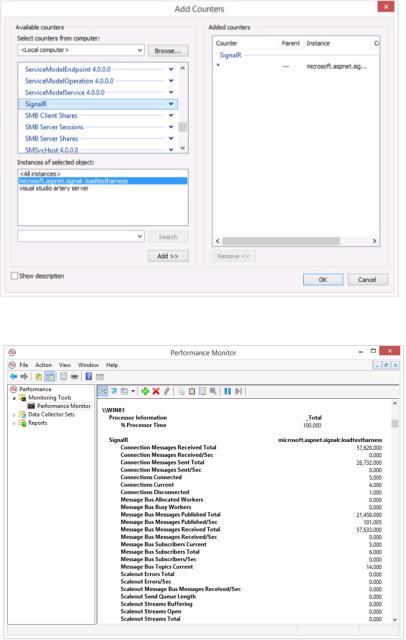
FIGURE 8-19 Selecting counters and instances to monitor.
FIGURE 8-20 Performance Monitor displaying SignalR counters.
The meaning of SignalR-specific performance counters is described in the following four sections.
Deploying and scaling SignalR Chapter 8 |
177 |
www.it-ebooks.info
Connection activity
■■Connection Messages Received Total Total number of messages received by the connections (sent from the server to the client) since the application was started
■■Connection Messages Received/Sec Number of messages received by the connections (sent from the server to the client) per second
■■Connection Messages Sent Total Number of messages sent by the connections (from the client to the server) since the application started operating
■■Connection Messages Sent/Sec Number of messages sent by the connections (from the client to the server) per second
■■Connections Connected Total number of connections made since the application was started
■■Connections Current Number of currently active connections
■■Connections Disconnected Total number of disconnection events executed since the application was started
■■Connections Reconnected Total number of reconnection events that have occurred since the application was started
Errors
■■Errors: All Total Total number of errors generated since the application was started
■■Errors: All/Sec Number of errors generated per second
■■Errors: Hub Invocation Total Total number of errors of any type that have occurred during the invocation of hubs since the application was started
■■Errors: Hub Invocation/Sec Number of errors occurring per second during the invocation of hubs
■■Errors: Hub Resolution Total Number of hub name resolution errors that have occurred since the application was started
■■Errors: Hub Resolution/Sec Number of errors relative to hub name resolution per second
■■Errors: Transport Total Total number of errors that have occurred in transports since the application was started
■■Errors: Transport/Sec Number of errors relative to transports occurred per second
Activity in the messaging bus
■■Message Bus Allocated Workers Number of processes in charge of managing the submissions created on the bus
178 Chapter 8 Deploying and scaling SignalR
www.it-ebooks.info
■■Message Bus Busy Workers Number of such processes that are currently making submissions on the bus
■■Message Bus Messages Published Total Total number of messages that have been published on the messaging bus since the application started operating
■■Message Bus Messages Published/Sec Number of messages that are being published on the bus per second
■■Message Bus Messages Received Total Total number of messages received by subscribers since the application was started
■■Message Bus Messages Received/Sec Number of messages that are being received by the subscribers per second
■■Message Bus Subscribers Current Current number of connections subscribed to the messaging bus
■■Message Bus Subscribers Total Total number of subscribers to the messaging bus since the application was started
■■Message Bus Subscribers/Sec Number of new subscriptions made to the bus per second
■■Message Bus Topics Current Number of topics currently defined on the messaging bus
Scale-out providers
■■Scaleout Errors Total Total number of errors that have occurred in the scale-out system since the application was started
■■Scaleout Errors/Sec Number of errors relative to the scale-out provider that are occurring per second
■■Scaleout Message Bus Messages Received/Sec Number of messages per second that subscribers are receiving from the messaging bus of the scale-out provider
■■Scaleout Send Queue Length Current size of the submission queue of the scale-out provider
■■Scaleout Streams Buffering Number of streams that are currently entering information into the buffer
■■Scaleout Streams Open Total number of streams configured on the bus that are currently open
■■Scaleout Streams Total Total number of streams—logical channels—currently configured on the provider’s messaging bus
Deploying and scaling SignalR Chapter 8 |
179 |
www.it-ebooks.info
Other useful performance counters
Besides SignalR’s own counters, which we have already mentioned, many other counters provide useful information about the state of our applications and help us detect problems. For example, it is usually crucial to know the CPU load that the computer is currently bearing. We can query it by adding the counter Processor information / % Processor time to our monitoring data.
It is also useful to know the evolution of memory footprint. For this, we have several counters grouped inside the Memory category. For example, the Available KBytes (or Available MBytes) counter can illustrate the situation quite plainly. We can also query .NET CLR Memory#bytes in all heaps on the execution process of the application to get the memory footprint in garbage collection heaps. Continual surveillance of these values can reveal memory leaks or other problems.
In the .NET CLR LocksAndThreads category we find counters that display information about the execution threads associated with the application. For example, # of current logical Threads gives the current number of threads managed by the CLR, while # of current physical Threads gives the number of threads actually in use at operating system level. Monitoring these counters could help us detect problems related to an excess of active threads and take actions such as modifying server parameters.
In the ASP.NET category we also find counters that provide a lot of valuable information. In particular, knowing the number of requests that are being processed and how many could not be processed (queued or rejected) due to saturation of the server can give us insight in many scenarios. We can obtain this information from the counters Requests Current, Requests Queued, and Requests Rejected.
The comprehensive reference of available performance counters can be reviewed at the following MSDN page: http://msdn.microsoft.com/en-us/library/w8f5kw2e.aspx.
180 Chapter 8 Deploying and scaling SignalR
www.it-ebooks.info