

The Chemistry of Dienes and Polyenes. Volume 1
Edited by Zvi Rappoport
Copyright ∂ 1997 John Wiley & Sons, Ltd.
ISBN: 0-471-96512-X
CHAPTER 5
Ultraviolet/visible, infrared and Raman spectra
YUKIO FURUKAWA
Department of Chemistry, School of Science, The University of Tokyo, Bunkyo-ku, Tokyo 113, Japan
Fax: C81-3-3814-2627; e-mail: furukawa@chem.s.u-tokyo.ac.jp
I. INTRODUCTION . . . . . . . . . . . . . . . . . . . . . . . . . . . . . . . . . . . . . . |
149 |
|
II. ELECTRONIC AND VIBRATIONAL SPECTROSCOPIES . . . . . . . . . . . |
151 |
|
A. Infrared and Raman Spectroscopies . . . . . . . . . . . . . . . . . . . . . . . . |
151 |
|
B. Absorption and Fluorescence Spectroscopies . . . . . . . . . . . . . . . . . . |
151 |
|
C. Normal Coordinate Calculations . . . . . . . . . . . . . . . . . . . . . . . . . . . |
151 |
|
D. Vibronic Theory of Resonance Raman Scattering . . . . . . . . . . . . . . . |
152 |
|
III. ELECTRONIC SPECTRA . . . . . . . . . . . . . . . . . . . . . . . . . . . . . . . . |
154 |
|
A. Electronic Structure . . . . . . . . . . . . . . . . . . . . . . . . . . . . . . . . . . . |
154 |
|
B. Ultraviolet/Visible Absorption Spectra . . . . . . . . . . . . . . . . . . . . . . . |
155 |
|
IV. VIBRATIONAL SPECTRA . . . . . . . . . . . . . . . . . . . . . . . . . . . . . . . . |
158 |
|
A. Butadiene . . . . . . . . . . . . . . . . . . . . . . . . . . . . . . . . . . . . . . . . . |
158 |
|
1. |
s-Trans conformer . . . . . . . . . . . . . . . . . . . . . . . . . . . . . . . . . . |
158 |
2. |
Gauche conformer . . . . . . . . . . . . . . . . . . . . . . . . . . . . . . . . . |
161 |
B. Hexatriene . . . . . . . . . . . . . . . . . . . . . . . . . . . . . . . . . . . . . . . . . |
161 |
|
1. |
Trans conformer . . . . . . . . . . . . . . . . . . . . . . . . . . . . . . . . . . . |
162 |
2. |
Cis conformer . . . . . . . . . . . . . . . . . . . . . . . . . . . . . . . . . . . . |
163 |
3. |
Other conformers . . . . . . . . . . . . . . . . . . . . . . . . . . . . . . . . . . |
166 |
C. Long Chain Polyenes . . . . . . . . . . . . . . . . . . . . . . . . . . . . . . . . . . |
166 |
|
1. |
All-trans conformers . . . . . . . . . . . . . . . . . . . . . . . . . . . . . . . . |
166 |
2. |
Cis conformers . . . . . . . . . . . . . . . . . . . . . . . . . . . . . . . . . . . . |
169 |
V. REFERENCES . . . . . . . . . . . . . . . . . . . . . . . . . . . . . . . . . . . . . . . . |
169 |
|
I. INTRODUCTION
Ultraviolet/visible absorption, fluorescence, infrared and Raman spectroscopies are useful for studying structures (configuration, conformation, symmetry etc.) of electronically ground and excited states of linear polyenes, which have attracted much attention of
149
150 |
|
Yukio Furukawa |
|
|
|
R |
|
R |
n |
R= H, Me, CMe3 , |
, |
|
|
|
|
|
|
|
S |
|
|
(a) |
|
|
|
|
O |
|
|
(b) |
|
(c)
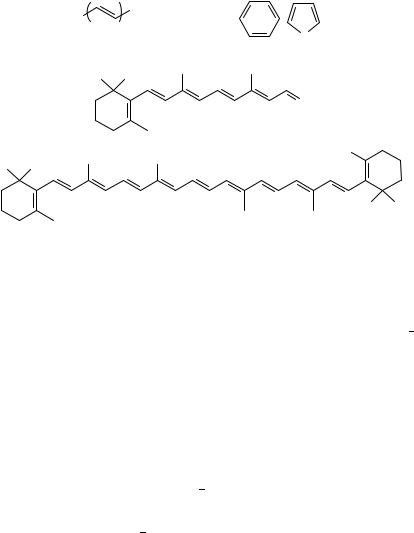
FIGURE 1. Chemical structures of various polyenes: (a) unsubstituted and ˛,ω-disubstituted polyenes;
(b) retinal; (c) ˇ-carotene
researchers in quantum chemistry, solid-state physics, biophysics etc. Linear polyenes exhibit interesting chemical and physical properties originating from -electrons. Firstly, these compounds show novel spectroscopic properties due to electron correlation1 3. Hudson and coworkers1 and Kohler2 have reviewed the electronic states of unsubstituted polyenes and ˛,ω-diphenylpolyenes (Figure 1a), emphasizing the ordering of the
electronically excited states, 1 |
1 |
1 |
3 |
have reviewed vibra- |
Bu and 2 |
Ag. Orlandi and coworkers |
|
tional analyses based on quantum chemical calculations for the electronically ground and excited states of unsubstituted polyenes, and have explained the frequency increase of the
in-phase CDC stretch upon excitation to the 2 1 state. Secondly, polyenes are model
Ag
compounds of polyacetylene [(CHDCH)n] which is the prototype of conducting polymers. Polyacetylene shows new electrical, magnetic and optical properties; for example, it shows high electrical conductivities when doped with electron acceptors (iodine, AsF5 etc.) or electron donors (Na, K etc.)4. The application of vibrational spectroscopy to polyacetylene is described in previous reviews5 7. Lastly, retinal (Figure 1b) and its Schiff base play important roles in retinal proteins8, and so do carotenoids in photosynthetic bacteria9. The chemical structure of ˇ-carotene, which is one of the carotenoids, is shown in Figure 1c. Several reviews10 14 have described the application of vibrational spectroscopy to polyenes in biological systems. There exist geometrical isomers around CDC double bonds and rotamers around C C single bonds for polyenes. Vibrational studies on the conformers of polyenes may lead us to a better understanding of the functions of polyacetylene and biological systems. In this chapter, we mainly present the spectroscopic properties of various conformers of unsubstituted polyenes. We focus our attention on the structures (configuration, conformation etc.) of the ground states of polyenes and the relation between the number of conjugated CDC bonds and spectroscopic properties. In Section II, we mention experimental techniques and outlines of normal coordinate calculations and resonance Raman spectroscopy. In Section III, we describe the electronic absorption spectra of polyenes. In Section IV, we describe vibrational spectra of polyenes from 1,3-butadiene to polyacetylene.
5. Ultraviolet/visible, infrared and Raman spectra |
151 |
II.ELECTRONIC AND VIBRATIONAL SPECTROSCOPIES A. Infrared and Raman Spectroscopies
Vibrational spectra of polyenes can be obtained by infrared and Raman spectroscopies. Infrared and Raman spectra are measured by means of dispersive-type or Fourier transform spectrophotometers. The combination of matrix-isolation infrared spectroscopy and a high-temperature nozzle technique (or photoexcitation) is useful for studying the ground states of unstable conformers of polyenes15. A sample is diluted with an inert gas, such as argon, xenon and nitrogen. This mixture is passed through a pipe (or a cell) at a high temperature and immediately sprayed onto a cold CsI plate maintained at a low temperature (e.g. 10 K). Then, unstable conformers can be trapped in the matrices. Biological systems have been studied by resonance Raman spectroscopy10,12,13 and Fourier transform infrared spectroscopy14. These systems consist of various components, such as proteins, membranes and pigments; resonance Raman spectroscopy can give us information about a pigment, when the excitation wavelength for Raman scattering is within the electronic absorption of the pigment. On the other hand, very small absorbance changes associated with external stimuli such as light irradiation can be detected by Fourier transform infrared spectroscopy. Thus, short-lived polyene conformers which are reaction intermediates in biological systems have been studied by the use of steady-state and time-resolved resonance Raman spectroscopy10,12 and Fourier transform infrared spectroscopy14. Strong fluorescence often prevents us from observing Raman spectra. This is the major obstacle in Raman measurements. Coherent anti-Stokes Raman spectroscopy (CARS)16 can partly solve this fluorescence problem. Since fluorescence appears in the Stokes region, anti-Stokes Raman spectra are not disturbed by fluorescence in principle. It is difficult to measure spontaneous anti-Stokes Raman scattering with high signal-to-noise ratios, because their intensities are very weak. However, coherent anti-Stokes scatterings are strong enough to be measured with high signal-to-noise ratios.
B. Absorption and Fluorescence Spectroscopies
Absorption and fluorescence spectra of polyenes in the region from ultraviolet to visible in the condensed phases (liquid, solid, solutions etc.) are very broad in most cases. Thus, bands arising from distinct vibronic transitions are not resolved. However, the spectra of polyenes in hydrocarbon environments at very low temperatures or in supersonic expansions show fine structures originating from vibrational transitions1,2. Absorption and fluorescence excitation spectra provide us with the vibrational frequencies of electronically excited states, whereas fluorescence spectra provide us with those of ground states. Two-photon absorption spectroscopy is complementary to one-photon absorption spectroscopy. Let us consider a molecule with a centre of inversion. The transitions between the ground state and electronically excited states with ungerade symmetry are allowed for one-photon processes, but forbidden for two-photon processes. On the other hand, the selection rules are just reversed for the transitions between the ground state and excited
states with gerade symmetry. The electronically excited states labelled with 1 |
1 |
1 |
Bu and 2 |
Ag |
of polyenes have been studied by means of oneand two-photon absorption (fluorescence excitation) experiments1,2.
C. Normal Coordinate Calculations
The frequencies of some vibrational bands are sensitive to molecular conformation. Normal coordinate calculations are useful for assigning observed vibrational spectra and deducing from them precise structural information. Normal coordinate calculations were

152 |
Yukio Furukawa |
previously performed by means of empirical methods17,18. It has recently been demonstrated that ab initio molecular orbital (MO) methods are useful for evaluating vibrational spectra19. The frequencies calculated at the Hartree Fock (HF) level are usually higher than those obtained from experiments. Then, the calculated force constants are fitted by the use of parameters, which are called scale factors, to the observed frequencies. In most cases, the scale factor for an off-diagonal force constant is the geometric mean of the scale factors for the corresponding diagonal force constants. The force field thus obtained is called a scaled quantum mechanical (SQM) force field19. It is noted that electron correlation is not taken into account explicitly under the HF approximation. Electron correlation is usually introduced by adding the Moller Plesset (MP) perturbation correction to the HF result. The second-order MP perturbation method is abbreviated to MP2.
D. Vibronic Theory of Resonance Raman Scattering
Resonance Raman spectroscopy has been applied to studies of polyenes for the following reasons. The Raman spectrum of a sample can be obtained even at a dilute concentration by the enhancement of scattering intensity, when the excitation laser wavelength is within an electronic absorption band of the sample. Raman spectra can give information about the location of dipole forbidden transitions, vibronic activity and structures of electronically excited states. A brief summary of vibronic theory of resonance Raman scattering is described here.
The intensity of a Raman transition from the initial vibrational level i of the ground electronic state g to the final vibrational level j of the g state is given by equation 1:
|
|
|
2 |
1 |
Igi,gj D CI0 0 S3 |
˛ gi,gj |
|
|
|
|
|
|
|
where C is a constant, I0 and 0 are the intensity and the frequency of the incident laser
light, S is the frequency of the scattered light and ˛ gi,gj is the Raman polarizability tensor element, with and being labels for the Cartesian coordinates in the molecu-
lar frame. Second-order perturbation theory gives equation 2 for the Raman polarizability tensor20,21.
˛ |
gi,gj D |
Eev |
|
Egi |
E0 |
|
i ev |
C Eev |
|
Egj |
E0 |
|
i ev |
|
||
|
|
higjM jevihvejM jgji |
|
higjM jevihvejM jgji |
2 |
|||||||||||
|
|
|
|
|
|
|
|
|
|
|
|
|
C |
|
|
|
|
ev |
|
|
|
|
|
|
|
|
|
|
|
|
|
|
|
Here jgii, jgji and jevi are the vibronic wavefunctions of the initial, final and intermediate states, respectively; M and M are the electronic dipole operators of and polarizations, respectively; E0 is the energy of the incident laser photon; Egi, Egj and Eev are the energies of the initial, final and intermediate vibronic levels, respectively; andev is a damping factor which defines the linewidth of the jevi vibronic state. When the wavelength of the incident laser light coincides with the electronic absorption band (i.e. Eev Egi ³ E0), the first term is dominant, and the second term can be neglected because it is much smaller than the first term. In the following discussion the second non-resonant term is neglected.
If Born Oppenheimer wavefunctions are used to describe the vibronic wavefunctions,
the electronic and vibrational portions of the wavefunctions can be separable: |
|
higjM jevi D hijhgjM jeijvi D hijMgejvi |
3 |
This integral of the electronic dipole moment operator is a function of a nuclear coordinate Q. The integral may be expanded in a Taylor series with respect to Q (equation 4) and

|
5. Ultraviolet/visible, infrared and Raman spectra |
|
|
153 |
|||||
evaluated at the equilibrium position of the potential surface. |
|
|
|
||||||
M |
M 0 |
|
∂M |
M 0 |
M 0 |
Qa |
|
4 |
|
|
ge Qa |
|
|||||||
ge D |
ge C |
|
|
C Ð Ð Ð ge C |
|
|
C Ð Ð Ð |
|
|
a |
∂Qa |
ge a |
|
|
|||||
|
|
|
|
|
a |
|
|
|
|
Substitution of the first two terms into the Raman polarizability tensor gives the following three terms22 24:
where |
|
|
˛ gi,gf D ˛I C ˛II C ˛III |
|
|
|
|
|
|
|
|
|
5 |
||||||||||||||||||
|
|
|
|
|
|
|
|
|
|
|
|
|
|
|
|
|
|
|
|
|
|
|
|
|
|
|
|
|
|
|
|
|
|
|
|
|
Mge 0 Meg 0 |
|
|
|
|
|
|
|
|
|
|
|
|
|
(6) |
||||||||||||
|
|
Eev |
|
Egi |
|
E0 |
|
i ev hijvihvjji |
|||||||||||||||||||||||
˛I D |
v |
|
|
|
|
|
|
|
|||||||||||||||||||||||
|
|
e |
|
|
|
|
|
|
|
|
|
|
|
|
|
|
|
|
|
|
|
|
|
|
|
|
|
|
|
|
|
|
II |
|
|
|
|
|
M 0 Meg |
0 |
|
i |
Qa |
|
v v j |
i |
|
|
|
|
|
||||||||||||
|
|
|
ge |
a |
|
|
|
|
|
|
h j |
|
|
j |
ih |
j |
|
|
|
|
|
|
|||||||||
|
|
Eev |
|
|
Egi |
|
E0 |
|
i ev |
|
|
|
|
|
|
|
|||||||||||||||
˛ D |
v |
|
|
a |
|
|
|
|
|
|
|
|
|
|
|
|
|
|
|
||||||||||||
|
|
e |
|
|
|
|
|
|
|
|
|
|
|
|
|
|
|
|
|
|
|
|
|
|
|
|
|
|
|
||
|
|
|
|
|
|
|
|
M 0 |
Meg 0 |
i v v |
Qb |
j |
i |
|
|
||||||||||||||||
|
|
|
ge |
|
|
|
|
|
|
|
bh j |
|
ih j |
|
|
j |
|
(7) |
|||||||||||||
|
|
Eev |
|
|
Egi |
|
|
E0 |
|
|
i ev |
|
|
|
|||||||||||||||||
|
|
C |
|
v |
b |
|
|
|
|
|
|
|
|
|
|
|
|||||||||||||||
|
|
e |
|
|
|
|
|
|
|
|
|
|
|
|
|
|
|
|
|
|
|
|
|
|
|
|
|
||||
|
III |
|
|
|
|
|
M 0 Meg |
0 |
|
i Qa |
|
v v |
Qb |
j |
i |
|
|||||||||||||||
|
|
|
ge |
a |
|
|
|
|
|
bh j |
|
|
j |
ih |
j |
|
|
j |
|||||||||||||
|
|
|
Eev |
|
Egi |
|
E0 |
|
|
i ev |
|
|
|
(8) |
|||||||||||||||||
˛ D |
v |
|
|
ab |
|
|
|
|
|
|
|
|
|
|
|
|
|
||||||||||||||
|
|
e |
|
|
|
|
|
|
|
|
|
|
|
|
|
|
|
|
|
|
|
|
|
|
|
|
|
|
|
||
In these terms, the electronic integrals such as Mge 0 and Mge 0a are constrained by the symmetry of the electronic states. While term I involves Frank Condon overlap integrals, terms II and III involve integrals of the form hijQajvi; in the harmonic approximation, the integrals of this type obey the selection rule v D i C 1. Keeping these considerations in mind, we will next discuss how terms I, II and III contribute to distinct vibrational transitions.
(1) The term I scattering (equation 6) is dominant when the excitation laser wavelength is resonant with an allowed electronic transition (M0 D6 0, M0 × M0 ). The term I scattering becomes significant if the Frank Condon overlap integrals hijvi and hvjji have non-zero values simultaneously; it usually provides the enhancement of a series of fundamental, overtone and combination transitions of totally symmetric modes. When the displacement between the adiabatic potential minima of the g and e states is large, the intensities of overtone and combination transitions are greatly enhanced. This term corresponds to the A term of the Albrecht theory25.
(2) The term II scattering (equation 7) from vibronic activity in allowed electronic transitions mainly results in fundamental transitions of non-totally symmetric vibrations. This term corresponds to the B and C terms of the Albrecht theory25.
(3) The term III scattering (equation 8) is the weakest in the three scattering mechanisms, as shown by two derivative terms M0 in the electronic transition integrals. Clearly, for a dipole forbidden transition M0 D 0 the only non-zero term is term III. The term III scattering results in binary overtone and combination transitions of vibronically active modes. It is noted that no fundamental transition survives.
In the case of polyenes, the term I scattering is dominant in the Raman spectra res-
1 |
22,26 |
; the |
contribution of the term III scattering is |
||
onant with the 1 Bu excited states |
|
||||
|
|
|
1 |
27 |
. In addition, an |
important in the Raman spectra resonant with the 2 Ag excited states |
|
||||
1 |
|
1 |
states in a Raman-intensity vs excitation- |
||
interference effect between the 1 Bu and 2 Ag |
|||||
photon-energy plot (which is called an excitation profile) of the in-phase CDC stretch has been suggested28.

154 Yukio Furukawa
III. ELECTRONIC SPECTRA
A. Electronic Structure
Let us consider an unsubstituted linear polyene with N CDC double bonds, i.e. 2N - electrons. The number of molecular orbitals equals the number of -electrons. These molecular orbitals can be classified into two types: N bonding orbitals and N antibonding orbitals. It has been shown1,2 that three low-lying singlet states of linear polyenes are described in terms of the configurations shown in Figure 2. The ground state S0 is well described by the single configuration in which the N bonding orbitals are doubly occupied (Figure 2a). For a normal -system, the first excited state S1 is described by the single configuration which is derived from the ground state by promoting one electron from the highest occupied molecular orbital (HOMO) to the lowest unoccupied molecular orbital (LUMO), as shown in Figure 2b. However, in linear polyenes this state is the second excited state S2. The S1 state is a correlated state that cannot be written in terms of a single configuration because of electron correlation, but is approximately described by a linear combination of the doubly excited configuration in which two electrons are promoted from the HOMO to the LUMO (Figure 2c) and the double jump configuration in which one
electron is promoted from the HOMO to the LUMO C 1 (Figure 2d). Electron |
1,2 |
. |
is essential for a correct description of the electronic state ordering for linear polyenes |
|
correlation
In the all-trans planar structure (C2h symmetry), S0 and S1 have Ag symmetry and are
called 1 |
1 |
and 2 |
1 |
has Bu symmetry and is called 1 |
1 |
Ag |
Ag, respectively; S2 |
Bu. As a result, |
the transition between S0 and S1 is dipole forbidden, whereas the transition between S0 and S2 is dipole allowed.
The ultraviolet/visible absorption spectrum of a polyene shows an intense absorption band and an extremely weak absorption band which is located below the strong absorption band, as described in the following section. This spectral pattern is a general property of linear polyenes of all chain lengths independent of local symmetry and/or the presence
of cis bonds. This is the reason why in the literature on polyenes the labels 1 |
1 |
for S0, |
|||||||||||||||||||
Ag |
|||||||||||||||||||||
1 |
1 |
for S2 |
are used even in cases where C2h symmetry is not realized. |
||||||||||||||||||
2 Ag |
for S1 and 1 Bu |
||||||||||||||||||||
|
|
1 |
|
|
|
|
|
|
|
|
|
|
|
|
|
|
|
1 |
|
|
|
The ordering that the 2 Ag excited state is located below the 1 |
|
Bu excited state is peculiar |
|||||||||||||||||||
to linear polyenes. |
|
|
|
|
|
|
|
|
|
|
|
|
|
|
|
|
|
|
|
|
|
|
|
|
|
|
|
|
|
|
|
|
|
|
|
|
|
|
|
|
Antibonding |
|
|
|
|
|
|
|
|
|
|
|
|
|
|
|
|
|
|
|
|
|
|
|
|
|
|
|
|
|
|
|
|
|
|
|
|
|
|
|
|
|
|
|
|
|
|
|
LUMO+1 |
|
|
|
|
|
|
|
|
|
|
|
|
|
|
|
|
|
orbitals |
|
|
|
|
|
|
|
|
|
|
|
|
|
|
|
|
|
|
|
|
|
|
||
|
|
|
|
|
|
|
|
|
|
|
|
|
|
|
|
|
|
|
|
|
|
|
|
|
|
|
|
|
|
|
|
|
|
|
|
|
|
|
|
|
|
|
|
|
LUMO |
|
|
|
|
|
|
|
|
|
|
|
|
|
|
|
|
|
|
|
|
|
|
|
|
|
|
|
|
|
|
|
|
|
|
|
|
|
|
|
|
|
|
|
|
|
|
|
|
|
|
|
|
|
|
|
|
|
|
|
|
|
|
|
|
|
|
|
|
|
|
|
|
|
|
|
|
|
|
|
|
|
|
|
|
|
|
|
HOMO |
|
|
|
|
|
|
|
|
|
|
|
|
|
|
|
|
|
Bonding |
|
|
|
|
|
|
|
|
|
|
|
|
|
|
|
|
|
|
|
|
|
|
||
|
|
|
|
|
|
|
|
|
|
|
|
|
|
|
|
|
|
|
|
||
|
|
|
|
|
|
|
|
|
|
|
|
|
|
|
|
|
|
|
|
||
|
|
|
|
|
|
|
|
|
|
|
|
|
|
|
|
|
|
|
|
||
|
|
|
|
|
|
|
|
|
|
|
|
|
|
|
|
|
|
|
|
|
|
|
|
|
|
|
|
|
|
|
|
|
|
|
|
|
|
|
|
|
|
|
|
|
|
|
|
|
|
|
|
|
|
|
|
|
|
|
|
|
|
|
|
|
|
|
|
|
|
|
|
|
|
|
|
|
|
|
|
|
|
|
|
|
|
|
|
|
|
|
|
|
|
|
|
|
|
|
|
|
|
|
|
|
|
|
|
|
|
|
|
|
|
|
|
|
|
|
|
|
|
|
|
|
|
|
|
|
|
|
|
|
|
|
|
|
|
|
|
|
|
|
|
|
|
|
|
|
|
|
orbitals |
|
|
|
|
|
|
|
|
|
|
|
|
|
|
|
|
|
|
|
|
|
|
|
|
|
|
|
|
|
|
|
|
|
|
|
|
|
|
|
|
|
|
|
|
|
|
|
|
|
|
|
|
|
|
|
|
|
|
|
|
|
|
|
|
|
|
|
|
|
|
|
|
|
|
|
|
|
|
|
|
|
|
|
|
|
|
|
|
|
|
|
|
|
|
|
|
|
|
|
|
|
|
|
|
|
|
|
|
|
|
|
|
|
|
|
|
|
|
|
|
|
|
|
|
|
|
|
|
|
|
|
|
|
|
|
|
|
|
|
|
|
|
|
|
|
|
|
|
|
|
|
|
|
|
|
|
(a) |
(b) |
(c) |
(d) |
FIGURE 2. Some configurations describing the low-energy singlet states of linear polyenes

5. Ultraviolet/visible, infrared and Raman spectra |
155 |
TABLE 1. Observed absorption maxima ( max) and molar absorption coefficients (ε) of unsubstituted all-trans-polyenes
NC C |
|
max/nm (ε/103 l mol 1 cm 1) |
Solvent |
Reference |
|||
D |
|
|
|
|
|
|
|
2 |
218.5 (23.0) |
|
|
|
cyclohexane |
30 |
|
3 |
268 |
(34.6), 257 (42.7), 248 (30.5) |
|
iso-octane |
29 |
||
4 |
303 |
(53), 289 (54.3), 276 (37), 264 (19.9) |
95% ethanol |
31 |
|||
5 |
334 |
(121), 317 |
(115), 303 |
(71.2), 290 |
(37.1) |
iso-octane |
29 |
6 |
364 |
(138), 344 |
(127), 328 |
(73.2), 313 |
(37.3) |
iso-octane |
29 |
8 |
410 |
(108), 386 |
(112), 367 |
(72.8), 349 |
(35.8) |
iso-octane |
29 |
10 |
447, 420, 397, 376 |
|
|
iso-octane |
29 |
||
|
|
|
|
|
|
|
|
TABLE 2. Observed absorption maxima ( max) and molar absorption coefficients (ε) of all-trans-˛,ω-dimethylpolyenes
NC C |
max/nm (ε/103 l mol 1 cm 1) |
Solvent |
Reference |
|
D |
|
|
|
|
2 |
226.5 (24.0) |
cyclohexane |
30 |
|
3 |
274.5 (30.2) |
hexane |
32 |
|
4 |
310 |
(76.5) |
hexane |
32 |
5 |
341 |
(122) |
hexane |
32 |
6 |
380 |
(146.5) |
chloroform |
32 |
7 |
398 |
(52.5), 375 (56.2), 355 (33.9) |
dichloromethane |
33 |
8 |
420 |
(53.7), 395 (56.2), 375 (36.3) |
dichloromethane |
33 |
9 |
443 |
(58.9), 416 (63.1), 393 (43.7) |
dichloromethane |
33 |
10 |
460 |
(39.8), 431 (60.3), 406 (36.3) |
dichloromethane |
33 |
|
|
|
|
|
TABLE 3. Observed absorption maxima ( max) and molar absorption coefficients (ε) of all-trans-˛,ω-dibutylpolyenes34
NC C |
max/nm (ε/103 l mol 1 cm 1) |
Solvent |
D |
|
|
2 |
237.2, 227.8, 219.8 |
n-pentane |
3 |
275.6, 264.8, 255.6 |
n-pentane |
4 |
311.4, 297.4, 284.8, 274.6 |
n-pentane |
5 |
343.0, 325.8, 311.0, 297.8 |
n-pentane |
6 |
371.2, 351.0, 334.2, 319.0 |
n-pentane |
7 |
396.2, 373.6, 355.6, 338.0 |
n-pentane |
8 |
418.8, 394.0, 374.0, 354.2 |
n-pentane |
|
432 (111), 406 (103), 384 (643) |
dichloromethane |
9 |
438.8, 411.2, 390.2, 371.8 |
n-pentane |
|
452 (114), 424 (101), 402 (65) |
dichloromethane |
10 |
456.4, 427.8, 405.2, 382.6 |
n-pentane |
11 |
468.8, 439.4, 414.4, 393.4 |
n-pentane |
13 |
494, 462, 438, 412 |
n-pentane |
|
|
|
B. Ultraviolet/Visible Absorption Spectra
The absorption bands or peaks reported for the all-trans conformers of unsubstituted polyenes29 31, ˛,ω-dimethylpolyenes30,32,33, ˛,ω-di-tert-butylpolyenes34, ˛,ω-diphenyl- polyenes35,36 and ˛,ω-dithienylpolyenes37 are complied in Tables 1 5, respectively. The data for carotenoids are described in a previous review38. These absorptions are attributed
to the 1 |
1 |
1 |
1 |
|
transitions ( |
|
Ł transitions). |
Bu |
|
Ag |
|
||||
|
|

156 Yukio Furukawa
TABLE 4. Observed absorption maxima ( max) and molar absorption coefficients (ε) of all-trans- ˛,ω-diphenylpolyenes in benzene36
NC C |
max/nm (ε/103 l mol 1 cm 1) |
D |
|
1319 (21.7), 306 (24.3), 294 (23.5)
2352 (26.1), 334 (40.0), 316 (30.4)
3377 (52.1), 358 (74.7), 343 (54.3)
4404 (76.9), 384 (86.0), 363 (58.2)
5424 (88.6), 403 (93.8), 387 (60.8)
6445 (109), 420 (113), 400 (76.4)
7465 (122), 435 (135), 413 (86.9)
TABLE 5. Observed absorption maxima ( max) of all-trans-˛,ω-dithienyl- polyenes in dichloromethane37
NCDC |
max nm |
|
3 |
404, 382, 364 |
|
4 |
426, 402, 380 |
|
5 |
443, 416, |
395 |
6 |
461, 432, |
409 |
|
|
|
As a typical example of polyene spectroscopy, absorption and fluorescence spectra39 of trans,trans-1,3,5,7-octatetraene in hexane at 23 °C are shown in Figure 3. An absorption band with several peaks is observed in Figure 3a. It should be noted that the positions of electronic absorption bands strongly depend on solvents1,2. This absorption band is dipole allowed, because the molar absorption coefficient of this band is very large (Table 1).
This band is attributed to the transition from the 1 |
1 |
ground state to the 1 |
1 |
excited |
Ag |
Bu |
state Ł transition). Although the absorption peaks are due to vibrational transitions, a precise vibrational analysis cannot be made because of the broad band widths. The position of the observed emission spectrum (Figure 3b) shows a considerable red shift in
Absorbance
(a) |
(b) |
280 |
320 |
360 |
400 |
440 |
480 |
|
|
Wavelength (nm) |
|
|
|
Emission
FIGURE 3. (a) Absorption and (b) fluorescence spectra of trans,trans-1,3,5,7-octatetraene in hexane at 23 °C. Reproduced by permission of American Institute of Physics from Reference 39
5. Ultraviolet/visible, infrared and Raman spectra |
157 |
comparison with the position of the absorption spectrum. In other words, a large Stokes
shift is observed. This emission band is due to the transition from the 2 |
1 |
excited state to |
|||
Ag |
|||||
the 1 |
1 |
ground state. The absorption band associated with the 2 |
1 |
1 |
Ag transition is |
Ag |
Ag |
|
|||
not observed, because this absorption is expected to be extremely weak. These assignments of the absorption and emission spectra have been confirmed by the following experiments. In oneand two-photon excitation spectra of trans,trans-1,3,5,7-octatetraene in n-octane at 4.2 K (not shown), fine structures are observed, and these vibronic bands have been
analysed |
40 |
|
|
|
|
|
|
|
|
|
|
|
|
|
|
|
|
|
1 |
|
|
|
. As a result, it has been shown that the 0 |
|
0 transition between the 2 |
Ag and |
|||||||||||||||
|
|
|
||||||||||||||||||
1 |
|
|
|
|
|
|
|
|
|
1 |
|
|
|
|
|
|
|
|
|
1 |
1 Ag states is observed at 28561 cm |
|
(350 nm) and the 0 |
|
0 transition between the 1 Bu |
||||||||||||||||
|
|
|||||||||||||||||||
1 |
|
states is observed at 32100 cm |
1 |
(312 nm). |
|
|
|
|||||||||||||
and 1 Ag |
|
|
|
|
||||||||||||||||
|
|
|
|
2,41,42 |
|
|
|
|
|
|
|
|
1 |
1 |
|
|
||||
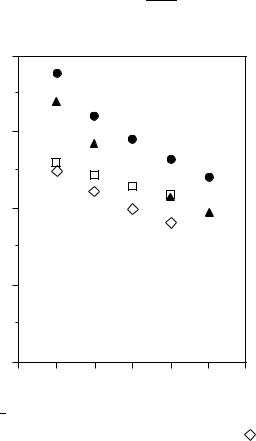
The reported |
|
0 |
|
0 transition energies associated with the 2 Ag and 1 |
Bu |
excited |
||||||||||||||
|
|
|||||||||||||||||||
states are plotted against N |
|
in Figure 4. The transition energy for the 2 |
1 |
|
excited |
|||||||||||||||
CDC |
A |
g |
||||||||||||||||||
|
|
|
|
|
|
|
|
|
|
1 |
|
|
|
|
|
|
|
|
||
state is always lower than that for the 1 Bu |
state for each polyene. The transition energy |
|||||||||||||||||||
for a series of excited states decreases with increasing number of CDC bonds (NCDC). The
observed 1 |
1 |
1 |
1 |
(0 |
|
0) transition energy, En, has been fitted by equation 9 |
34,43 |
: |
Bu |
Ag |
|
|
|||||
|
|
Transition Energy (103 cm−1)
k |
|
En eV D E1 C NCDC |
9 |
40
30
20
10
0
2 |
3 |
4 |
5 |
6 |
7 |
8 |
|
|
|
NC=C |
|
|
|
FIGURE 4. Observed 0 0 electronic transition energies (cm 1) of linear polyenes2,41,42: ž, 1 1Bu
1 |
1 |
and , 2 |
1 |
1 |
1 |
1 |
1 |
1 |
and |
, 2 |
1 |
1 |
Ag |
Ag |
Ag for unsubstituted polyenes; , 1 |
Bu |
Ag |
Ag |
1 Ag for |
˛,ω-diphenylpolyenes

158 Yukio Furukawa
where E1 and k are constants. From observed transition energies of ˛,ω-dibutylpolyenes
(Table 3), E |
1 |
and k are determined to be about 1.56 and 9.5 eV |
in carbon disul- |
|
|
|
34 |
. The differences |
|
phide, respectively, and about 1.79 and 9.4 eV in pentane, respectively |
|
|||
between these estimated values come from the fact that the observed transition energies
are sensitive to solvents. Equation 9 suggests that the 1 |
1 |
transition energy approaches |
Bu |
a finite limit (E1 ) at infinite chain length. A trans-polyacetylene film prepared from the polymerization of acetylene shows a very broad absorption band in the visible region; the peak of the absorption is 1.95 eV and the edge of the absorption is 1.4 eV44. The E1 values, 1.56 and 1.79 eV, estimated from the data of ˛,ω-dibutylpolyenes are not in good agreement with the absorption edge, 1.4 eV, of trans-polyacetylene.
IV. VIBRATIONAL SPECTRA
A. Butadiene
1. s-Trans conformer
1,3-Butadiene (CH2DCH CHDCH2) has two CDC bonds and one C C bond. It has been shown experimentally that the most stable rotamer has the planar s-trans structure45 47. The lengths of the CDC and C C bonds are 1.341 and 1.463 A,˚ respectively47. The infrared and Raman spectra of 1,3-butadiene in the vapour, liquid and solid phases have been studied48 51. The spectra of deuterated51 55 and 13C-substituted56 analogs have been studied for the purpose of the assignments of vibrational spectra. On the basis of these vibrational spectra, normal coordinate calculations have been performed by the use of empirical force fields54 60. The structure and vibrational frequencies of the s-trans conformer have been calculated by ab initio MO methods61 65. The assignments of all the fundamental bands have been established.
The s-trans conformer of 1,3-butadiene belongs to C2h symmetry. There are 24 normal modes: 9ag C 4au C 3bg C 8bu. The ag and bu modes are the in-plane vibrations, while the au and bg modes are the out-of-plane vibrations; the vibrations of ag and bg are Raman active and the vibrations of au and bu are infrared active. The observed and calculated vibrational frequencies of s-trans-1,3-butadiene are listed in Table 6. Most of the frequencies calculated even at the MP2/6-311GŁ level64 (column 6) are higher than those observed (column 3); most of the frequencies calculated at the MP2/6-31GŁ level64 (not shown) are also higher than those observed. However, the frequencies obtained by a scaled MP2/6-31GŁ calculation65 (column 7) are in good agreement with those observed. Vibrational modes of some strong Raman and infrared bands are as follows. The 1644cm 1 Raman band ( 4) is assigned to the vibrational mode in which two CDC bonds stretch in phase. The 1279-cm 1 Raman band ( 6) is assigned to the CH in-plane bending, and the 1206-cm 1 Raman band ( 7) to the C C stretch. The infrared bands observed at 1022 and 905 cm 1 ( 10 and 11, respectively) are assigned to the CH out-of-plane bending and CH2 wagging, respectively.
The group-coordinate force constants (not shown) obtained by an empirical method60 are in good agreement with those obtained by a scaled ab initio MO calculation at MP2/6- 31GŁ level65. Guo and Karplus64 have calculated group-coordinate force constants at the HF and MP2 levels with various basis sets (6-31G, 6-31GŁ, 6-311G and 6-311GŁ). In most cases in-plane diagonal force constants decrease by 5% 15% from the corresponding HF values when electron correlation is included via the MP2 method; the CDC stretch force constant shows an especially larger decrease (20%) with all the basis sets, whereas the C C stretch force constant shows a smaller decrease (3%) with the 6-31GŁ and 6- 311GŁ basis sets. It is noted that the CDC/C C off-diagonal force constant increases by 15% 20% with all the basis sets in going from the HF to the MP2 method.