

Physics of biomolecules and cells
.pdfE. Sackmann et al.: Physics of Composite Cell Membranes |
259 |
|||||||||||||
|
|
|
|
|
|
|
|
|
|
|
|
|
|
|
|
|
|
|
|
|
|
|
|
|
|
|
|
|
|
|
|
|
|
|
|
|
|
|
|
|
|
|
|
|
|
|
|
|
|
|
|
|
|
|
|
|
|
|
|
|
|
|
|
|
|
|
|
|
|
|
|
|
|
|
|
|
|
|
|
|
|
|
|
|
|
|
|
|
|
|
|
|
|
|
|
|
|
|
|
|
|
|
|
|
Fig. 9. a) Labelling of test filaments with colloidal beads and a magnetic force probe (=tweezer) at one chain end. The bead can be transiently pulled through the network by application of force pulses and by analyzing the bead deflection. If the bead diameter is small compared to the mesh size this experiment corresponds to microrheometry with linear force probes (cf. M. Dichtl 2001). b) Random walk of colloidal probe which reflects local motion of filament. By decoupling into component parallel and perpendicular to filament axis the mean square displacements can be measured yielding the reptation (self-) di usion coe cient and the local potential of interaction between the filament and the surrounding network. c) Time dependence of mean square displacement of colloidal bead coupled to filament in direction parallel (M SD ) and perpendicular (M SD ) to the tube direction. Note that the M SD saturates after a time τs 0.5 s while M SD increases linearly with time after τs. The slope yields the selfdi usion coe cient of the filaments along the tube direction (often called reptation). d) The e ective interaction potential determined from the distribution of the perpendicular motion P U 2 0 .
the network. This is achieved by application of Boltzmann’s law: V (U ) kBT ln P U 2 0 (cf. Dichtl & Sackmann 1999). A remarkable finding is that the width of the potential and thus the local tube diameter varies by up to a factor of two along a single filament;
2.The longitudinal mean square displacement yields the selfdi usion
coe cient (the reptation di usivity D ) of the chain along the tube axis according to
D |U (t) − U (0)|2 · (2.25) t

260 Physics of Bio-Molecules and Cells
This reptation di usion coe cient determines the terminal relaxation time τd of the viscoelastic impedance spectra since τd is determined by the time required by the filaments to escape the confinement tube by selfdi usion. For a chain of L 20 µm we determined D ≈ 10−16 m2/s which corresponds to a value of τd = 10−5 s, in good agreement with experimental data (cf. Dichtl & Sackmann 1999). The previous microfluorescence analysis yielded larger values of D (D 10−14 m2/s) (cf. K¨as et al. 1996).
3 Heterogeneous actin gels in cells and biological function
3.1 Manipulation of actin gels
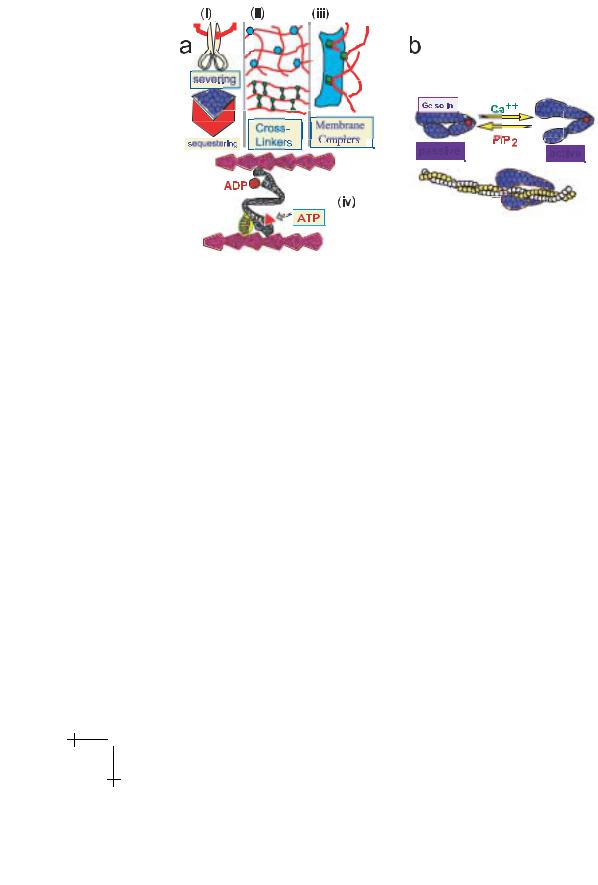
In order to manipulate the structural organization of actin networks for the multiple functions of the composite biological membranes nature uses manifold of actin regulating (or actin binding) proteins. These include:
•Severing proteins (examples: gelsolin, severin) which can cleave filaments and bind to the fast growing end, thus controlling the filament length (which varies from 0.1 to 20 µm in Dictyostelia cells; cf. Podolski & Steck 1990);
•Sequestering proteins (example: profilin) which bind actin monomers and can thus control the concentration of polymerizable actin monomers and thus the mesh size ξ;
•A manifold of crosslinking proteins which link actin filaments noncovalently and which can induce the formation of randomly crosslinked gels (α-actinin), tree-like branched gels or bundles;
•Actin membrane couplers (examples: vinculin, talin, ankyrin) which can anchor actin filaments to various membrane proteins (cf. Fig. 1).
Another key feature of actin manipulation is that the function of the manipulating proteins in cells is regulated by second messenger molecules as illustrated in Figure 10 for the severing protein gelsolin. This second messenger is activated by Ca++ and mediates the formation of soft or sol-like networks. The protein is inhibited by the phospholipid phosphatidylinositoldiphosphate (PIP2) which thus promotes gel formation. Similarly, PIP2 inhibits the activity of the sequestering protein profilin and thus decreases the mesh size while Ca++ is supposed to activate the sequestering proteins thus diluting the network (cf. Janmey 1995).
Through the second messengers the structure of the actin cortex is connected to the manifold of cell signalling processes. As will be shown below (for the case of thrombin) this provides a powerful and versatile tool to respond to external signals by structural reorganization. In this context it is
E. Sackmann et al.: Physics of Composite Cell Membranes |
261 |
||||||||
|
|
|
|
|
|
|
|
|
|
|
|
|
|
|
|
|
|
|
|
|
|
|
|
|
|
|
|
|
|
|
|
|
|
|
|
|
|
|
|
|
|
|
|
|
|
|
|
|
|
|
|
|
|
|
|
|
|
|
|
|
|
|
|
|
|
|
|
|
|
Fig. 10. a) Summary of di erent classes of actin manipulating proteins enabling the control (i) of the filament length through severing proteins; (ii) of the mesh size through sequestering proteins controlling the fraction of polymerizable G-actin; (iii) of the membrane coupling of the actin cortex and (iv) of the connectivity of the actin filaments through various cross-linkers including myosins shown at the bottom. Note that cross linkers can generate gels of distinct topology such as random networks, tree-like branched networks and bundles. b) Control of activity of actin manipulation proteins by second messengers, for example of the severing protein gelsolin. The protein is activated by Ca++ which is thus a sol-former and inhibited by binding of phosphatidyl-inositol-diphosphate (P I P2) which is thus a gel-former (cf. Janmey 1995).
highly important to note that actin filaments bind messenger-RNA and can influence its transport and translation (cf. G. Bassell & R.H. Singer 1997), which may provide a link between actin structure and genetic expression.
A central property of the cellular cytoskeleton is its ability of rapid reorganisation as demonstrated by the fast generation of actin bundles. One important example is the formation of actin stress fibers during the activation of blood platelets. In this case actin bundling leads to the formation of tentacle-like protrusions which mediates the rapid closing of wounds by self-assembly of the spider-like cells over openings of blood vessels thus impeding bleeding. A second example is the formation of gaps in endothelial cell monolayers by centripetal contraction discussed in Section 3.2.
How can such transition of actin networks be induced in the fraction of seconds or faster? One intriguing possibility is through phase transitions
262 |
|
|
|
|
Physics of Bio-Molecules and Cells |
|||||||
|
|
|
|
|
|
|
|
|
|
|
|
|
|
|
|
|
|
|
|
|
|
|
|
|
|
|
|
|
|
|
|
|
|
|
|
|
|
|
|
|
|
|
|
|
|
|
|
|
|
|
|
|
|
|
|
|
|
|
|
|
|
|
|
|
|
|
|
|
|
|
|
|
|
|
|
|
|
|
|
|
|
|
|
|
|
|
|
|
|
|
|
|
|
|
|
|
|
|
|
|
|
|
|
|
|
|
|
|
|
|
|
|
|
|
|
|
|
|
|
|
|
|
|
|
|
|
|
|
|
|
|
|
|
|
|
|
|
|
|
|
|
|
|
|
|
|
|
|
|
|
|
|
|
|
|
|
|
|
|
|
|
|
|
|
|
|
|
|
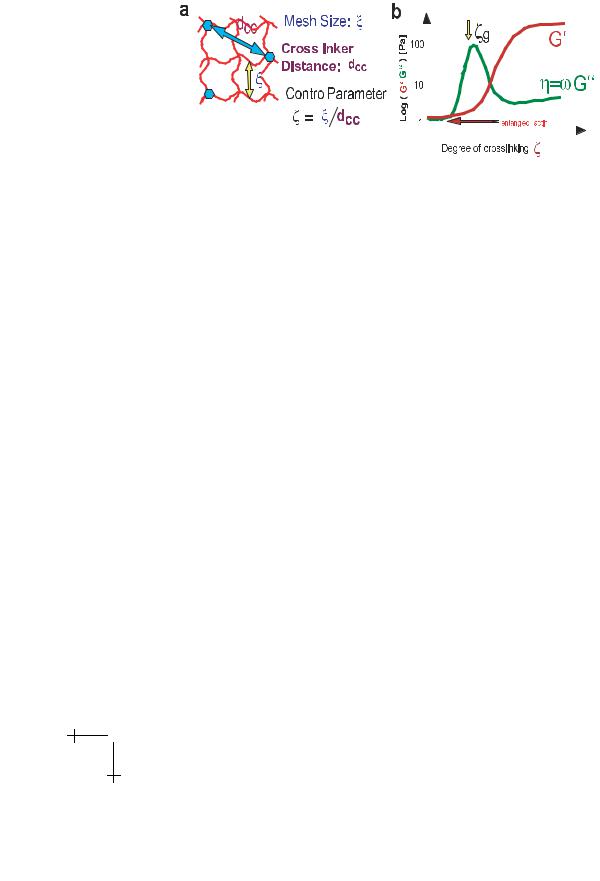
Fig. 11. a) The state of crosslinked actin networks is controlled by two length scales: the mesh size ξ and the average distance between the cross-linkers dcc. The ratio ζ = ξ/dcc is an essential parameter characterizing the degree of cross-linking. b) Variation of shear modulus G (ζ) and loss modulus G (ζ) of actin-α-actinin networks with fraction ρact of active crosslinkers. Note first, that according to equation (3.2) ρact and thus ζ increases monotonically with decreasing temperature but that the absolute value of ρact can not be determined and the quantitative relationship between ρact and ζ is not know. Note secondly, that the storage modulus G (ζ) increases abruptly by two orders of magnitude above a thresholdtemperature corresponding roughly to the value of ζg ≈ 1 (called the gel point). The loss-modulus (or the loss angle tan φ = G (ζ)/G (ζ)) diverges and exhibits a maximum at the critical value ζg while G (ζ) starts to increase sharply at ζ ≥ ζg. This behaviour is typical for a percolation transition into a gel-like state.
within actin networks as described below for actin-α-actinin networks. It is obvious that the state of cross linked actin networks is determined by two length scales: the mesh size ξ and the average distance between the crosslinkers dcc (cf. Fig. 11a). The ration ζ = ξ/dcc can thus be considered as a control parameter which determines the state of the actin network. For ζ > 1 the distance dcc is larger then the average distance between points of entanglement within the network and crosslinking occurs predominantly at these sites without changing the structure. For ζ > 1 crosslinking induces local contractions of the gel as shown in Figure 12a (thin line ζ 1).
Some crosslinkers bind weakly to actin resulting in a dynamic association-dissociation equilibrium under physiological conditions. One example is myosin II which forms an active and dynamic crosslinker in the presence of ATP (but acts as rigid connector in the absence of ATP). Another prominent example is α-actinin which is also supposed to be involved in the coupling of actin to membranes, the formation of focal complexes and the generation of filipodia and lamellipodia (cf. Lodish et al. Sect. 22).
E. Sackmann et al.: Physics of Composite Cell Membranes |
263 |
||||||||||||||||||
|
|
|
|
|
|
|
|
|
|
|
|
|
|
|
|
|
|
|
|
|
|
|
|
|
|
|
|
|
|
|
|
|
|
|
|
|
|
|
|
|
|
|
|
|
|
|
|
|
|
|
|
|
|
|
|
|
|
|
|
|
|
|
|
|
|
|
|
|
|
|
|
|
|
|
|
|
|
|
|
|
|
|
|
|
|
|
|
|
|
|
|
|
|
|
|
|
|
|
|
|
|
|
|
|
|
|
|
|
|
|
|
|
|
|
|
|
|
|
|
|
|
|
|
|
|
|
|
|
|
|
|
|
|
|
|
|
|
|
|
|
|
|
|
|
|
|
|
|
|
|
|
|
|
|
|
|
|
|
|
|
|
|
|
|
|
|
|
|
|
|
|
|
|
|
|
|
|
|
|
|
|
|
|
|
|
|
|
|
|
|
|
|
|
|
|
|
|
|
|
|
|
|
|
|
|
|
|
|
|
|
|
|
|
|
|
|
|
|
|
|
|
|
|
|
|
|
|
|
|
|
|
|
|
|
|
|
|
|
|
|
|
|
|
|
|
|
|
|
|
|
|
|
|
|
|
|
|
|
|
|
|
|
|
|
|
|
|
|
|
|
|
|
|
|
|
|
|
|
|
|
|
|
|
|
|
|
|
|
|
|
|
|
|
|
|
|
|
|
|
|
|
|
|
|
|
|
|
|
|
|
|
|
|
|
|
|
|
|
|
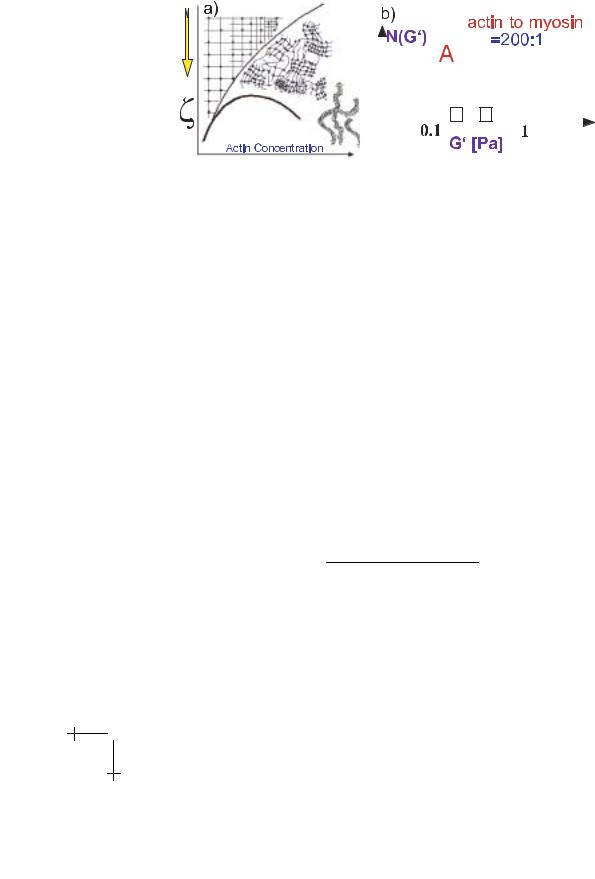
Fig. 12. a) Equivalent phase diagram of actin gels according to Tempel et al. (1996). The state of the network is determined by two parameters, the fraction of active cross-linkers ρact (or ζ) and the mesh size ξ; ξ is related to the actin concentration cA by ξ c−A1/2. The thin line defines the phase boundary of the percolation transition and the thick line defines the coexistence of bundles (or random networks) with a dilute solution. Note that the bundle state may also coexist with the heterogeneous network. Electron micrographs of the heterogeneous states can be found in Tempel et al. (1996). b) Distribution of plateau values of storage modulus of an entangled actin network (bar A) and of a network crosslinked by myosin in the rigor state (ATP depletion). The network exhibits the same microgel state as actin/α-actinin networks.
The association-dissociation equilibrium of the actin/α-actinin system
K0 |
(3.1) |
A + αA C |
is nearly balanced under physiology-like conditions. The association dissociation equilibrium can be shifted in either direction by small temperature variations since the binding energy of the α-actinin-actin complexes is of the order of kBT at 300 K (cf. Tempel et al. 1996). According to the chemical equilibrium theory the fraction of active crosslinkers is related to the actin concentration by
ρc = |
[A] K0 exp {∆H/kBT } |
(3.2) |
|
1 + [A] K0 exp {∆H/kBT } |
|||
|
|
where K0 is the prefactor of Van’t Ho ’s law of the temperature dependence of the equilibrium constant K = K0 exp {∆H/kBT }. Therefore the degree of crosslinking (expressed by ζ) can be changed reversibly by variation of the temperature around 20 ◦C.
As shown in Figure 11b the viscoelastic moduli change in a characteristic way with ζ (or T ). The loss modulus G (ζ) (expressed in terms of the loss

264 |
Physics of Bio-Molecules and Cells |
angle tan ϑ = G /G ) exhibits a broad band whereas G (ζ) starts to increase sharply by to two orders of magnitude at the distinct value of ζ = ζg ≈ 1 (or T = Tg) where the broad band of G (ζ) exhibits a maximum. This behaviour is distinct typical for percolation transitions (cf. de Gennes 1979). This analogy is further supported by the finding that the decaying branch of G (ζ) and the divergence of G (ζ) exhibit power laws
G (ζ) (ζ − ζg )t, G (ζ) (ζg − ζ)−s, |
(3.3) |
and the exponents agree roughly with theoretical predictions (cf. Tempel et al. 1996).
The viscoelastic and structural studies by electron microscopy suggest that the behaviour of the actin-α-actinin network can be described by the phase diagram of Figure 12a. If the average distance dcc between crosslinkers is considerably larger then the mesh size a homogeneous gel is formed and the shear modulus is only slightly larger than the plateau modulus of the merely entangled actin network. At ζ ≥ 1 a heterogeneous gel starts to form. It consists of domains of tightly crosslinked filaments (with mesh size ξ < ξ) which are interconnected by regions of low polymer density. At further increasing ζ well defined bundles of actin are formed which can coexist with the randomly cross-linked state. Further decreasing ζ the bundles may form an interconnected network which can have a smaller viscoelastic impedance than the heterogeneous gel.
Magnetic bead microrheometry studies of cells show that the local viscoelastic moduli of the cell cytoskeleton vary by more than an order of magnitude (cf. Bausch et al. 1999) suggesting that the intracellular scaffolds form highly heterogeneous gels such as the coexistence of randomly organized networks and bundles. The heterogel state exhibits unique features. It combines high mechanical stability with the existence of soft voids or pathways for the embeddement of intracellular compartments or the local transport by active forces in the 10 pN range (cf. Sect. 4). Another unique property of the heterogel state is that the local elasticity can be changed drastically by the formation or cleavage of a few interconnections between dense clusters or bundles – enabling e ective local switching between geland sol-like states.
The state of intracellular actin networks can also be controlled by myosin which can act either as highly dynamic linker or as stable crosslinker depending on the presence or absence of ATP, respectively. Evidence for this has been provided by studies of mutants of Dictyostelia cells lacking myosin. It has been shown that the e ective cytoplasmic viscosity G (ω) at low frequencies is much higher in the absence of myosin II than in the presence of this motor protein.
In vitro studies show that in the absence of ATP myosin II behaves similar to α-actinin and forms a heterogel consisting of starlike assemblies

E. Sackmann et al.: Physics of Composite Cell Membranes |
265 |
which are embedded within a randomly organized network. In contrast, a homogeneous network is formed in the presence of ATP. If ATP is depleted gradually in actomyosin-networks one can observe a gradual transition from a soft network to a heterogeneous gel (M. Keller and E. Sackmann, unpublished data).
A characteristic feature of the heterogeneous gel state (also called microgel state) is that it combines high mechanical stability with local softness. Measurements with magnetic tweezers show that the viscoelastic moduli vary by an order of magnitude between the dense clusters and the soft voids (cf. Fig. 12b). Strikingly similar behaviour has been observed for cytoplasms of cells such as macrophages or Dictyostelia cells (cf. Sect. 6). Thus the shear modulus in macrophages varies between 10 Pa and 600 Pa and the viscosity between 10 Pa·s and 500 Pa·s (cf. Bausch et al. 1999) strongly suggesting that the cytoplasm exhibits a similar heterogel state as the actin/α-actinin system although all three subsystems of the cytoskeleton are involved. The heterogeneity may be even more pronounced due to the composition of the cytoskeleton from the three subsystems actin, intermediate filaments and microtubuli.
In summary, the heterogel state appears to be ideally suited for the design of cells. It confers upon them high global mechanical stability while the large soft voids between densely crosslinked clusters enable the embeddement of intracellular compartments. When the hard regions form a percolated meshwork the soft regions may form a continuous networks of soft channels enabling the transport of the compartments by weak forces in the ten piconewton range generated typically by Kinesin or myosin motors. The local elasticity may be varied drastically by breakage or formation of a few bundles mediated by activation of severing or crosslinking proteins through second messengers. As will be discussed below (Sect. 6) the long range transport of compartments by relatively weak forces is further made possible by the viscoplastic e ect.
3.2 Control of organization and function of actin cortex by cell signalling
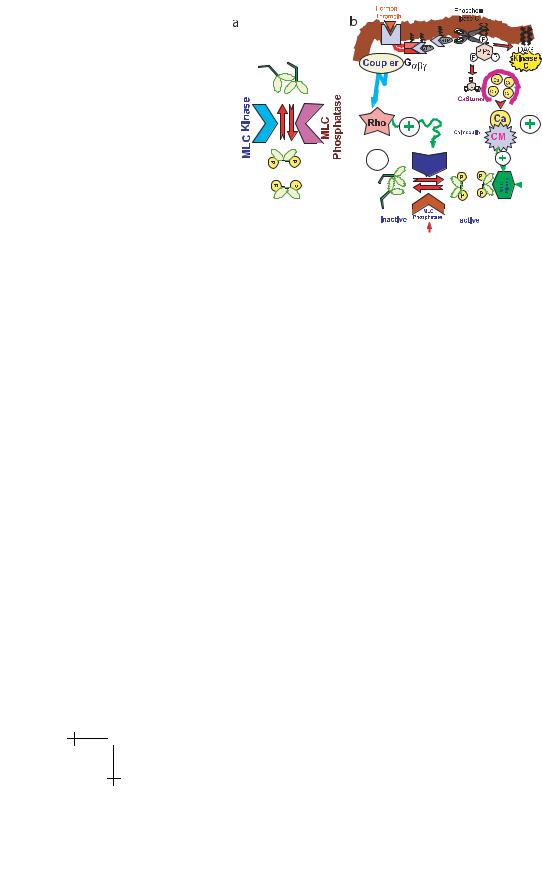
The manipulation of the structure and viscoelasticity of actin networks by the actin regulating proteins and the control of the activity of these molecules by second messengers provides the basis for the regulation of the function of the actin cortex by extrinsic signals (e.g. hormones, growth factors, inflammational agents) through intracellular signalling (cf. Fig. 13b). A simplified scheme of the signal pathways induced by thrombin which mediates the activation of myosin II by phosphorylation of chains of myosin II. This myosin light chain phosphorylation is activated by two major processes. A fast signalling pathway is based on the intracellular increase of the Ca++-level by opening of Ca++-storage vesicles through
266 |
|
|
|
Physics of Bio-Molecules and Cells |
|
|||||||||||||||||||
|
|
|
|
|
|
|
|
|
|
|
|
|
|
|
|
|
|
|
|
|
|
|
|
|
|
|
|
|
|
|
|
|
|
|
|
|
|
|
|
|
|
|
|
|
|
|
|
|
|
|
|
|
|
|
|
|
|
|
|
|
|
|
|
|
|
|
|
|
|
|
|
|
|
|
|
|
|
|
|
|
|
|
|
|
|
|
|
|
|
|
|
|
|
|
|
|
|
|
|
|
|
|
|
|
|
|
|
|
|
|
|
|
|
|
|
|
|
|
|
|
|
|
|
|
|
|
|
|
|
|
|
|
|
|
|
|
|
|
|
|
|
|
|
|
|
|
|
|
|
|
|
|
|
|
|
|
|
|
|
|
|
|
|
|
|
|
|
|
|
|
|
|
|
|
|
|
|
|
|
|
|
|
|
|
|
|
|
|
|
|
|
|
|
|
|
|
|
|
|
|
|
|
|
|
|
|
|
|
|
|
|
|
|
|
|
|
|
|
|
|
|
|
|
|
|
|
|
|
|
|
|
|
|
|
|
|
|
|
|
|
|
|
|
|
|
|
|
|
|
|
|
|
|
|
|
|
|
|
|
|
|
|
|
|
|
|
|
|
|
|
|
|
|
|
|
|
|
|
|
|
|
|
|
|
|
|
|
|
|
|
|
|
|
|
|
|
|
|
|
|
|
|
|
|
|
|
|
|
|
|
|
|
|
|
|
|
|
|
|
|
|
|
|
|
|
|
|
|
|
|
|
|
|
|
|
|
|
|
|
|
|
|
|
|
|
|
|
|
|
|
|
|
|
|
|
|
|
|
|
|
|
|
|
|
|
|
|
|
|
|
|
|
|
|
|
|
|
|
|
|
|
|
|
|
|
|
|
|
|
|
|
|
|
|
|
|
|
|
|
|
|
|
|
|
|
|
|
|
|
|
|
|
|
|
|
|
|
|
|
|
|
|
|
|
|
|
|
|
|
|
|
|
|
|
|
|
|
|
|
|
|
|
|
|
|
|
|
|
|
|
|
|
|
|
|
|
|
|
|
|
|
|
|
|
|
|
|
|
|
|
|
|
|
|
|
|
|
|
|
|
|
|
|
|
|
|
|
|
|
|
|
|
|
|
|
|
|
|
|
|
|
|
|
|
|
|
|
|
|
|
|
|
|
|
|
|
|
|
|
|
|
|
|
|
|
|
|
|
|
|
|
|
|
|
|
|
|
|
|
|
|
|
|
|
|
|
|
|
|
|
|
|
|
|
|
|
|
|
|
|
|
|
|
|
|
|
|
|
|
|
|
|
|
|
|
|
|
|
|
|
|
|
|
|
|
|
|
|
|
|
|
|
|
|
|
|
|
|
|
|
|
|
|
|
|
|
|
|
|
|
|
|
|
|
|
|
|
|
|
|
|
|
|
|
Fig. 13. a) Model of activation of myosin II by phosphorylation of its light chain (MLC) through MLC-kinase. This enzyme activates the myosin head group (S1). The kinase works in tandem with the light chain phosphorylase which dephosphorylates and thus deactivates the MLC. The activation may be accompanied by formation of microbundles (cf. Pasternak et al. 1989). b) Simplified scheme of regulation of myosin activity by various cell signalling pathways induced by the inflammational agent thrombin. There are two major pathways. A fast process (acting in the second time scale) is mediated by Ca++ which activates the MLC-kinase through calmodulin. The increase of the Ca++-level is initiated by activation of G-protein switches of the Gαβγ -family. The Gαβγ -protein binds to the inner loop of the receptor (after thrombin binding) resulting in the exchange of GDP for GTP. The α-domain is thus activated and di uses in the membrane to the phospholipase C (symbolized as scissors) which is activated and cleaves the inositol-triphosphate (I P3) form the phosphatidyl-inositol-diphosphate. I P3 induces the libration of Ca++ from storage vesicles by binding to I P3 receptors of Ca++ storage vesicles. A slower pathway (response times in the order of minutes) is mediated by a small G-protein switch of the rho-family: rhoA. The protein (activated again by GDP-GTP exchange) activates the MLC-kinase.
inositol-triphosphate (IP3). The MLC-kinase can be activated either through calmodulin-Ca++-complexes or through kinase C which is activated by diacylglycerol (DAG). Both DAG and IP3 are generated from phosphatidylinositol-diphosphate (PIP2) by phospholipase C which is activated by the extrinsic signal.
The thrombin receptor shares two common features with other hormone receptors (e.g. adrenalin) and the photon receptor rhodopsin of the visual

E. Sackmann et al.: Physics of Composite Cell Membranes |
267 |
membrane. It penetrates the membrane with seven hydrophobic α-helixes and exhibits an intracellular loop which contains a binding site for the Gαβγ - protein. Binding of the agent to the receptor induces coupling of the G- protein to the loop which is followed by exchange of GDP for GTP in the α-
domain of the Gαβγ complex. The GTP-α-domain is detached and activates the enzyme associated with the pathway (phospholipase C in the case of
thrombin). The receptor can be deactivated again by phosphorylation of the loop or by coverage by a capping proteins (arrestin in the case of rhodopsin). In this way the activity of the receptor may be switched o and the action of hormones may be downregulated.
4 Micromechanics and microrheometry of cells
Mechanics and hydrodynamics play a key role for numerous biological processes comprising the control of animal motion or the adaptive growth of plants or bones. Mechanical forces control also numerous cellular functions such as cell locomotion, phagocytosis or cell adhesion. An enlightening example is the regulation of the blood pressure through the hydrodynamic shear force exerted by the blood flow or endothelial cells. The hydrodynamic shear stress induces the generation of NO-molecules in a stress dependent manner which control the state of contraction of the smooth muscle surrounding the blood vessels (a process again activated by cell signalling pathways). The production of NO increases with increasing blood pressure (for instance induced by a decreasing diameter of the blood vessel) and this small molecule causes the relaxation of the muscles resulting in the widening of the blood vessel. The study of continuum-mechanical properties of biomaterials from macroscopic to nanoscopic scales is therefore expected to become a challenging field of future biophysical research. One example concerns the viscoelasticity of cells. Measurements of local viscoelastic parameters can yield useful and new insights into the microscopic architecture of cell envelopes or the cytoplasm and into the stimulation of cell signalling pathways by mechanical stresses. A powerful tool to study microscopic mechanical and hydrodynamical properties of cells is magnetic bead microrheometry (cf. Fig. 14). Magnetic colloidal beads are coupled to specific sites of cells such as the cell membrane, the actin based cytoskeleton or microtubuli through specific ligands, cell receptors or molecular motors. The magnetic beads are deflected by sequences of short pulses of inhomogeneous magnetic fields and the trajectories of the beads are analyzed as a function of time by particle tracking using confocal laser scanning or phase contrast microscopy combined with fast image processing (cf. Keller & Schilling 2001). Viscoelastic parameters (spring constants and viscosities) are obtained by analyzing the viscoelastic response curves (also called creep functions or

268 |
Physics of Bio-Molecules and Cells |
|||||||||
|
|
|
|
|
|
|
|
|
|
|
|
|
|
|
|
|
|
|
|
|
|
|
|
|
|
|
|
|
|
|
|
|
|
|
|
|
|
|
|
|
|
|
|
|
|
|
|
|
|
|
|
|
|
|
|
|
|
|
|
|
|
|
|
|
|
|
|
|
|
|
|
|
|
|
|
|
|
|
|
|
|
|
|
|
|
|
|
|
|
|
|
|
|
|
|
|
|
|
Fig. 14. a) Microrheometry of cell membranes and cell cytoskeleton. Magnetic beads are coupled to specific sites of the cell (cell plasma membrane, cytoskeleton, microtubuli) by functionalization with specific ligands. Viscoelastic response curves are taken by application of force pulses in the nano-Newton range and by recording the deflection as a function of time by particle tracking with fast image processing techniques (cf. Fig. 17). The advantage of the method is that pulses may be applied repeatedly to test the reproducibility of the measurement or the linearity of the response and to explore active responses of the cell to external mechanical stimuli.
retardation functions) in terms of mechanical equivalence circuits. A typical creep response curve is shown in Figure 15. It consists of three regimes: an instantaneous elastic deflection (I), a relaxation regime (II) and a region where the bead exhibits continuous flow (III).
The first step is to evaluate the viscoelastic response in terms of a simple mechanical equivalent circuit. It consists of a dashpot (friction γ◦) in series with a so-called Voigt body. The latter consists of a parallel arrangement of a spring (spring constant k◦) and a series connection of a second spring (k1) and a dashpot (γ1). The same model was introduced by Zener to account for the viscoelasticity of solids and is thus also called the standard solid model. The deflection is given by (cf. Bausch et al. 1998)
x (t) |
1 |
1 |
|
k1 |
exp − |
t |
+ |
t |
|
|
|
|
= |
|
− |
|
|
|
· |
(4.1) |
|||
F |
k◦ |
k◦ + k1 |
τ |
γ◦ |
|||||||
The last term accounts for the flow and characterizes the long time behaviour. For t → 0: x (t) = F/(k◦ + k1) and the e ective spring constant of the membrane is thus ke = k◦ + k1. The relaxation time is τ = γ1ke /k◦k1