

Emerging Tools for Single-Cell Analysis
.pdf274 |
Scanning Near-Field Optical Imaging and Spectroscopy in Cell Biology |
T A B L E 12.1. Summary of Recently Published Reports on Biological Applications of SNOM
Biological system |
References |
|
|
Cytoskeletal actin |
Hecht et al., 1997; Betzig et al., 1993 |
GFP in bacteria |
Muramatsu et al., 1996; Tamiya et al., 1997 |
DNA |
Garcia-Parajo et al., 1998; van Hulst et al., |
|
1997; Wiegräbe et al., 1997 |
Fluorescence in situ hybridization probes |
Moers et al., 1996 |
Colocalized malarial and host skeletal proteins |
Enderle et al., 1997 |
Fluorescently labeled single DNA molecules |
Ha et al., 1996 |
Phospholipid monolayers |
Hwang et al., 1995 |
Photosynthetic membranes |
Dunn et al., 1994, 1995 |
Rat cortical neurons |
Talley et al., 1996; Shiku et al., 1998 |
Fluorescently labeled myofibrils |
Seibel and Pollack, 1997 |
Cell plasma membranes |
Enderle et al., 1998; Hwang et al., 1998 |
|
|
Other groups have used SNOM to probe various biological molecules and systems; a summary of recent references is presented in Table 12.1. The biological applications of SNOM pose several challenges, including the difficulty of imaging soft samples, tracking large topographical changes, accounting for tip–sample interactions, and rationalizing resolution and contrast mechanisms. In particular, operation under water or in physiological buffer solutions, a critical requirement for realistic biological studies, poses problems for implementing the shear-force feedback technique. While some successes have been achieved (Moyer and Kammer, 1996; Keller et al., 1997; Hollricher et al., 1998; Seibel and Pollack, 1997; Hwang et al., 1998; Talley et al., 1998), imaging in an aqueous environment is still not a routine endeavor.
INSTRUMENTAL DETAILS
Our instrument was designed as a module for operation with a standard scanning probe microscope system (Nanoscope IIIa, Digital Instruments, Santa Barbara, CA) and uses uncoated fiber tips as local probes in the shared-aperture mode. In this mode the sample is locally illuminated through the fiber tip and light reflected or emitted by the sample is collected by the same fiber tip. Such tips are formed in a highly reproducible single-step heating and pulling process from telecommunication optical fibers. Although the illumination is not as well localized as with standard apertured probes, the requirement for the excitation light and the collected fluorescence to pass through the fiber tip results in an automatic alignment of the excitation/emission paths with an effective lateral imaging resolution of 150–200 nm (Courjon et al., 1990; Bielefeldt et al., 1994; Kirsch et al., 1996, 1998c). We have implemented multiple photophysical modes in our modular microscope, including (i) multiple laser sources; (ii) dual-

Instrumental Details |
275 |
F i g . 12.2. Schematic of MPIbpc SNOM system with multiple photophysical modes.
detection channels; (iii) spectrograph operation for spectral acquisition; (iv) highintensity continuous wave (cw) or pulsed excitation for multiple-photon (two-photon, three-photon) excitation (MPE); (v) various modalities for detection of FRET, and (vi) fluorescent lifetime detection in the frequency domain. A new design intended for operation in fluids is being implemented. We are also engaged in a collaborative effort for developing microstructure polymer tips for SNOM (Stürmer et al., 1998).
A schematic of the SNOM system depicting the multiple excitation and detection schemes is shown in Figure 12.2. The fiber tip is mounted in a shear-force sensor head mounted above the piezoelectric tube scanner of the Digital Instruments SPM. The sample is laterally scanned beneath the fiber tip, and a distance of 2–5 nm is
276 |
Scanning Near-Field Optical Imaging and Spectroscopy in Cell Biology |
maintained by monitoring shear-force interactions between the laterally vibrated tip and the sample surface. The scanning process is controlled by the electronics of the SPM system. In addition to one analog-to-digital converter (ADC), the electronics contains two digital pulse counters suitable for dual-channel pulse counting.
Excitation Sources. We have used multiple excitation sources (both cw and pulsed) in the SNOM. Available sources include an Ar–Kr mixed-gas laser (Performa, Spectra Physics, Mountain View, CA), a tunable HeNe laser operated primarily at 543 nm (LSTP-1010, Research Electro-Optics, Boulder, CO), a frequency-doubled cw Nd–YAG diode laser operating at 532 nm (CGL-050-L CrystaLaser, Reno, NV), and for multiphoton imaging purposes (see below) a diode-pumped, pulsed Nd–YVO4 laser (GE 100, Time Bandwidth Products, Zurich, Switzerland). For dual-color imaging and fluorescence resonance energy transfer experiments, we can simultaneously couple two different lasers into the fiber. After stabilization and spectral filtering, the light from the different laser sources is combined with appropriate dichroic mirrors to provide a suitable excitation light source for most commonly used fluorescence dyes.
Fluorescence Imaging. Typical excitation intensities for fluorescence imaging are in the range of 3 nW to 3 W. The dichroic filter in front of the beam-to-fiber coupler used for separating the fluorescence from the excitation light is easily exchangeable and is chosen according to the dye to be imaged. After additional filtering to remove residual excitation light, the fluorescence is detected with a high-quantum-efficiency single-photon-counting avalanche photodiode (APD; SPCM-AQ 131, EG&G Optoelectronics, Canada).
Emission Spectroscopy. Emission spectra can be collected by directing the fluorescence with a beam-shaping fiber optic into a spectrograph (MS125, Oriel, Stratford, CT) coupled to an intensified charge-coupled device (CCD) system (InstaSpec 5, Oriel).
Dual Detection. The detection of the emission of two dyes in doubly labeled samples is easily accomplished by inserting an additional dichroic mirror in the emission path to reflect the fluorescence from the second dye onto a second APD.
Lifetime Imaging. We have implemented detection of variations in the fluorescence lifetime by the phase modulation technique. In an alternative excitation light path the Ar–Kr laser intensity is modulated with a (standing-wave) acousto-optical modulator (AOM) at a typical frequency of 40 MHz. The phase of the modulated fluorescence signal is shifted due to the finite lifetime of the excited state of the fluorophore. The modulated fluorescence signal and the phase shift can be recorded with analog light detectors [e.g., a photomultiplier tube (PMT)] and suitable demodulation (high-frequency lock-in) electronics.
FRET. Fluorescence resonance energy transfer can be detected by changes in the fluorescence lifetime of the donor, by emission spectroscopy, or by donor and accep-

Specific Applications |
277 |
tor photobleaching methods. The last method requires selective bleaching of the acceptor in some regions of the sample followed by imaging of the donor and acceptor fluorescence and the sensitized emission of the acceptor. The dye pair fluorescein and rhodamine B is imaged quasi-simultaneously by alternating the excitation laser source synchronously with the scanning process and implementing dual detection of the fluorescence of the two dyes. During the trace motion of the sample the 488-nm line of the Ar–Kr laser is used to excite fluorescein donor and sensitized rhodamine B acceptor fluorescence, whereas during the retrace the 543-nm HeNe laser is coupled into the fiber for exciting the acceptor alone.
Multiphoton Excitation of Fluorescence. The optical transmission efficiency of uncoated fiber tips is very high, and they can withstand average light intensities on the order of several hundred milliwatts. Therefore multiphoton excitation of fluorescence is feasible with both cw and pulsed laser sources. The 647-nm laser line of the cw Ar–Kr laser is used to excite near-UV absorbing dyes like DAPI or BBI-342. The diode-pumped solid-state Nd–YVO4 laser operating at 1064 nm and emitting pulses of 7 ps length at 200 MHz repetition rate serves to excite simultaneously greenabsorbing dyes like Mitotracker in a two-photon process and near-UV-absorbing dyes like DAPI in a three-photon process (see details below).
SPECIFIC APPLICATIONS
Green Fluorescent Proteins in Cells
Green fluorescent proteins isolated from certain species of jellyfish have attracted enormous attention in recent years due to their use as reporter molecules in cell, developmental, and molecular biology. GFP can be fused to a variety of proteins without affecting their function. These proteins are expressed in vivo and thus act as remarkably versatile indicators of structure and function within cells. The GFP fusion proteins can be visualized and localized in cells and embryos using standard microscopy techniques. We have expressed, imaged, and performed site-specific spectroscopy on various mutants of GFP in bacteria and Drosophila Schneider cells and expressed in mammalian cells as a GFP–receptor construct. These mutants of the cloned GFP exhibit red-shifted excitation spectra relative to that of the wild-type protein and are efficiently excited by the 488-nm line of an argon-ion laser. Near-field spectroscopic measurements were performed by positioning the fiber tip over a region of interest and directing the collected light into a spectrograph. The near-field fluorescence spectrum corresponds closely to that obtained in a fluorimeter from a cell suspension, thereby confirming that the optical signal originated from the expressed protein (Subramaniam et al., 1997).
Figure 12.3 shows shear force topography (A), feedback error signal (B), and fluorescence (C) images of a Chinese hamster ovary (CHO) cell stably transfected with a fusion construct of the epidermal growth factor receptor (EGFR) and GFP (Brock et al., 1998), allowing visualization of the distribution of cell surface EGF receptors.

278 |
Scanning Near-Field Optical Imaging and Spectroscopy in Cell Biology |
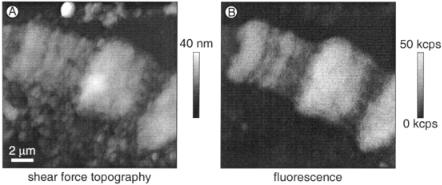
Figure 12.4 shows shear-force topography and fluorescence images of Drosophila melanogaster Schneider cells transfected with a GFP mutant optimized for expression in Drosophila. Surprisingly, instead of a homogeneous distribution, the cytosolic expressed GFP was distinctly localized in punctate structures within the cell body. The diameters of these features varied from ~150 to ~450 nm.
Photobleaching FRET on Cell Surfaces
Fluorescence resonance energy transfer between excited fluorescent donor and acceptor molecules occurs through the Förster mechanism over the range of 1–10 nm and has been used to assess the proximity of fluorophores in biological samples (for an extensive review, see Clegg, 1996). In the presence of acceptor, energy transfer is manifested by (i) a quenching of the donor emission, (ii) an increased emission of the acceptor excited via the donor (sensitized emission), (iii) a decrease in the donor photobleaching rate, and (iv) a decrease in the donor lifetime. Photobleaching methods, in which either the donor or acceptor molecules are selectively photodestructed, pro-
F i g . 12.3. Shear force topography (A), feedback error signal (B), and fluorescence (C) images of CHO cells expressing a fusion construct of the EGFR and GFP; ex 488 nm, 160 nW. See color plates.

Specific Applications |
279 |
F i g . 12.4. Shear force topography (A) and fluorescence (B, C) images of D. melanogaster Schneider cells expressing GFP. Of the three cells seen in the topographic image in (A), only one has been transfected and exhibits GFP fluorescence. (C) Zoomed image of the cell imaged in (B). The area with little fluorescence in the lower right quadrant of the transfected cell in (B) is the cell nucleus, which is devoid of GFP. An analysis of the fluorescence image in (C) reveals that the diameters of these fluorescence features vary between ~150 and ~450 nm.
vide a sensitive means for establishing and quantitating energy transfer efficiencies in cells (Bastiaens and Jovin, 1996; Bastiaens et al., 1996; Jovin and Arndt-Jovin, 1989). The photobleaching time of a fluorophore is inversely proportional to the ex- cited-state lifetime; any process such as energy transfer that shortens the lifetime will decrease the photobleaching rate. Thus, the photobleaching time constant of the donor fluorophore is expected to be longer in the presence of acceptor molecules. In the acceptor photobleaching scenario, destruction of the acceptor leads to a corresponding increase in the donor emission quantum yield (i.e., intensity). The combination of FRET and SNOM makes the length scale from 1 to 100 nm accessible, that is, a domain beyond the limit of standard optical microscopies. To demonstrate the possibility of measuring FRET with our SNOM apparatus using photobleaching approaches, we have used two systems: dye-doped polyvinylalcohol (PVA) thin films and fluorescently conjugated lectins bound to cell surface glycoproteins on 3T3 Balb/c cells (Subramaniam et al., 1998; Kirsch et al., 1999).

280 |
Scanning Near-Field Optical Imaging and Spectroscopy in Cell Biology |
Donor Photobleaching Using Labeled 3T3 Cells
The plant lectin concanavalin A (conA) binds the carbohydrate -methylmannoside, a component of several glycoproteins on mammalian cell surfaces. The 3T3 Balb/c mouse fibroblast cells were grown at 37°C on glass coverslips under standard conditions in Dulbecco’s modified Eagle’s medium (DMEM) with 10% fetal calf serum. Cells were labeled with fluorescently conjugated conA. Double-labeled cells were incubated with a mixture of fluorescein-conjugated conA (F-conA) and tetramethyl- rhodamine-conjugated conA (R-conA) and had a donor–acceptor (fluorescein– rhodamine) dye ratio of 1 : 2. Control samples (with the appropriate mixture of unlabeled conA and either F-conA or R-conA to yield label densities equivalent to those of double-labeled cells) were also examined.
Figure 12.5 shows topographic (A) and optical (B) images of 3T3 Balb/c cells labeled with a mixture of F-conA and R-conA. For this image, the sample was excited
F i g . 12.5. Shear force topography (A) and fluorescence (B) images of a 3T3 Balb/c cell labeled with fluorescein (donor)- and rhodamine (acceptor)-conjugated concanavalin A bound to cell surface receptors;
ex 488 nm, det 530 15 nm. Scan parameters: 0.3 Hz line frequency, 128 lines, 4.1 ms counting time/pixel, maximum counts/pixel 80. The accompanying plot of photobleaching kinetics (C) shows a
distinct slowing down of the donor photobleaching in the presence of acceptor, clearly demonstrating energy transfer between the F-conA and R-conA moieties bound to the cell surface. (Adapted from Subramaniam et al., 1998).
Specific Applications |
281 |
at 488 nm and fluorescence was detected with a band-pass filter centered at 530 nm (i.e., the fluorescein emission band).
After locating and imaging an appropriate cell, donor photobleaching was accomplished by disabling the slow-scan axis and repeatedly scanning a single line while delivering a high flux of 488-nm light (fluorescein absorption). Donor photobleaching curves were derived from the optical image acquired during photobleaching. Each curve presented in Figure 12.5 was calculated as an average of the photobleaching curves of six distinct bright features on the scan line. Donor photobleaching was also performed in the same manner on the control samples lacking acceptor. As can be clearly seen in Figure 12.5C, the photobleaching kinetics of the donor in the presence of the acceptor was distinctly slower than in the absence of the acceptor, as expected due to the introduction by FRET of an additional deactivation pathway shortening the lifetime of the excited state.
This demonstration of FRET using photobleaching techniques in the SNOM establishes the possibility of studying on a very localized spatial scale the interactions between a receptor–ligand pair. The capability of combining FRET and SNOM in studies of single molecules has been demonstrated with labeled DNA molecules (Ha et al., 1996). Other applications of photobleaching SNOM are presented elsewhere (Kirsch et al., 1998a). In addition, we have used FRET to assess the cell surface topology of membrane proteins against which antibodies were raised and to measure the intramolecular energy transfer between two chains of the HLA-I protein. We have elaborated a quantitative imaging microscopy technique based on measurement of fluorescence intensities by SNOM and have calculated the energy transfer efficiency on a pixel-by-pixel basis (Jenei et al., manuscript in preparation; Kirsch et al., 1999).
The extension of these techniques to study biologically relevant problems in live cellular systems involves making use of the entire repertoire of reporter molecules (dyes/proteins), including the Aequoria victoria GFP (see above). GFP mutants with different spectral properties form excellent FRET pairs; one direction of research in our laboratory involves the study of receptor–ligand interactions using GFP-labeled molecules (Brock et al., 1998).
Multiphoton Excitation and Multicolor Imaging
The excitation spectra of several biologically relevant dyes lie in the near-ultraviolet region, thereby posing serious problems for laser scanning microscopy. High-energy UV light is generally scattered and absorbed strongly by biological tissue, deteriorating image quality and inducing photodamage of living cells. Other major problems include the lack of inexpensive UV laser sources and the difficulty in producing UVtransmissive optics and objectives suitable for high-resolution imaging. Many of these problems can be bypassed by utilizing two-photon excitation (2PE) (GöppertMayer, 1931) with a long-wavelength (visible or near-infrared) source, in which a molecule simultaneously absorbs two photons in a single quantum event. The emission induced by this nonlinear excitation process is indistinguishable from the characteristic fluorescence following single-photon excitation (1PE) (Xu and Webb,
282 |
Scanning Near-Field Optical Imaging and Spectroscopy in Cell Biology |
1996; Curley et al., 1992). 2PE-based fluorescence microscopy has found widespread use since its introduction in 1990 (Denk et al., 1990, 1995; Bennett et al., 1996; Köhler et al., 1997; Svoboda et al., 1997; Masters et al., 1997; Summers et al., 1996; Potter et al., 1996; König et al., 1996), due to intrinsic advantages such as the ability to excite near-UV dyes, three-dimensional resolution without confocal (pinhole) detection, and suppression of photobleaching and fluorescence background outside the focal plane. These circumstances reflect the quadratic dependence of the excitation, restricting the probe volume to a small region around the focus.
The signal of 2PE and three-photon excitation (3PE) fluorophores is proportional to the time-averaged square and cube, respectively, of the excitation light intensity and is thus enhanced by the use of repetitive short laser pulses. For lasers emitting pulses of length at a repetition rate f, the increase of the 2PE fluorescence signal relative to a cw source with the same average power is ~ 1/ f (Denk et al., 1995). In 3PE, the corresponding factor scales as 1/( f )2 (Schrader et al., 1997; Xu et al., 1996). The 2PE boost factor value can be 5 104 ( 250 fs, f 80 MHz) for a typical femtosecond Ti–sapphire laser system and has led to the general use of femtosecond laser systems in multiphoton laser scanning microscopy (Denk et al., 1990; Wokosin et al., 1996). Unfortunately, such systems are technically complex and expensive. However, 2PE microscopy can also be implemented with cw lasers, which are in general cheaper and more readily available than femtosecond pulsed devices (Booth and Hell, 1998; Hänninen et al., 1994). To achieve signal levels similar to those attained with femtosecond pulsed lasers, the time-averaged cw intensity has to be increased over the average intensity in the pulsed case by the factor 1/ f, leading to an average excitation intensity of several hundred milliwatts, which can be delivered easily by many cw laser systems. The peak power is decreased by the same factor, thus shifting the potential limitations of the 2PE technique from nonlinear to linear phenomena (Schönle and Hell, 1998). A compromise between such femtosecond Ti–sapphire systems and 2PE based on cw laser systems of higher average power but consequently limited by sample stability is provided by solid-state picosecond lasers. For a picosecond laser with 7 ps and
F i g . 12.6. Shear force topopgraphy (A) and cw 2PE-excited fluorescence (B) images of D. melanogaster polytene chromosomes labeled with DAPI. Scan parameters: 2.5 s/line, 256 points, 4.1 ms counting time per pixel, excitation: 92 mW at 647 nm. (Adapted from Kirsch et al., 1998c.)

Specific Applications |
283 |
T A B L E 12.2. Results of Fit to Power Curve F dIef for Different Near-UV Absorbing Dyesa
Dye |
e |
|
|
DAPI |
1.88 0.18 |
BBI-342 |
1.90 0.09 |
EtBr |
1.91 0.02 |
Symbols: a F, fluorescence; I, excitation intensity; e, order of the process; f, independent background signal; d, proportionality constant.
f 200 MHz (characteristic of the laser used in this study), the 1/ f boost factor is ~700. In order to achieve signal levels in 2PE similar to those attained by femtosecond laser systems, the average power of the excitation in the picosecond case thus has to be increased by the modest factor of ~ 8, resulting in average power levels of ~ 10–40 mW (Bewersdorf and Hell, 1998).
We have implemented both cw and picosecond pulsed multiphoton excitation in our SNOM, permitting the imaging of near-UV dyes and simultaneous, cross-talk- free twoand three-photon imaging, respectively.
Continuous-Wave Two-Photon Imaging. The 647-nm emission of an Ar–Kr mixed-gas laser was coupled into the SNOM and used to excite the UV-absorbing DNA dyes DAPI, the bisbenzimidazole Hoechst 33342 (BBI-342), and the intercalating dye ethidium bromide, which also absorbs in the visible range. Polytene chromosomes of D. melanogaster and the nuclei of 3T3 Balb/c cells labeled with these dyes were readily imaged. Figure 12.6 depicts shear force topography and 2PE fluorescence images of a Drosophila polytene chromosome. Cellular debris from the squashing procedure is clearly seen in the topographic image, but it does not contribute to the optical image, which is due solely to fluorescence of DNA-bound DAPI.
The multiphoton origin of the detected fluorescence was confirmed by measuring the fluorescence intensity as a function of excitation power, which showed the expected (second-order) dependence on the excitation power in the range of 8–180 mW (Table 12.2).
We also measured the fluorescence intensity as a function of the tip-sample displacement in the direction normal to the sample surface in the single (1PE) and 2PE modes. In 2PE, the fluorescence intensity decayed faster than for 1PE. That is, the thickness of the surface layer contributing to the fluorescence signal is much smaller in the case of 2PE than with 1PE. This result has profound implications for the potential uses of 2PE SNOM.
Picosecond Pulsed Multiphoton Imaging. We have also implemented pulsed picosecond multiphoton excitation in the SNOM using a solid-state Nd–YVO4 laser emitting at 1064 nm. With this system we have achieved simultaneous three-photon excitation of near-UV-absorbing fluorophores and 2PE of dyes excitable in the visible green range in the SNOM. This combination of multiphoton excitations offers the