

новая папка / CourseWork / MxPSER_CW_Приложения
.doc
Приложение 3


Приложение 4


Приложение 5


Приложение 6


Приложение 7


Приложение 8

Приложение 9


Приложение 10


Приложение 11


Приложение 12


Приложение 13


Приложение 14
Национальный доход.
MODEL PROGRAM A1=0 A2=0 .
COMPUTE PRED_ = EXP(A1 * t0) * (k **A2 )* (l **(1 - A2) ).
Nonlinear Regression Summary Statistics Dependent Variable Y
Source DF Sum of Squares Mean Square
Regression 2 416364678,863 208182339,432
Residual 28 908020,44287 32429,30153
Uncorrected Total 30 417272699,306
(Corrected Total) 29 33528996,3463
R squared = 1 - Residual SS / Corrected SS = ,97292
Asymptotic 95 %
Asymptotic Confidence Interval
Parameter Estimate Std. Error Lower Upper
A1 -,000351202 ,001244983 -,002901434 ,002199031
A2 ,871540956 ,006447379 ,858334098 ,884747814
Asymptotic Correlation Matrix of the Parameter Estimates
A1 A2
A1 1,0000 -,9452
A2 -,9452 1,0000
Инвестиции.
MODEL PROGRAM A1=0 .
COMPUTE PRED_ = A1 * (y - tax).
Nonlinear Regression Summary Statistics Dependent Variable I
Source DF Sum of Squares Mean Square
Regression 1 10379875,5406 10379875,5406
Residual 29 152332,20182 5252,83455
Uncorrected Total 30 10532207,7425
(Corrected Total) 29 1060729,77362
R squared = 1 - Residual SS / Corrected SS = ,85639
Asymptotic 95 %
Asymptotic Confidence Interval
Parameter Estimate Std. Error Lower Upper
A1 ,204788602 ,004606877 ,195366482 ,214210723
Потребительский спрос.
MODEL PROGRAM A1=0 .
COMPUTE PRED_ = A1 * (y - tax).
Nonlinear Regression Summary Statistics Dependent Variable C
Source DF Sum of Squares Mean Square
Regression 1 172015050,199 172015050,199
Residual 29 160364,83065 5529,82175
Uncorrected Total 30 172175415,030
(Corrected Total) 29 15115442,9145
R squared = 1 - Residual SS / Corrected SS = ,98939
Asymptotic 95 %
Asymptotic Confidence Interval
Parameter Estimate Std. Error Lower Upper
A1 ,833667618 ,004726779 ,824000269 ,843334966
Приложение 15
Численность работающих.


Приложение 16
Ставка почасовой оплаты труда.


Приложение 17
Государственные расходы.
MODEL PROGRAM A1=0 A2=0 .
COMPUTE PRED_ = A1 *EXP(A2 * t0).
Nonlinear Regression Summary Statistics Dependent Variable G
Source DF Sum of Squares Mean Square
Regression 2 16073249,4361 8036624,71805
Residual 28 13121,43532 468,62269
Uncorrected Total 30 16086370,8714
(Corrected Total) 29 839070,02435
R squared = 1 - Residual SS / Corrected SS = ,98436
Asymptotic 95 %
Asymptotic Confidence Interval
Parameter Estimate Std. Error Lower Upper
A1 456,06104601 6,372396884 443,00778272 469,11430929
A2 ,027058924 ,000664752 ,025697242 ,028420606
Asymptotic Correlation Matrix of the Parameter Estimates
A1 A2
A1 1,0000 -,9223
A2 -,9223 1,0000
Предложение денег.
MODEL PROGRAM A0=0 A1=0 A2=0 A3=0 .
COMPUTE PRED_ = A0 + A1 *t0 + A2 * y * p + A3 * ir.
Nonlinear Regression Summary Statistics Dependent Variable M
Source DF Sum of Squares Mean Square
Regression 4 11341005,8074 2835251,45186
Residual 26 13549,71493 521,14288
Uncorrected Total 30 11354555,5224
(Corrected Total) 29 319238,72337
R squared = 1 - Residual SS / Corrected SS = ,95756
Asymptotic 95 %
Asymptotic Confidence Interval
Parameter Estimate Std. Error Lower Upper
A0 544,83334443 15,691854376 512,57827581 577,08841304
A1 -3,501079053 1,391312529 -6,360962914 -,641195191
A2 ,000504250 ,000049295 ,000402923 ,000605578
A3 -4,141502504 1,170966468 -6,548458550 -1,734546457
A0 A1 A2 A3
A0 1,0000 -,1573 -,0185 -,7982
A1 -,1573 1,0000 -,9381 -,2958
A2 -,0185 -,9381 1,0000 ,3274
A3 -,7982 -,2958 ,3274 1,0000
Численность трудоспособного населения.
MODEL PROGRAM A0=0 A1=0 A2=0 .
COMPUTE PRED_ = A0 + A1 *(t0 ** A2) .
Nonlinear Regression Summary Statistics Dependent Variable LN
Source DF Sum of Squares Mean Square
Regression 3 322816,80431 107605,60144
Residual 27 120,41569 4,45984
Uncorrected Total 30 322937,22000
(Corrected Total) 29 8446,33467
R squared = 1 - Residual SS / Corrected SS = ,98574
Asymptotic 95 %
Asymptotic Confidence Interval
Parameter Estimate Std. Error Lower Upper
A0 66,534507911 2,427723793 61,553230146 71,515785676
A1 4,448256590 1,122307245 2,145472337 6,751040844
A2 ,773603877 ,066001692 ,638179592 ,909028162
Asymptotic Correlation Matrix of the Parameter Estimates
A0 A1 A2
A0 1,0000 -,9537 ,9263
A1 -,9537 1,0000 -,9958
A2 ,9263 -,9958 1,0000
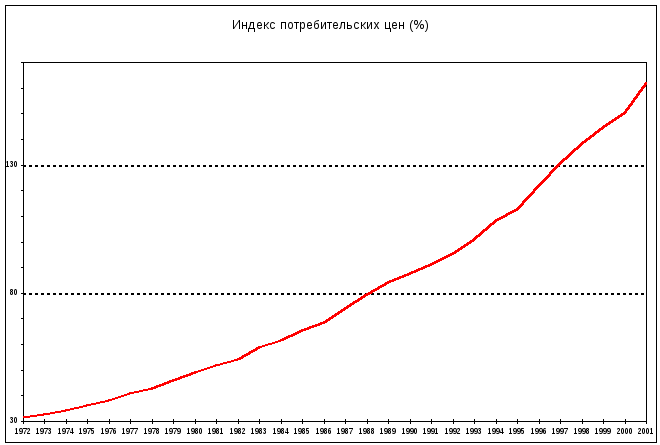
Приложение 18
Индекс потребительских цен.


Приложение 19
Средняя ставка налогообложения.
MODEL PROGRAM A1=0 A2=0 .
COMPUTE PRED_ = A1 *t0 ** A2.
Non-linear Regression
All the derivatives will be calculated numerically.
_
The following new variables are being created:
Name Label
PRED_ Predicted Values
_
Iteration Residual SS A1 A2
1 16036,12175 ,000000000 ,000000000
1.1 721,6390912 18,5695338 ,000000000
2 721,6390912 18,5695338 ,000000000
2.1 19,38229373 25,9787812 -,05176931
3 19,38229373 25,9787812 -,05176931
3.1 2,157215723 26,0396296 -,03972973
4 2,157215723 26,0396296 -,03972973
4.1 2,150803001 26,0514153 -,04012994
5 2,150803001 26,0514153 -,04012994
5.1 2,150802970 26,0512851 -,04012801
6 2,150802970 26,0512851 -,04012801
6.1 2,150802970 26,0512857 -,04012802
Run stopped after 12 model evaluations and 6 derivative evaluations.
Iterations have been stopped because the relative reduction between successive
residual sums of squares is at most SSCON = 1,000E-08
Nonlinear Regression Summary Statistics Dependent Variable R
Source DF Sum of Squares Mean Square
Regression 2 16033,97095 8016,98547
Residual 27 2,15080 ,07966
Uncorrected Total 29 16036,12175
(Corrected Total) 28 15,54594
R squared = 1 - Residual SS / Corrected SS = ,86165
Asymptotic 95 %
Asymptotic Confidence Interval
Parameter Estimate Std. Error Lower Upper
A1 26,051285692 ,210154278 25,620084732 26,482486652
A2 -,040128018 ,003060776 -,046408210 -,033847825
Asymptotic Correlation Matrix of the Parameter Estimates
A1 A2
A1 1,0000 -,9611
A2 -,9611 1,0000