

СТАТИСТИКА 1 / Международное энергетическое агентство www.IEA.org / Публикации разные / Electro_2006_10
.pdfINTERNATIONAL ENERGY AGENCY
AGENCE INTERNATIONALE DE L’ENERGIE
9, rue de la Fédération
75739 Paris CEDEX 15, France
Monthly Electricity Statistics
October 2006
The IEA's Monthly Electricity Statistics provides timely electricity production and trade data for all OECD Member Countries. It aims to report as up-to-date and consistent information as possible for the last four months. It also provides previous annual data and year-to-date indicators.
Data is at the individual country level as well as in organisational and regional groupings. These groupings include: OECD Total, OECD Europe, OECD North America, OECD Pacific and IEA Total. The units are TWh for the groupings and GWh for the single countries.
Highlights
October 2006 vs. October 2005
Total OECD production reached 792.2 TWh, an increase of 0.3% or 2.4 TWh over the same month last year.
-Combustible Fuels grew by 1.0%, increasing by 10.4% in OECD Pacific while decreasing by 0.5% in OECD North America and by 1.6% in OECD Europe.
-Nuclear production decreased by 2.2% for the OECD as a whole.
-Hydro and Geoth./Wind/Solar/Other productions grew by 0.1% and 15.0% respectively. The strongest growth of Geoth./Wind/Solar/Other production occurred in OECD Europe with 22.7%.
January-October 2006 vs. the same period in 2005
Total OECD production reached 8 330.0 TWh, an increase of 1% or 85.7 TWh over the same period last year.
-Geoth./Wind/Solar/Other shows the strongest growth at 12.8%, driven by a 17.1% growth in OECD Europe.
-Combustible Fuels grew by only 0.2%, reflecting a 1.5% decline in OECD North America.
-Nuclear and Hydro production grew by 2.3% and 1.7% respectively.
OECD Electricity Production by Fuel Type Year-to-Date Comparison
Jan-Oct 2005 |
|
Jan-Oct 2006 |
1% |
Combustible Fuels |
1% |
13% |
|
13% |
|
Nuclear |
|
22% |
Hydro |
23% |
|
||
|
64% |
63% |
|
|
|
|
Geoth./Wind/ |
|
|
Solar/Other |
|
Total = 8 244 TWh |
|
Total = 8 330 TWh |
© OECD/IEA, 2007 |
International Energy Agency |
|
MONTHLY ELECTRICITY STATISTICS, October 2006 |
CONTENTS |
|
|
Page # |
ORGANISATIONAL AND REGIONAL TABLES |
|
OECD Total |
1 |
OECD Europe |
2 |
OECD North America |
3 |
OECD Pacific |
4 |
IEA Total |
5 |
COUNTRY TABLES |
|
Australia |
6 |
Austria |
7 |
Belgium |
8 |
Canada |
9 |
Czech Republic |
10 |
Denmark |
11 |
Finland |
12 |
France |
13 |
Germany |
14 |
Greece |
15 |
Hungary |
16 |
Iceland |
17 |
Ireland |
18 |
Italy |
19 |
Japan |
20 |
Korea |
21 |
Luxembourg |
22 |
Mexico |
23 |
Netherlands |
24 |
New Zealand |
25 |
Norway |
26 |
Poland |
27 |
Portugal |
28 |
Slovak Republic |
29 |
Spain |
30 |
Sweden |
31 |
Switzerland |
32 |
Turkey |
33 |
United Kingdom |
34 |
United States |
35 |
PRINCIPLES AND DEFINITIONS |
36 |
© OECD/IEA, 2007 |
INTERNATIONAL ENERGY AGENCY |
MONTHLY ELECTRICITY STATISTICS, October 2006 - 1
OECD Total
|
|
|
|
|
|
|
|
TWh |
|
Oct-06 |
Oct-05 |
The last 3 months |
|
Year-to-Date |
Past Year |
||
|
|
% change |
Jul-06 |
Aug-06 |
Sep-06 |
Jan-Oct 2006 |
% change |
2005 |
+ Combustible Fuels |
499.9 |
1.0% |
588.2 |
587.9 |
512.5 |
5212.9 |
0.2% |
6 265 |
+ Nuclear |
180.2 |
-2.2% |
194.2 |
193.0 |
181.6 |
1879.6 |
2.3% |
2 233 |
+ Hydro |
99.7 |
0.1% |
111.6 |
103.6 |
91.4 |
1119.9 |
1.7% |
1 319 |
+ Geoth./Wind/Solar/Other |
12.4 |
15.0% |
11.6 |
11.8 |
12.2 |
117.6 |
12.8% |
127 |
= Indigenous Production |
792.2 |
0.3% |
905.6 |
896.3 |
797.6 |
8330.0 |
1.0% |
9 944 |
+ Imports |
36.8 |
2.8% |
34.7 |
34.5 |
33.1 |
355.9 |
3.9% |
416 |
- Exports |
35.7 |
3.1% |
33.8 |
33.5 |
32.2 |
344.9 |
3.5% |
405 |
|
|
|
|
|
|
|
|
|
= Electricity Supplied |
793.2 |
0.3% |
906.5 |
897.2 |
798.5 |
8341.1 |
1.1% |
9 955 |
|
|
|
|
|
|
|
|
|
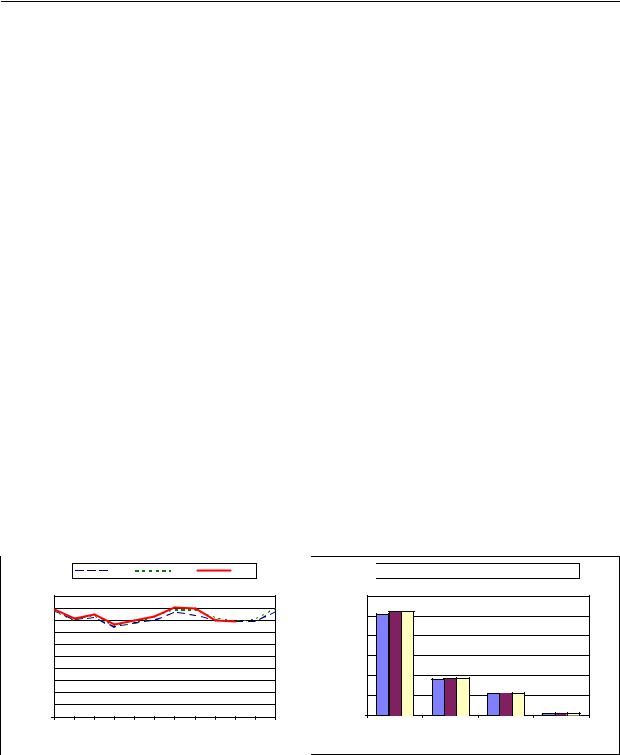
-Electricity production was 792.2 TWh in October 2006.
-This was higher by 2.4 TWh, or 0.3 %, compared to October 2005.
-This was a decrease of 5.5 TWh, or 0.7 %, compared to the previous month.
-Hydro production showed the most significant percentage change compared to the previous month with an increase of 9.1 %, or 8.3 TWh.
-Total production for the year-to-date was 8 330.0 TWh. Comparing this to the same period last year shows that:
-Total production was higher by 85.7 TWh, or 1 %.
-Geoth./Wind/Solar/Other production showed the largest percentage change by fuel type, being 12.8 % higher.
-Net trade was lower by 1.5 TWh, or 16.2 %.
Electricity Production Compared to Previous Year |
'Year to Date' Comparison of Production by Fuel Type |
|
|
|
|
2004 |
|
|
2005 |
|
|
2006 |
|
|
|
1 000 |
|
|
|
|
|
|
|
|
|
|
|
|
900 |
|
|
|
|
|
|
|
|
|
|
|
|
800 |
|
|
|
|
|
|
|
|
|
|
|
|
700 |
|
|
|
|
|
|
|
|
|
|
|
TWh |
600 |
|
|
|
|
|
|
|
|
|
|
|
500 |
|
|
|
|
|
|
|
|
|
|
|
|
400 |
|
|
|
|
|
|
|
|
|
|
|
|
|
|
|
|
|
|
|
|
|
|
|
|
|
|
300 |
|
|
|
|
|
|
|
|
|
|
|
|
200 |
|
|
|
|
|
|
|
|
|
|
|
|
100 |
|
|
|
|
|
|
|
|
|
|
|
|
Jan |
Feb |
Mar |
Apr |
May |
Jun |
Jul |
Aug |
Sep |
Oct |
Nov |
Dec |


 Jan-Oct 2004
 Jan-Oct 2005
 Jan-Oct 2006
|
6 000 |
|
|
|
|
5 000 |
|
|
|
|
4 000 |
|
|
|
TWh |
3 000 |
|
|
|
|
|
|
|
|
|
2 000 |
|
|
|
|
1 000 |
|
|
|
|
Combustible |
Nuclear |
Hydro |
Geoth./Wind/ |
|
Fuels |
|
|
Solar/Other |
COUNTRY NOTES:
OECD includes Australia, Austria, Belgium, Canada, the Czech Republic, Denmark, Finland, France, Germany, Greece, Hungary, Iceland, Ireland, Italy, Japan, Korea, Luxembourg, Mexico, the Netherlands, New Zealand, Portugal, Spain, Sweden, Norway, Poland, the Slovak Republic, Switzerland, Turkey, the United Kingdom and the United States.
© OECD/IEA, 2007 |
INTERNATIONAL ENERGY AGENCY |
MONTHLY ELECTRICITY STATISTICS, October 2006 - 2
OECD Europe
|
|
|
|
|
|
|
|
TWh |
|
Oct-06 |
Oct-05 |
The last 3 months |
|
Year-to-Date |
Past Year |
||
|
|
% change |
Jul-06 |
Aug-06 |
Sep-06 |
Jan-Oct 2006 |
% change |
2005 |
+ Combustible Fuels |
147.2 |
-1.6% |
151.7 |
138.3 |
146.8 |
1 518.0 |
2.6% |
1 821 |
+ Nuclear |
76.4 |
-2.0% |
73.6 |
71.8 |
71.6 |
771.7 |
1.4% |
931 |
+ Hydro |
38.3 |
-5.1% |
39.2 |
38.3 |
35.9 |
425.0 |
-1.6% |
520 |
+ Geoth./Wind/Solar/Other |
8.2 |
22.7% |
7.2 |
7.5 |
7.8 |
74.1 |
17.1% |
77 |
= Indigenous Production |
270.1 |
-1.6% |
271.8 |
255.9 |
262.2 |
2 788.8 |
1.9% |
3 349 |
+ Imports |
32.1 |
5.2% |
28.5 |
28.5 |
29.0 |
302.0 |
3.4% |
355 |
- Exports |
30.9 |
7.0% |
27.1 |
27.1 |
27.8 |
285.9 |
2.9% |
337 |
|
|
|
|
|
|
|
|
|
= Electricity Supplied |
271.4 |
-1.8% |
273.2 |
257.3 |
263.4 |
2 805.0 |
2.0% |
3 366 |
|
|
|
|
|
|
|
|
|
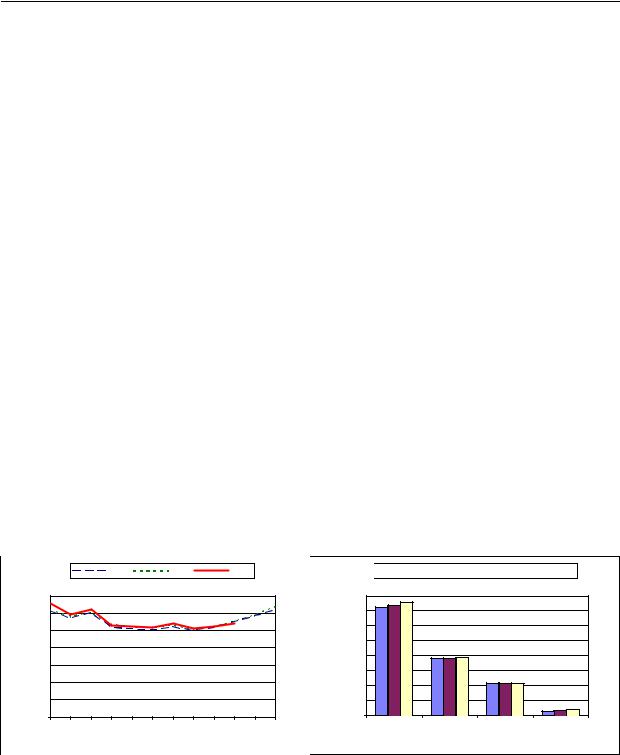
-Electricity production was 270.1 TWh in October 2006.
-This was lower by 4.5 TWh, or 1.6 %, compared to October 2005.
-This was an increase of 7.9 TWh, or 3 %, compared to the previous month.
-Hydro production showed the most significant percentage change compared to the previous month with an increase of 6.8 %, or 2.4 TWh.
-Total production for the year-to-date was 2 788.8 TWh. Comparing this to the same period last year shows that:
-Total production was higher by 52.3 TWh, or 1.9 %.
-Geoth./Wind/Solar/Other production showed the largest percentage change by fuel type, being 17.1 % higher.
-Net trade was lower by 2.0 TWh, or 13.8 %.
Electricity Production Compared to Previous Year |
'Year to Date' Comparison of Production by Fuel Type |
|
|
|
|
2004 |
|
|
2005 |
|
|
2006 |
|
|
|
350 |
|
|
|
|
|
|
|
|
|
|
|
|
300 |
|
|
|
|
|
|
|
|
|
|
|
|
250 |
|
|
|
|
|
|
|
|
|
|
|
TWh |
200 |
|
|
|
|
|
|
|
|
|
|
|
150 |
|
|
|
|
|
|
|
|
|
|
|
|
|
100 |
|
|
|
|
|
|
|
|
|
|
|
|
50 |
|
|
|
|
|
|
|
|
|
|
|
|
Jan |
Feb |
Mar |
Apr |
May |
Jun |
Jul |
Aug |
Sep |
Oct |
Nov |
Dec |


 Jan-Oct 2004
 Jan-Oct 2005
 Jan-Oct 2006
|
1 600 |
|
|
|
|
1 400 |
|
|
|
|
1 200 |
|
|
|
TWh |
1 000 |
|
|
|
800 |
|
|
|
|
600 |
|
|
|
|
|
|
|
|
|
|
400 |
|
|
|
|
200 |
|
|
|
|
Combustible |
Nuclear |
Hydro |
Geoth./Wind/ |
|
Fuels |
|
|
Solar/Other |
COUNTRY NOTES:
OECD Europe includes Austria, Belgium, the Czech Republic, Denmark, Finland, France, Germany, Greece, Hungary, Iceland, Ireland, Italy, Luxembourg, the Netherlands, Portugal, Spain, Sweden, Norway, Poland, the Slovak Republic, Switzerland, Turkey and the United Kingdom.
© OECD/IEA, 2007 |
INTERNATIONAL ENERGY AGENCY |

MONTHLY ELECTRICITY STATISTICS, October 2006 - 3
OECD North America
|
|
|
|
|
|
|
|
TWh |
|
Oct-06 |
Oct-05 |
The last 3 months |
|
Year-to-Date |
Past Year |
||
|
|
% change |
Jul-06 |
Aug-06 |
Sep-06 |
Jan-Oct 2006 |
% change |
2005 |
+ Combustible Fuels |
261.8 |
-0.5% |
343.5 |
344.0 |
273.6 |
2 764.5 |
-1.5% |
3 337 |
+ Nuclear |
69.6 |
0.1% |
81.6 |
82.0 |
75.1 |
747.6 |
2.4% |
882 |
+ Hydro |
51.5 |
3.2% |
56.6 |
51.4 |
44.2 |
576.3 |
3.8% |
670 |
+ Geoth./Wind/Solar/Other |
3.4 |
1.7% |
3.6 |
3.6 |
3.6 |
36.1 |
7.5% |
41 |
= Indigenous Production |
386.3 |
0.1% |
485.2 |
481.0 |
396.5 |
4 124.5 |
0.0% |
4 930 |
+ Imports |
4.7 |
-11.3% |
6.1 |
6.0 |
4.1 |
53.9 |
6.5% |
61 |
- Exports |
4.9 |
-16.0% |
6.7 |
6.5 |
4.4 |
59.0 |
6.7% |
68 |
|
|
|
|
|
|
|
|
|
= Electricity Supplied |
386.1 |
0.2% |
484.6 |
480.5 |
396.1 |
4 119.4 |
0.0% |
4 924 |
|
|
|
|
|
|
|
|
|
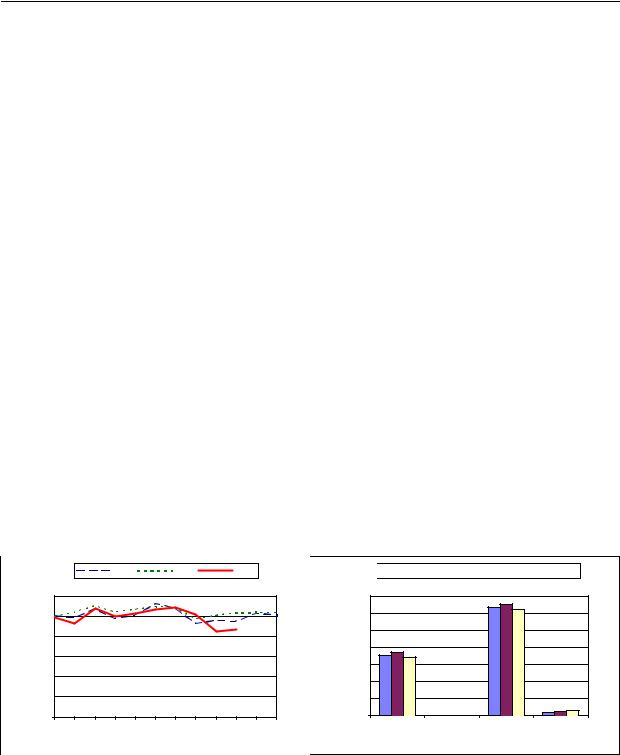
-Electricity production was 386.3 TWh in October 2006.
-This was higher by 0.3 TWh, or 0.1 %, compared to October 2005.
-This was a decrease of 10.2 TWh, or 2.6 %, compared to the previous month.
-Hydro production showed the most significant percentage change compared to the previous month with an increase of 16.3 %, or 7.2 TWh.
-Total production for the year-to-date was 4 124.5 TWh. Comparing this to the same period last year shows that:
-Total production was lower by 1.1 TWh, or 0 %.
-Geoth./Wind/Solar/Other production showed the largest percentage change by fuel type, being 7.5 % higher.
-Net trade was higher by 0.4 TWh, or 9 %.
Electricity Production Compared to Previous Year |
'Year to Date' Comparison of Production by Fuel Type |
|
|
|
|
2004 |
|
2005 |
|
|
2006 |
|
|
|
|
600 |
|
|
|
|
|
|
|
|
|
|
|
|
500 |
|
|
|
|
|
|
|
|
|
|
|
|
400 |
|
|
|
|
|
|
|
|
|
|
|
TWh |
300 |
|
|
|
|
|
|
|
|
|
|
|
|
|
|
|
|
|
|
|
|
|
|
|
|
|
200 |
|
|
|
|
|
|
|
|
|
|
|
|
100 |
|
|
|
|
|
|
|
|
|
|
|
|
Jan |
Feb |
Mar |
Apr |
May |
Jun |
Jul |
Aug |
Sep |
Oct |
Nov |
Dec |


 Jan-Oct 2004
 Jan-Oct 2005
 Jan-Oct 2006
|
3 000 |
|
|
|
|
2 500 |
|
|
|
|
2 000 |
|
|
|
TWh |
1 500 |
|
|
|
|
|
|
|
|
|
1 000 |
|
|
|
|
500 |
|
|
|
|
Combustible |
Nuclear |
Hydro |
Geoth./Wind/ |
|
Fuels |
|
|
Solar/Other |
COUNTRY NOTES:
OECD North America includes Canada, Mexico and the United States.
© OECD/IEA, 2007 |
INTERNATIONAL ENERGY AGENCY |

MONTHLY ELECTRICITY STATISTICS, October 2006 - 4
OECD Pacific
|
|
|
|
|
|
|
|
TWh |
|
Oct-06 |
Oct-05 |
The last 3 months |
|
Year-to-Date |
Past Year |
||
|
|
% change |
Jul-06 |
Aug-06 |
Sep-06 |
Jan-Oct 2006 |
% change |
2005 |
+ Combustible Fuels |
90.9 |
10.4% |
93.0 |
105.6 |
92.1 |
930.4 |
1.8% |
1 107 |
+ Nuclear |
34.1 |
-7.0% |
39.0 |
39.2 |
34.9 |
360.3 |
4.0% |
419 |
+ Hydro |
9.9 |
5.6% |
15.8 |
13.8 |
11.3 |
118.6 |
4.1% |
130 |
+ Geoth./Wind/Solar/Other |
0.8 |
5.7% |
0.8 |
0.8 |
0.8 |
7.4 |
-1.0% |
9 |
= Indigenous Production |
135.7 |
5.1% |
148.6 |
159.4 |
139.0 |
1 416.7 |
2.5% |
1 665 |
+ Imports |
0.0 |
0.0% |
0.0 |
0.0 |
0.0 |
0.0 |
0.0% |
0 |
- Exports |
0.0 |
0.0% |
0.0 |
0.0 |
0.0 |
0.0 |
0.0% |
0 |
|
|
|
|
|
|
|
|
|
= Electricity Supplied |
135.7 |
5.1% |
148.6 |
159.4 |
139.0 |
1 416.7 |
2.5% |
1 665 |
|
|
|
|
|
|
|
|
|
-Electricity production was 135.7 TWh in October 2006.
-This was higher by 6.6 TWh, or 5.1 %, compared to October 2005.
-This was a decrease of 3.2 TWh, or 2.3 %, compared to the previous month.
-Hydro production showed the most significant percentage change compared to the previous month with a decrease of 11.7 %, or 1.3 TWh.
-Total production for the year-to-date was 1 416.7 TWh. Comparing this to the same period last year shows that:
-Total production was higher by 34.4 TWh, or 2.5 %.
-Hydro production showed the largest percentage change by fuel type, being 4.1 % higher.
Electricity Production Compared to Previous Year |
'Year to Date' Comparison of Production by Fuel Type |
|
|
|
|
2004 |
|
|
2005 |
|
|
2006 |
|
|
|
180 |
|
|
|
|
|
|
|
|
|
|
|
|
160 |
|
|
|
|
|
|
|
|
|
|
|
|
140 |
|
|
|
|
|
|
|
|
|
|
|
|
120 |
|
|
|
|
|
|
|
|
|
|
|
TWh |
100 |
|
|
|
|
|
|
|
|
|
|
|
80 |
|
|
|
|
|
|
|
|
|
|
|
|
|
60 |
|
|
|
|
|
|
|
|
|
|
|
|
40 |
|
|
|
|
|
|
|
|
|
|
|
|
20 |
|
|
|
|
|
|
|
|
|
|
|
|
Jan |
Feb |
Mar |
Apr |
May |
Jun |
Jul |
Aug |
Sep |
Oct |
Nov |
Dec |


 Jan-Oct 2004
 Jan-Oct 2005
 Jan-Oct 2006
|
1 000 |
|
|
|
|
900 |
|
|
|
|
800 |
|
|
|
|
700 |
|
|
|
TWh |
600 |
|
|
|
500 |
|
|
|
|
400 |
|
|
|
|
|
|
|
|
|
|
300 |
|
|
|
|
200 |
|
|
|
|
100 |
|
|
|
|
Combustible |
Nuclear |
Hydro |
Geoth./Wind/ |
|
Fuels |
|
|
Solar/Other |
COUNTRY NOTES:
OECD Pacific includes Australia, Japan, Korea and New Zealand.
© OECD/IEA, 2007 |
INTERNATIONAL ENERGY AGENCY |

MONTHLY ELECTRICITY STATISTICS, October 2006 - 5
IEA Total
|
|
|
|
|
|
|
|
TWh |
|
Oct-06 |
Oct-05 |
The last 3 months |
|
Year-to-Date |
Past Year |
||
|
|
% change |
Jul-06 |
Aug-06 |
Sep-06 |
Jan-Oct 2006 |
% change |
2005 |
+ Combustible Fuels |
471.2 |
0.7% |
559.8 |
560.3 |
485.9 |
4 934.2 |
0.0% |
5 941 |
+ Nuclear |
178.0 |
-2.2% |
192.0 |
190.7 |
179.5 |
1 857.7 |
2.3% |
2 206 |
+ Hydro |
96.2 |
0.9% |
107.9 |
99.3 |
86.9 |
1 081.3 |
1.5% |
1 277 |
+ Geoth./Wind/Solar/Other |
11.5 |
15.2% |
11.0 |
11.1 |
11.4 |
110.4 |
13.6% |
118 |
= Indigenous Production |
756.9 |
0.2% |
870.8 |
861.3 |
763.7 |
7 983.6 |
0.9% |
9 542 |
+ Imports |
35.3 |
1.9% |
33.6 |
33.6 |
32.1 |
345.6 |
4.0% |
403 |
- Exports |
33.2 |
4.2% |
32.2 |
31.9 |
30.3 |
323.0 |
4.0% |
376 |
|
|
|
|
|
|
|
|
|
= Electricity Supplied |
759.0 |
0.1% |
872.2 |
863.0 |
765.5 |
8 006.1 |
0.9% |
9 569 |
|
|
|
|
|
|
|
|
|
-Electricity production was 756.9 TWh in October 2006.
-This was higher by 1.7 TWh, or 0.2 %, compared to October 2005.
-This was a decrease of 6.9 TWh, or 0.9 %, compared to the previous month.
-Hydro production showed the most significant percentage change compared to the previous month with an increase of 10.6 %, or 9.2 TWh.
-Total production for the year-to-date was 7 983.6 TWh. Comparing this to the same period last year shows that:
-Total production was higher by 72.9 TWh, or 0.9 %.
-Geoth./Wind/Solar/Other production showed the largest percentage change by fuel type, being 13.6 % higher.
-Net trade was lower by 0.7 TWh, or 3.4 %.
Electricity Production Compared to Previous Year |
'Year to Date' Comparison of Production by Fuel Type |
|
|
|
|
2004 |
|
|
2005 |
|
|
2006 |
|
|
|
1 000 |
|
|
|
|
|
|
|
|
|
|
|
|
900 |
|
|
|
|
|
|
|
|
|
|
|
|
800 |
|
|
|
|
|
|
|
|
|
|
|
|
700 |
|
|
|
|
|
|
|
|
|
|
|
TWh |
600 |
|
|
|
|
|
|
|
|
|
|
|
500 |
|
|
|
|
|
|
|
|
|
|
|
|
400 |
|
|
|
|
|
|
|
|
|
|
|
|
|
|
|
|
|
|
|
|
|
|
|
|
|
|
300 |
|
|
|
|
|
|
|
|
|
|
|
|
200 |
|
|
|
|
|
|
|
|
|
|
|
|
100 |
|
|
|
|
|
|
|
|
|
|
|
|
Jan |
Feb |
Mar |
Apr |
May |
Jun |
Jul |
Aug |
Sep |
Oct |
Nov |
Dec |


 Jan-Oct 2004
 Jan-Oct 2005
 Jan-Oct 2006
|
6 000 |
|
|
|
|
5 000 |
|
|
|
|
4 000 |
|
|
|
TWh |
3 000 |
|
|
|
|
|
|
|
|
|
2 000 |
|
|
|
|
1 000 |
|
|
|
|
Combustible |
Nuclear |
Hydro |
Geoth./Wind/ |
|
Fuels |
|
|
Solar/Other |
COUNTRY NOTES:
IEA includes all OECD countries except Iceland, Mexico, Poland and the Slovak Republic.
© OECD/IEA, 2007 |
INTERNATIONAL ENERGY AGENCY |

MONTHLY ELECTRICITY STATISTICS, October 2006 - 6
AUSTRALIA
GWh
|
Oct-06 |
Oct-05 |
The last 3 months |
|
Year-to-Date |
Past Year |
|
||
|
|
% change |
Jul-06 |
Aug-06 |
Sep-06 |
Jan-Oct 2006 |
% change |
2005 |
|
+ Combustible Fuels |
18 092 |
3.3% |
18 790 |
18 686 |
18 583 |
186 563 |
3.5% |
214 871 |
e |
+ Nuclear |
0 |
0.0% |
0 |
0 |
0 |
0 |
0.0% |
0 |
|
+ Hydro |
1 482 |
3.3% |
1 347 |
1 416 |
1 486 |
12 737 |
3.6% |
15 431 |
e |
+ Geoth./Wind/Solar/Other |
82 |
20.6% |
77 |
79 |
80 |
759 |
21.1% |
766 |
e |
= Indigenous Production |
19 656 |
3.3% |
20 214 |
20 181 |
20 149 |
200 059 |
3.6% |
231 068 |
e |
+ Imports |
0 |
0.0% |
0 |
0 |
0 |
0 |
0.0% |
0 |
|
- Exports |
0 |
0.0% |
0 |
0 |
0 |
0 |
0.0% |
0 |
|
|
|
|
|
|
|
|
|
|
|
= Electricity Supplied |
19 656 |
3.3% |
20 214 |
20 181 |
20 149 |
200 059 |
3.6% |
231 068 |
e |
|
|
|
|
|
|
|
|
|
|
-Electricity production was 19 656 GWh in October 2006.
-This was higher by 637 GWh, or 3.3 %, compared to October 2005.
-This was a decrease of 493 GWh, or 2.4 %, compared to the previous month.
-Combustible Fuels production showed the most significant percentage change compared to the previous month with a decrease of 2.6 %, or 491 GWh.
-Total production for the year-to-date was 200 059 GWh. Comparing this to the same period last year shows that:
-Total production was higher by 6 903 GWh, or 3.6 %.
-Geoth./Wind/Solar/Other production showed the largest percentage change by fuel type, being 21.1 % higher.
Electricity Production Compared to Previous Year |
'Year to Date' Comparison of Production by Fuel Type |
|
|
|
|
2004 |
|
|
2005 |
|
2006 |
|
||
|
25 000 |
|
|
|
|
|
|
|
|
|
|
|
|
20 000 |
|
|
|
|
|
|
|
|
|
|
|
GWh |
15 000 |
|
|
|
|
|
|
|
|
|
|
|
10 000 |
|
|
|
|
|
|
|
|
|
|
|
|
|
|
|
|
|
|
|
|
|
|
|
|
|
|
5 000 |
|
|
|
|
|
|
|
|
|
|
|
|
Jan |
Feb |
Mar |
Apr |
May |
Jun |
Jul |
Aug |
Sep |
Oct |
Nov |
Dec |


 Jan-Oct 2004
 Jan-Oct 2005
 Jan-Oct 2006
|
200 000 |
|
|
|
|
180 000 |
|
|
|
|
160 000 |
|
|
|
|
140 000 |
|
|
|
GWh |
120 000 |
|
|
|
100 000 |
|
|
|
|
80 000 |
|
|
|
|
|
|
|
|
|
|
60 000 |
|
|
|
|
40 000 |
|
|
|
|
20 000 |
|
|
|
|
Combustible |
Nuclear |
Hydro |
Geoth./Wind/ |
|
Fuels |
|
|
Solar/Other |
COUNTRY NOTES:
Total net production is estimated based on quarterly data.
The breakdown of Combustible Fuels and Hydro electricity production is estimated by the IEA Secretariat. Geoth./Wind/Solar/Other production is estimated by the IEA Secretariat.
Excludes the overseas territories.
Monthly electricity production is estimated by the IEA Secretariat for October 2006.
© OECD/IEA, 2007 |
INTERNATIONAL ENERGY AGENCY |
MONTHLY ELECTRICITY STATISTICS, October 2006 - 7
AUSTRIA
|
|
|
|
|
|
|
|
GWh |
|
Oct-06 |
Oct-05 |
The last 3 months |
|
Year-to-Date |
Past Year |
||
|
|
% change |
Jul-06 |
Aug-06 |
Sep-06 |
Jan-Oct 2006 |
% change |
2005 |
+ Combustible Fuels |
1 864 |
-10.2% |
1 468 |
1 083 |
1 182 |
17 077 |
-7.4% |
24 024 |
+ Nuclear |
0 |
0.0% |
0 |
0 |
0 |
0 |
0.0% |
0 |
+ Hydro |
2 324 |
-22.1% |
3 811 |
3 793 |
2 907 |
30 956 |
-4.8% |
37 086 |
+ Geoth./Wind/Solar/Other |
146 |
30.4% |
154 |
186 |
155 |
1 459 |
26.1% |
1 332 |
= Indigenous Production |
4 334 |
-16.2% |
5 433 |
5 062 |
4 244 |
49 492 |
-5.0% |
62 442 |
+ Imports |
2 182 |
15.4% |
1 120 |
987 |
1 756 |
16 558 |
2.9% |
20 396 |
- Exports |
1 092 |
-33.5% |
1 349 |
1 172 |
954 |
12 060 |
-19.9% |
17 733 |
|
|
|
|
|
|
|
|
|
= Electricity Supplied |
5 424 |
0.1% |
5 204 |
4 877 |
5 046 |
53 990 |
1.6% |
65 105 |
|
|
|
|
|
|
|
|
|
-Electricity production was 4 334 GWh in October 2006.
-This was lower by 836 GWh, or 16.2 %, compared to October 2005.
-This was an increase of 90 GWh, or 2.1 %, compared to the previous month.
-Combustible Fuels production showed the most significant percentage change compared to the previous month with an increase of 57.7 %, or 682 GWh.
-Total production for the year-to-date was 49 492 GWh. Comparing this to the same period last year shows that:
-Total production was lower by 2 613 GWh, or 5 %.
-Geoth./Wind/Solar/Other production showed the largest percentage change by fuel type, being 26.1 % higher.
-Net trade was lower by 3 469 TWh, or 337.1 %.
Electricity Production Compared to Previous Year |
'Year to Date' Comparison of Production by Fuel Type |
|
|
|
|
2004 |
|
2005 |
|
2006 |
|
|||
|
6 000 |
|
|
|
|
|
|
|
|
|
|
|
|
5 000 |
|
|
|
|
|
|
|
|
|
|
|
|
4 000 |
|
|
|
|
|
|
|
|
|
|
|
GWh |
3 000 |
|
|
|
|
|
|
|
|
|
|
|
|
|
|
|
|
|
|
|
|
|
|
|
|
|
2 000 |
|
|
|
|
|
|
|
|
|
|
|
|
1 000 |
|
|
|
|
|
|
|
|
|
|
|
|
Jan |
Feb |
Mar |
Apr |
May |
Jun |
Jul |
Aug |
Sep |
Oct |
Nov |
Dec |


 Jan-Oct 2004
 Jan-Oct 2005
 Jan-Oct 2006
|
35 000 |
|
|
|
|
30 000 |
|
|
|
|
25 000 |
|
|
|
GWh |
20 000 |
|
|
|
15 000 |
|
|
|
|
|
10 000 |
|
|
|
|
5 000 |
|
|
|
|
Combustible |
Nuclear |
Hydro |
Geoth./Wind/ |
|
Fuels |
|
|
Solar/Other |
COUNTRY NOTES:
Monthly submission of indigenous production is broken down by sources by the IEA Secretariat.
Revision of the Combustible Fuels, Hydro, and Geoth./Wind/Solar/Other production data for September 2006.
© OECD/IEA, 2007 |
INTERNATIONAL ENERGY AGENCY |

MONTHLY ELECTRICITY STATISTICS, October 2006 - 8
BELGIUM
|
|
|
|
|
|
|
|
GWh |
|
Oct-06 |
Oct-05 |
The last 3 months |
|
Year-to-Date |
Past Year |
||
|
|
% change |
Jul-06 |
Aug-06 |
Sep-06 |
Jan-Oct 2006 |
% change |
2005 |
+ Combustible Fuels |
2 942 |
-3.0% |
2 962 |
2 592 |
2 808 |
28 806 |
-1.0% |
35 350 |
+ Nuclear |
3 918 |
11.0% |
3 326 |
3 521 |
3 418 |
36 824 |
-1.8% |
45 169 |
+ Hydro |
131 |
12.0% |
116 |
122 |
118 |
1 342 |
1.5% |
1 587 |
+ Geoth./Wind/Solar/Other |
41 |
105.0% |
16 |
25 |
24 |
290 |
114.8% |
177 |
= Indigenous Production |
7 032 |
5.0% |
6 420 |
6 260 |
6 368 |
67 262 |
-1.2% |
82 283 |
+ Imports |
1 378 |
17.7% |
1 645 |
1 664 |
1 756 |
16 022 |
38.8% |
14 265 |
- Exports |
714 |
31.5% |
1 031 |
975 |
937 |
7 663 |
8.2% |
8 023 |
|
|
|
|
|
|
|
|
|
= Electricity Supplied |
7 696 |
5.0% |
7 034 |
6 949 |
7 187 |
75 621 |
4.3% |
88 525 |
|
|
|
|
|
|
|
|
|
-Electricity production was 7 032 GWh in October 2006.
-This was higher by 333 GWh, or 5 %, compared to October 2005.
-This was an increase of 664 GWh, or 10.4 %, compared to the previous month.
-Geoth./Wind/Solar/Other production showed the most significant percentage change compared to the previous month w an increase of 70.8 %, or 17 GWh.
-Total production for the year-to-date was 67 262 GWh. Comparing this to the same period last year shows that:
-Total production was lower by 793 GWh, or 1.2 %.
-Geoth./Wind/Solar/Other production showed the largest percentage change by fuel type, being 114.8 % higher.
-Net trade was lower by 3 893 TWh, or 87.2 %.
Electricity Production Compared to Previous Year |
'Year to Date' Comparison of Production by Fuel Type |
|
|
|
|
2004 |
|
2005 |
|
2006 |
|
|||
|
9 000 |
|
|
|
|
|
|
|
|
|
|
|
|
8 000 |
|
|
|
|
|
|
|
|
|
|
|
|
7 000 |
|
|
|
|
|
|
|
|
|
|
|
|
6 000 |
|
|
|
|
|
|
|
|
|
|
|
GWh |
5 000 |
|
|
|
|
|
|
|
|
|
|
|
4 000 |
|
|
|
|
|
|
|
|
|
|
|
|
|
3 000 |
|
|
|
|
|
|
|
|
|
|
|
|
2 000 |
|
|
|
|
|
|
|
|
|
|
|
|
1 000 |
|
|
|
|
|
|
|
|
|
|
|
|
Jan |
Feb |
Mar |
Apr |
May |
Jun |
Jul |
Aug |
Sep |
Oct |
Nov |
Dec |


 Jan-Oct 2004
 Jan-Oct 2005
 Jan-Oct 2006
|
40 000 |
|
|
|
|
35 000 |
|
|
|
|
30 000 |
|
|
|
GWh |
25 000 |
|
|
|
20 000 |
|
|
|
|
15 000 |
|
|
|
|
|
|
|
|
|
|
10 000 |
|
|
|
|
5 000 |
|
|
|
|
Combustible |
Nuclear |
Hydro |
Geoth./Wind/ |
|
Fuels |
|
|
Solar/Other |
COUNTRY NOTES:
© OECD/IEA, 2007 |
INTERNATIONAL ENERGY AGENCY |