

queue of waiting jobs—62 to be exact. Next,
CHOOSE Window / Simulation Window / Table Window
for each table that you wish to see and choose the appropriate Table name of Overhaul, Alljobs, Spot or Service drop-down box when it appears.
The repairman would certainly need help if jobs came in this fast. Otherwise, the repair shop will probably lose a lot of business.
You may stop here or choose to go on to the next model.
If you wish to go on to the next lesson, close all windows related to this model.
CLICK ON The X-Upper Right of Each Window
Otherwise, to end the session
CLICK ON The X-Upper Right of Main Window.
5. QCONTROL.GPS
Simulation of a quality control system.
Problem Statement
A component is manufactured by a sequence of three processes, each followed by a short two minute inspection. The first process requires 20% of components to be reworked. The second and third processes require 15% and 5% of components reworked, respectively. Sixty percent of components reworked are scrapped and the remaining forty percent need reprocessing on the process from which they were rejected.
Manufacturing of a new component commences on average, every 30 minutes, exponentially distributed. The time for the first process is given by the following table.
Time For First Process
Frequency .05 .13 .16 .22 .29 .15
Process time (mins) 10 14 21 32 38 45
The second process takes 15±6 minutes and the final process time is normally distributed with a mean of 24 minutes and a standard deviation of 4 minutes.
1.Simulate the manufacturing processes for 100 completed components.
2.Determine the time taken, and the number of components rejected.
Listing
; GPSS World Sample File - QCONTROL.GPS, by Gerard F. Cummings
*****************************************************************
**
*Quality Control Program *
**
*****************************************************************
RMULT 93211
*Definitions
Transit TABLE M1,100,100,20 ;Transit Time Process FUNCTION RN1,D7 0,0/.05,10/.18,14/.34,21/.56,32/.85,38/1.0,45
*****************************************************************
GENERATE (Exponential(1,0,30))
ASSIGN 1,FN$Process ;Process time in P1 Stage1 SEIZE Machine1
ADVANCE P1 ;Process 1 RELEASE Machine1 ADVANCE 2 ;Inspection
TRANSFER .200,,Rework1 ;20% Need rework
*****************************************************************
Stage2 SEIZE Machine2 ADVANCE 15,6 ;Process 2 RELEASE Machine2 ADVANCE 2 ;Inspection
TRANSFER .150,,Rework2 ;15% Need rework
*****************************************************************
Stage3 SEIZE Machine3
ADVANCE (Normal(1,24,4)) ;Process 3 RELEASE Machine3
ADVANCE 2 ;Inspection 3
TRANSFER .050,,Rework3 ;5% need rework TABULATE Transit ;Record transit time TERMINATE 1
*****************************************************************
Rework1 TRANSFER .400,,Stage1 TERMINATE
Rework2 TRANSFER .400,,Stage2 TERMINATE
Rework3 TRANSFER .400,,Stage3 TERMINATE
Line by Line Description of Model Function
RMULT - This sets the seed of random number generator number 1. When we do
replication runs, we vary only the random number seeds.
TABLE - The Table Transit will accumulate data for a histogram which can be viewed on-line.
FUNCTION - The GPSS function named PROCESS returns a value of 10, 14, 21,
32, 38, or 45, according to the specified probabilities. Notice that in GPSS Functions, you must use Cumulative Distribution Functions to specify probabilities.
GENERATE - New components are started every 30 minutes, on average,
exponentially distributed. Here the built-in Exponential distribution is used. Chapter 8 of the GPSS World Reference Manual discusses the built-in distributions.
ASSIGN - The process time for stage one of the job is placed in Transaction parameter number 1.
SEIZE - The job acquires, or waits for, the GPSS Facility Entity named Machine1.
ADVANCE - The job keeps Machine1 busy for the time duration stored in parameter 1 of the Transaction representing the job.
RELEASE - The Transaction representing the job gives up Machine1, which can then be acquired by a waiting Transaction, if there is one.
ADVANCE - The ADVANCE Block simulates the inspection time.
TRANSFER - The TRANSFER Block will randomly select 20% of the
Transactions to go to the GPSS Block labeled Rework1. This represents a failure of the part resulting from Stage1. The other 80% of the Transactions go on to the next stage.
SEIZE - The Transaction, which has just passed inspection, acquires, or waits for, the GPSS Facility Entity named Machine2.
ADVANCE - The ADVANCE Block represents the process time for stage 2.
RELEASE - The Transaction representing the job gives up Machine2, which can then be acquired by a waiting Transaction, if there is one.
ADVANCE - The ADVANCE Block simulates the inspection time.
TRANSFER - The TRANSFER Block will randomly select 15% of the
Transactions to go to the GPSS Block labeled Rework2. This represents a failure of the part resulting from stage 2. The other 85% of the Transactions go on to the next stage.
SEIZE - The Transaction, which has just passed inspection, acquires, or waits for, the GPSS Facility Entity named Machine3.
ADVANCE - The ADVANCE Block represents the process time for stage 3. The duration is normally distributed.
RELEASE - The Transaction representing the job gives up Machine3, which can then be acquired by a waiting Transaction, if there is one.
ADVANCE - The ADVANCE Block simulates the inspection time.
TRANSFER - The TRANSFER Block will randomly select 5% of the Transactions
to go to the GPSS Block labeled Rework3. This represents a failure of the part resulting from stage 3. The other 95% of the Transactions represent completed parts.
TABULATE - The TABULATE Block incorporates a completion time into the
histogram associated with the Table named Transit. Tables are written automatically to the Standard Report, and are visible as histograms in the individual Table Windows.
TERMINATE - The TERMINATE Block destroys the Transaction, and
decrements the Termination Count. We can simulate a specific number of completed parts by using a part count in operand A of the START statement.
TRANSFER - When a Transaction fails the Stage1 part inspection, it has a 40% probability of being sent back to Stage1. This represents a reworked part.
TERMINATE - The remaining Transactions are destroyed without decrementing the completed part count. This represents scrapping of the parts.
TRANSFER - When a Transaction fails the stage 2 part inspection, and is sent to
this TRANSFER Block, it has a 40% probability of being sent back to stage 2. This represents a reworked part.
TERMINATE - The remaining Transactions are destroyed without decrementing the completed part count. This represents scrapping of these parts.
TRANSFER - When a Transaction fails the stage 3 part inspection, it has a 40% probability of being sent back to stage 3. This represents a reworked part.
TERMINATE - The remaining Transactions are destroyed without decrementing the completed part count. This represents scrapping of these parts.
The model is organized into several segments. After the Transit Table, and Process Function are defined, there are three model segments, each representing the corresponding manufacturing process. Each Transaction represents a component in some stage of completion. Time units are in minutes. Each step has a probability of failure, in which case the Transaction is sent to the Block labeled Rework1, Rework2, or Rework3, respectively. Reworked items have a 60% probability of being scrapped. Otherwise they repeat their last step.
Running the Simulation
To run the simulation and create a Standard Report,
CHOOSE File / Open
and in the dialog box
SELECT QCONTROL
and then
SELECT Open
Next, the simulation must be created.
CHOOSE Command / Create Simulation
then
CHOOSE Command / START
and in the dialog box replace the 1
TYPE 100
SELECT OK
The simulation will end when 100 Transactions have entered the TERMINATE Block. This represents 100 completed components.
When the simulation ends, GPSS World writes a report to the default report file, QControl.1.1. As discussed in Chapter 1, the Report extension will vary depending on saved simulations and previously existing reports. For our purposes, we will assume that this is the first time the simulation has been created and run giving an extension of 1.1.
This report will be automatically displayed in a window. If you close the window, you can reopen it by using the GPSS World File / Open in the Main Menu. Then
you should choose Report in the "Files of type" drop down box at the bottom of the window. GPSS World reports are written in a special format. If you wish to edit the report, you will have to copy its contents to the clipboard and from there into a word processor. You will not be able to open the file directly in a word processor.
Discussion of Results
From the End Time in the Standard Report, we see that it took 4153.8 minutes or about 69 hrs to complete 100 components.
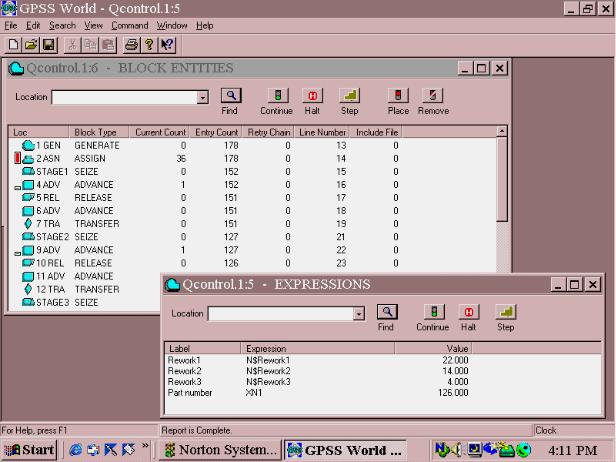
From the Block entry counts, we can derive the number of rejected components. The total entries into Blocks Rework1, Rework2 and Rework3 show that 22 components failed in Stage1, 14 in stage 2 and 4 in stage 3. This is a total of 40 failures. Of these, 21 were scrapped (11+7+3)
Inside the Simulation
Let’s now explore the ending condition of the simulation which generated the Standard Report above. If you are not at the end of the simulation, please Retranslate the model and run it again.
Let’s use the SHOW Command to look at some System Numeric Attributes. First, confirm the simulation end time.
CHOOSE Command / SHOW
and in the dialog box
TYPE AC1
SELECT OK
In the Status Line, you’ll see that the current time is equal to the end time in the report above.
CHOOSE Command / SHOW
and in the dialog box
TYPE N$Rework1
SELECT OK
This value (22), again is the number of components failing in Stage1. Now, let’s open some graphics windows.
CHOOSE Window / Simulation Window / Facilities Window
This is the Facilities Window. Notice that the utilization of Machine1 in extremely high, and that there is a large backlog of waiting components. It appears that the failure rate at machine 1 is quite serious, since it is overloading a heavily utilized resource.
The Table Transit is a histogram of completion times. Let’s look at it.
CHOOSE Window / Simulation Window / Table Window
and in the drop-down box you will see Transit since it is the only Table in the model.
SELECT OK
Although the average completion time was 321 minutes, some components took
over 800 minutes!
Before going on, close the Facilities and Table Windows.
CLICK ON The X-Upper Right of Each Window
Let’s see where components are. The Blocks Window will give us this information.
CHOOSE Window / Simulation Window / Blocks Window
Notice that 30 components are waiting for Machine1 in the ASSIGN Block. Now, we will rerun the simulation, viewing the simulation through some of the graphics windows. Let’s begin by opening the Expressions Window and loading it with some values that we wish to observe.
Let’s keep open the Blocks Window to view the flow the simulation in just a moment. Let’s also open an Expressions Window for a view of selected values while the simulation runs.
CHOOSE Window / Simulation Window / Expressions Window
Then in the Edit Expressions Window for the Label field
TYPE Rework1
And in the Expression field position the mouse pointer anywhere in the Expression box and click once.
TYPE N$Rework1
When we view the Window, this will show us how many parts were sent to possibly be reworked. Remember, a portion of them will just be scrapped.
CLICK ON View
CLICK ON Memorize
Next, look at rework after processing by the second machine. In the Edit Expressions Window
in the dialog box for the Label field replace the current value
TYPE Rework2
and in the Expression field replace the current value
TYPE N$Rework2
Finally, look at rework after processing by the third machine. In the Expressions Window
and in the dialog box for the Label field replace the current value
TYPE Rework3
and in the Expression field replace the current value
TYPE N$Rework3
CLICK ON View
CLICK ON Memorize
This will let us view the failing components. Also, in the Blocks Window, we will see failed Transactions entering Blocks Rework1, Rework2 and Rework3.
Let’s also view the component number of the Active Transaction.
In the dialog box for the Label field replace the current value
TYPE Part number
and in the Expression field replace the current value
TYPE XN1
CLICK ON View
CLICK ON Memorize
SELECT OK
Figure 5—1. Blocks and Expressions Windows displayed together.
Now let’s get rid of Transactions and reset the statistics accumulators. In the Main Menu
CHOOSE Command / Clear
and
SELECT OK
Part no. is not zeroed since it is not a GPSS World value affected by Clear. It will change once we start the simulation. Get ready to watch for reworked components. You may have to size and manipulate the windows to see all the values. Make the Blocks Window active by clicking on it and hide the top of the Expressions Window behind it.
CHOOSE Command / START and in the dialog box replace the 1
TYPE 50
and
SELECT OK
Once you have observed the windows for a short time, close the Expressions Window. As you can see, most components do not fail. Let’s stop the simulation when the next component fails in Stage1. Halt the simulation.
PRESS o
Now, in the Blocks Window move to Non-Detailed View.
CHOOSE View / Entity Details
to toggle to the other view. In the Non-Detailed View of the Blocks Window, move the mouse pointer over the Block labeled Rework1
CLICK ON The Block
then in the Blocks Window
CLICK ON The Place Icon in the Debug Toolbar
Now continue running the simulation.
PRESS m
The simulation stops when the next Transaction fails in Stage1. It is in the TRANSFER Block, ready to enter the Block labeled Rework1. Now Step the Transaction twice.
PRESS p
twice. If you didn’t see it move, it’s because it wasn’t scrapped, but couldn’t get into Stage1 which is currently busy. It is really on the Delay Chain of the Facility, Machine1. Let’s see how much a lower failure rate in Stage 1 will help the situation. First, close the Blocks Window.
CLICK ON The X-Upper Right of Blocks Window
Remove the Stop from the Rework1 Block
CHOOSE Window / Simulation Snapshot / User Stops
CLICK ON 20
CLICK ON Remove
SELECT OK
Give the Model Window the focus. In the Transfer Block located just above the Block labeled Stage 2, change the failure rate from .200 to .020.
CHOOSE Search / Go To Line
and in the dialog box
TYPE 19
SELECT OK
Now, change the failure rate by replacing the value.
CLICK AND DRAG The Mouse Pointer Over .200
This will highlight this value. Then you can replace it.
TYPE .020
Now, Retranslate the model to incorporate this change.
CHOOSE Command / Retranslate
Now, let’s run it one more time and see how the change affects our factory.
CHOOSE Command / START
and in the dialog box replace the 1
TYPE 100
and
SELECT OK
When the simulation ends, check the end time.
CHOOSE Command / SHOW
and in the dialog box
TYPE AC1
SELECT OK
The end time is 3971.49. The original end time when the failure rate was .200 was 4153.89. It appears that the 100 acceptable parts are being made in a shorter time. Look at the Facilities Window
CHOOSE Window / Simulation Window / Facilities Window
We still have a problem. Machine1 still has a considerable backup even though there has been some improvement. Perhaps we need two machines in the first stage.
Before reporting these results, we must prove that they are not due to random noise. Also, we may want to exclude starting conditions form the final statistics using the RESET Command. We should also be aware that the run time of the simulation we were just examining was extremely short. Longer run times are definitely recommended. We could plan a set of experiments, and do an analysis of variance on the average transit times based on the different failure rates. At the same time we must be aware of the occurrence of outages. The GPSS World ANOVA Command and associated database files are discussed in Lesson 13 of this manual and in Chapter 6 of the GPSS World Reference Manual
You may stop here or choose to go on to the next model.
If you wish to go on to the next lesson, close all windows related to this model.
CLICK ON The X-Upper Right of Each Window
Otherwise, to end the session
CLICK ON The X-Upper Right of Main Window.