- •1 Introduction and outline
- •2 Review of literature
- •2.1 Structure of dextran
- •2.2 Microbial loading in sugar factories
- •2.3 The common methods of dextran fractions determination
- •2.4 Dextran content during the process of sugar production
- •2.5 Dextrans associated with processing problems
- •2.6 Crystallization process
- •2.6.1 Growth rate of sucrose crystals
- •2.6.2 Crystallization kinetics
- •2.6.3 Parameters influencing crystallization kinetics
- •2.6.4 Crystal morphology
- •2.7 The Economic gain
- •3 Material and methods
- •3.1 Material
- •3.2 Analytical methods
- •3.2.1 Determination of dextran
- •3.2.1.1 Robert method
- •3.2.1.2 Haze method
- •3.2.2 Microbiological experiments
- •3.2.2.1 Isolation
- •3.2.2.2 Identification
- •3.2.2.2.1 Gas and acid formation
- •3.2.2.2.2 Catalase test
- •3.2.2.2.3 Gram characteristics (KOH-Test)
- •3.2.2.2.4 Identification by API 50 CHL test
- •3.2.2.2.5 L/D-Lactic acid test
- •3.2.3 Crystallization experiments
- •3.2.3.1 Measurement of growth rate of sucrose crystals
- •3.2.3.1.1 Required amount of dextran and seed
- •3.2.3.1.2 Calculation of the growth rate of sucrose crystals:
- •3.2.3.2 Dynamic viscosity
- •3.2.3.3 Crystal morphology and surface topography
- •3.2.3.4 Image analysis
- •3.2.4 Statistical analysis
- •4 Results and discussion
- •4.1 Sensitivity and accuracy of different methods for the determination of dextrans of varying molecular mass
- •4.1.1 Robert’s Copper method sensitivity
- •4.1.2 Haze method sensitivity
- •4.2 Microbial sources of dextran an identification of relevant microorganisms in sugar factories
- •4.3 Levels of dextran contents in different sugar beet factories
- •4.4 Quality of factory final products and their relationship to the levels of dextran during different industrial periods
- •4.5 Influence of dextran concentrations and molecular fractions on the rate of sucrose crystallization in pure sucrose solutions
- •4.5.1 Influence of different temperatures on growth rate of sucrose crystals in the presence of dextran
- •4.6 Elucidation of crystallization kinetics in presence of dextran molecules
- •4.7 Influence of dextran molecule fractions on sucrose solution viscosity
- •4.8 Influence of dextran on the morphology and surface topography of sucrose crystals in presence of dextran
- •4.8.1 Crystal morphology
- •4.8.2 Surface topography
- •4.9 Technical and technological consequences and future perspectives
- •5 Summary
- •6 References
- •7 Appendix
- •8 C. V. and List of Publications

Results and discussion |
69 |
|
4 |
|
|
|
|
|
|
|
|
|
|
3.5 |
|
|
|
|
|
|
|
|
|
|
3 |
|
|
|
|
|
|
|
|
|
. min) |
2.5 |
|
|
|
|
|
|
|
|
|
|
|
|
|
|
|
|
|
|
|
|
2 |
2 |
|
|
|
|
|
|
|
|
|
m |
|
|
|
|
|
|
|
|
|
|
(g / |
1.5 |
|
|
|
|
|
|
|
|
|
G |
|
|
|
|
|
|
|
|
|
|
|
|
|
|
|
|
|
|
|
|
|
|
1 |
|
|
|
|
|
|
|
|
|
|
0.5 |
|
|
|
|
|
|
|
|
|
|
0 |
|
|
|
|
|
|
|
|
|
|
1.05 |
1.06 |
1.07 |
1.08 |
1.09 |
1.1 |
1.11 |
1.12 |
1.13 |
1.14 |
Supersaturation (SS)
|
|
Control |
|
|
|
T40 |
|
T500 |
|
|
|
|
|
T2000 |
|
|
|
|
|
|
|
||||||||
|
|
|
|
|
|
|
|
|||||||
|
|
|
|
|
|
|
|
|
|
|
|
|
|
|
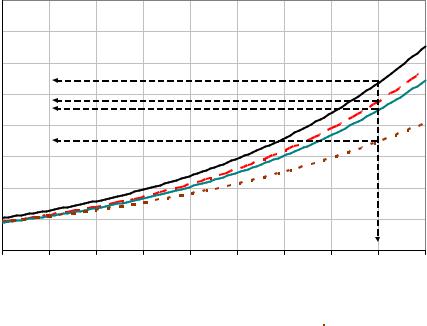
Figure 42: Growth rate of sucrose crystals in isothermal crystallization experiments at 60 °C in pure sucrose solution and after addition of 1500 mg/kg DS of dextran T40, T500 and T2000
4.5.1Influence of different temperatures on growth rate of sucrose crystals in the presence of dextran
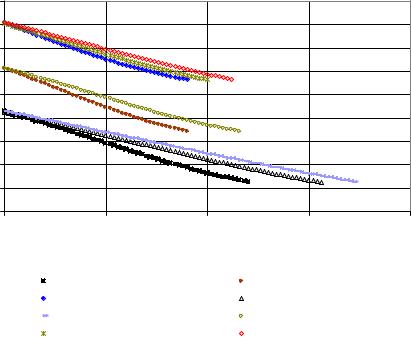
In this chapter, the role of the temperature during the crystallization is studied. As the dextran molecular fraction T2000 showed the most relevant effect on crystallization rate of sucrose crystals only results of experiments with this molecular fraction are presented. Figure 43 shows mother liquor dry substance content at 60, 65 and 70 °C in pure sucrose solution and after addition of 1500 and 5000 mg/kg DS of dextran T2000. The results indicate that great differences in the rate of dry substance reduction were apparent at the regarded temperatures. At a crystallization temperature of 60 °C the crystallization time was extended by 33 % after the admixture of dextran (5000 mg/kg DS) compared to the control experiment. At 70 °C the extension of crystallization time for the same admixture was reduced to only 8 %. It was observed that the degree of reduction at 70°C was higher than at 65 °C or 60°C considering all treatments. In contrast, the effect of dextran appeared to be reduced at 70°C and increased at lower temperatures (65 °C and 60°C).
Also, a higher dextran concentration (5000 mg/kg DS) had a stronger effect on the exhaustion of mother liquor than a concentration of 1500 ppm under the

Results and discussion |
70 |
experimental conditions. Hence, longer time of crystallization was required at low temperatures and high dextran contents.
|
79 |
|
|
|
|
|
78.5 |
|
|
|
|
|
78 |
|
|
|
|
(%) |
77.5 |
|
|
70°C |
|
77 |
|
|
|
||
in |
76.5 |
|
|
|
|
DS |
|
|
65°C |
|
|
76 |
|
|
|
||
|
|
|
|
|
|
|
75.5 |
|
|
|
60°C |
|
75 |
|
|
|
|
|
|
|
|
|
|
|
74.5 |
|
|
|
|
|
0 |
50 |
100 |
150 |
200 |
Time (min)
Control (60°C) |
Control (65°C) |
Control (70°C) |
1500 mg/kg DS (60°C) |
5000 mg/kg Ds (60°C) |
T2000-1500ppm (65°C) |
1500 mg/kg DS (70°C) |
5000 mg/kg DS (70°C) |
|
|
Figure 43: Dry substance content at 70, 65 and 60°C in control and in presence of dextranT2000 (1500 and 5000ppm) during crystallization process
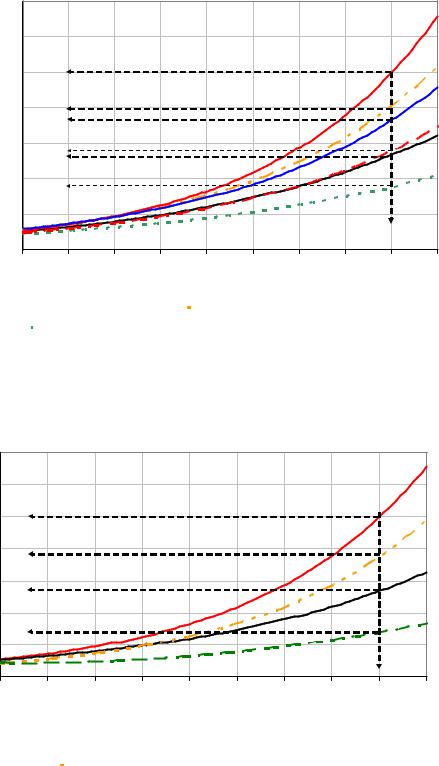
The influence of addition of 1500 and 5000 mg/kg DS of dextran on crystal growth rates at 60 and 70 °C is shown in Figure 44 and Figure 45. The addition of 1500 mg/kg DS of dextran T2000 reduced the growth rate of sucrose crystals by 33 % at 60 °C, 24 % at 65°C and by 16 % at 70 °C. These results show the same tendency as results from Ekelhof, 1997; Meade and Chen, (1977). However, growth rates obtained in own experiments were higher than the former results of Ekelhof. This is due the use of a fast mixing system during own experiments in contrast to the float bed (without stirrer) crystallizator applied by Ekelhof. At a supersaturation of 1.13 addition of 5000 mg/kg DS of dextran T2000 reduced the growth rate of sucrose crystals by 51 % and 24 % at 60 °C and 70 °C, respectively (see Figure 44 and Figure 45).
The results indicate that higher temperatures (e.g. 70 °C) reduce the effect of dextran on the crystallization rate especially in case of high levels of dextran in the

Results and discussion |
71 |
massecuite. Furthermore, crystallization temperature at 70°C improves the mother liquor diffusion and consequently, the growth rate of sucrose crystals.
|
7 |
|
|
|
|
|
|
|
|
|
|
6 |
|
|
|
|
|
|
|
|
|
|
5 |
|
|
|
|
|
|
|
|
70°C |
.min) |
|
|
|
|
|
|
|
|
|
|
4 |
|
|
|
|
|
|
|
|
65°C |
|
2 |
|
|
|
|
|
|
|
|
||
(g / m (g/m2.min) |
|
|
|
|
|
|
|
|
|
|
3 |
|
|
|
|
|
|
|
|
|
|
G G |
|
|
|
|
|
|
|
|
|
60°C |
|
2 |
|
|
|
|
|
|
|
|
|
|
1 |
|
|
|
|
|
|
|
|
|
|
0 |
|
|
|
|
|
|
|
|
|
|
1.05 |
1.06 |
1.07 |
1.08 |
1.09 |
1.1 |
1.11 |
1.12 |
1.13 |
1.14 |
|
|
|
|
Supersaturation (SS) |
|
|
|
|||
|
|
|
|
|
|
|
Control (60°C) |
|
|
|
|
1500 mg/kg DS (70°C) |
|
Control (70°C) |
|
|
|
|
|
|
|
|
|
|
|||||
|
|
|
|
|
|
|
1500 mg/kg DS (60°C) |
|
|
|
|
1500 mg/kg Ds (65°C) |
|
Control (65°C) |
|
|
|
|
|
|
|
|
|
|
|
|
|||
|
|
|
|
|
|
|
|
|
|
|
|
|
|
|
Figure 44: Growth rate of sucrose crystals at 60, 65 and 70 °C after addition of 1500 mg/kg DS of dextran T2000
|
7 |
|
|
|
|
|
|
|
|
|
|
6 |
|
|
|
|
|
|
|
|
|
. min) |
5 |
|
|
|
|
|
|
|
|
|
4 |
|
|
|
|
|
|
|
|
|
|
2 |
|
|
|
|
|
|
|
|
|
|
/ m |
3 |
|
|
|
|
|
|
|
|
|
G (g |
|
|
|
|
|
|
|
|
|
|
2 |
|
|
|
|
|
|
|
|
|
|
|
|
|
|
|
|
|
|
|
|
|
|
1 |
|
|
|
|
|
|
|
|
|
|
0 |
|
|
|
|
|
|
|
|
|
|
1.05 |
1.06 |
1.07 |
1.08 |
1.09 |
1.1 |
1.11 |
1.12 |
1.13 |
1.14 |
Supersaturation (SS)
|
|
|
|
|
Control (70°C) |
|
|
|
Control (60°C) |
|
|
|
|
|
|
|
|
|
|||
|
|
|
|
|
5000 mg/kg DS (70°C) |
|
|
|
|
5000 mg/kg DS (60°C) |
|
|
|
|
|
|
|
|
|
||
|
|
|
|
|
|
|
|
|
|
|
Figure 45: Growth rate of sucrose crystals at 60 and 70 °C after addition of 5000 mg/kg DS of dextran T2000
