
nature13326
.pdf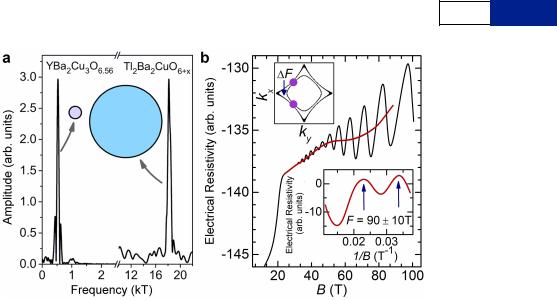
LETTER RESEARCH
Extended Data Figure 3 | Quantum oscillations up to 100 T. a, Schematic illustration of the small and large Fermi surface pocket sizes (and quantum oscillation Fourier frequencies) in underdoped YBa2Cu3O6 1 x and overdoped Tl2Ba2CuO6 1 d, respectively16,52. b, Contactless electrical resistivity of
YBa2Cu3O6.56 measured to 100 T, showing the resistive transition (at approximately 20 T) and quantum oscillations. The dominant quantum
oscillations with a frequency of 530 T can be seen to be superimposed on slowly
varying oscillations (red line), which we extract in the lower inset by subtracting the dominant oscillations and a linear background. The slowly varying oscillations are consistent with a low frequency of 90 610 T. The upper inset shows the bilayer-split pockets expected for charge order in which the difference in area between two magnetic breakdown junctions corresponds to a frequency of approximately 90 T.
©2014 Macmillan Publishers Limited. All rights reserved
RESEARCH LETTER
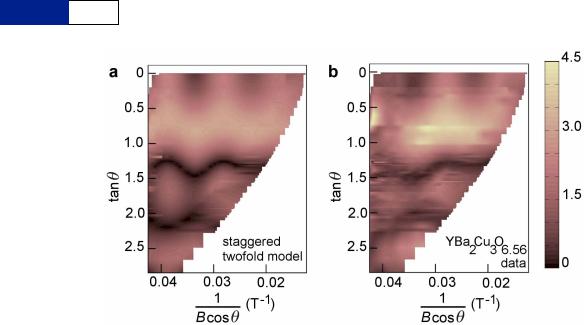
Extended Data Figure 4 | Contour representation of a staggered twofold Fermi surface model compared to the experimental data. a, Contour plot of the simulated quantum oscillation amplitude for a staggered twofold Fermi surface geometry represented by equations (2) and (4), using parameters in Extended Data Table 1 and shown in Fig. 4c. b, Contour plot of experimentally
measured quantum oscillation amplitude; good agreement is seen with the model in a. The quantum oscillation amplitude is indicated by the colour scale (in arbitrary units) in the reciprocal field-angle plane; for clarity the ordinate is given as tanh.
©2014 Macmillan Publishers Limited. All rights reserved
LETTER RESEARCH
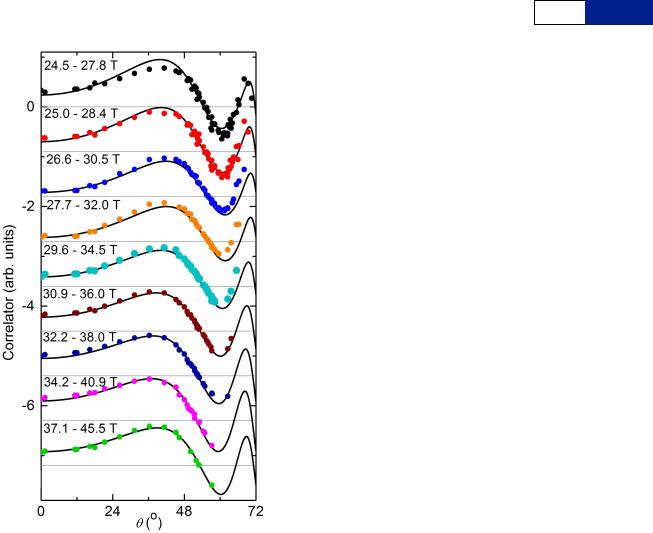
Extended Data Figure 5 | Cross-correlation measured over different field ranges, compared to simulations for a staggered twofold Fermi surface geometry. Real component of the cross-correlation between the quantum oscillation data over fixed ranges of Bcosh for a range of measured h angles, with a simple sinusoid cos(2pF/(Bcosh) 1w). F and w are matched to the periodicity and phase of the oscillations at h 538u, where a single frequency dominates the measured quantum oscillations. Black lines indicate the simulation
(proportional to RwRs), where DFtwofold <15 T is the depth of the modulation, while square symbols indicate the experimental cross-correlation.
©2014 Macmillan Publishers Limited. All rights reserved
RESEARCH LETTER
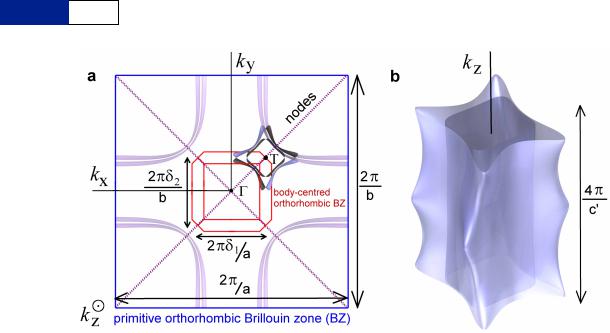
Extended Data Figure 6 | Schematic of a nodal Fermi surface from charge order that is staggered perpendicularly to the bilayers. a, Reconstruction of the Brillouin zone, with one instance of the pocket location indicated in the vicinity of the ‘T’ point in relation to the original Fermi surface (purple) and nodes in the superconducting wavefunction (from refs 8, 9, 60 and 61). Here the concentric arrangement of Fermi surfaces arises from bilayer splitting. We note
that the in-plane shape of the Fermi pocket shown here is an illustration based on a non-interacting model calculation in refs 8, 9, 60 and 61. b, A threedimensional view of a. While this schematic assumes achirality, a chiral model is not ruled out, as for instance proposed in ref. 87, where the form of order breaks mirror symmetry within each plane.
©2014 Macmillan Publishers Limited. All rights reserved
LETTER RESEARCH
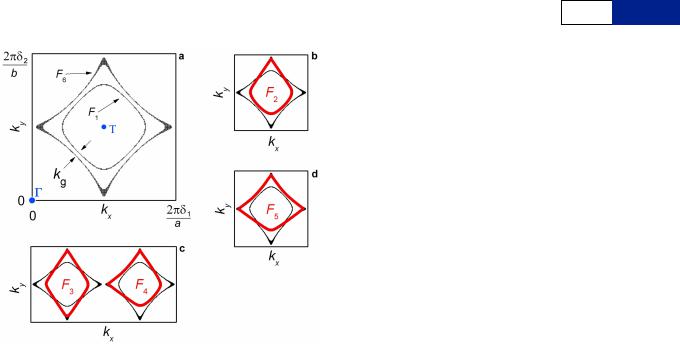
Extended Data Figure 7 | Schematic of the Brillouin zone cross-section, showing magnetic breakdown orbits in a charge ordering scheme. A cut through the kz 50 plane of the Brillouin zone shows the six possible orbits resulting from magnetic breakdown tunnelling in a bilayer charge ordering scheme16,61, an illustrative Fermi pocket shape similar to Extended Data Fig. 6 is
shown. a, The two Fermi surface cross-sections of frequency F1 5F0 22DFsplit and F6 5F0 12DFsplit that can result from bilayer splitting with in-plane
|
d |
|
|
d |
|
|
ordering wavevectors Q1jj |
~2p + |
1 |
,0 and Q2jj |
~2p 0,+ |
2 |
. The C and T |
a |
b |
|||||
symmetry points of the body-centred orthorhombic Brillouin zone of the charge order superstructure are depicted in blue. The gap separating bonding and antibonding surfaces is expected to be smallest at the nodes62. Panels
b, c and d show the range of possible magnetic breakdown orbits,
F2 5F0 2DFsplit, F3 5F0, F4 5F0 and F5 5F0 1DFsplit, as listed in Table 2.
©2014 Macmillan Publishers Limited. All rights reserved
RESEARCH LETTER
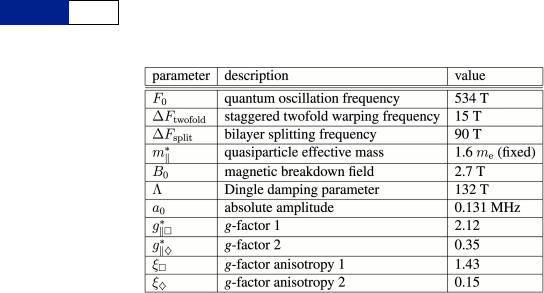
Extended Data Table 1 | Model parameters for a staggered twofold Fermi surface model
Tabulated values used in equations (2) and (4) to simulate the quantum oscillation waveform, yielding excellent agreement with experiment as a function of B, h and w (Fig. 4 and Extended Data Figs 2c and 4). The effective mass is taken to be a fixed quantity, having been determined independently from temperature-dependent measurements47. The parameters are the same for all the orbits, except for those denoted by subscripts h and e, which each correspond to a subset of orbits as defined in the text. Because of the multiple frequencies in the model, it is not possible to uniquely identify the g-factor; the values of gj and jj here represent parameters used for the simulation.
©2014 Macmillan Publishers Limited. All rights reserved

LETTER RESEARCH
Extended Data Table 2 | Magnetic breakdown amplitude damping
The magnetic breakdown network corresponds to a split Fermi surface geometry from charge order, as shown in Extended Data Fig. 7. A high magnetic breakdown tunnelling probability P causes the amplitude of the F1 and F6 orbits to become very weak, as seen in Fig. 3a (ref. 16).
©2014 Macmillan Publishers Limited. All rights reserved
RESEARCH LETTER
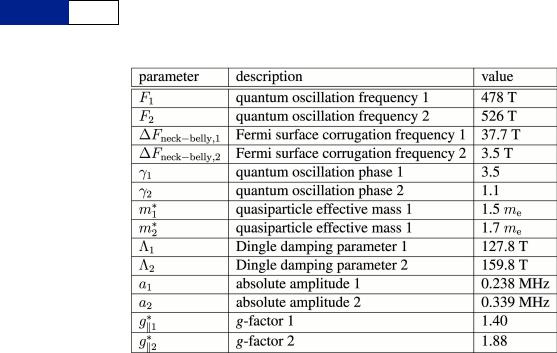
Extended Data Table 3 | Model parameters for a fundamental neck and belly Fermi surface model
Tabulated values from ref. 36 used in equations (1) and (3) to simulate the waveform of the oscillations in Fig. 2c and Extended Data Fig. 2b and c for two cylinders with isotropic g-factors. The absolute amplitudes a1 and a2 listed here have been adjusted to match the amplitude in the present experiment.
©2014 Macmillan Publishers Limited. All rights reserved
