


258 Part 3: Implementing the Schedule
Analyzing Costs
Comparing actual costs to budgets is a simplistic approach to cost control. Determining performance using earned value is more effective. Measuring earned value involves three key indicators: planned value, earned value, and actual cost. If you track these values over time, you can see the past spending and schedule trends for the project, together with a forecast of future costs.
The variance between the planned budget and earned value amounts indicates an unfavorable schedule variance.
Customize columns in the Projects window to report earned value for all projects in the organization.
Use cost spreadsheets, profiles, and cost control reports to monitor spending. For example, the following summary report lists the expenses associated with each project and provides the total budgeted, actual, and remaining costs for each expense.
Primavera - Project Management

Working with Cost Accounts and Project Expenses 259
EX-01 Expense Summary By Project
Expense Item |
Activity ID |
Budgeted Cost |
Actual Cost |
Remaining Cost |
|
|
|
|
|
Computer Equipment |
A20.190 |
$10,000.00 |
$0.00 |
$10,000.00 |
Meeting Lunch |
A10.10 |
$100.00 |
$200.00 |
$0.00 |
Trip expenses |
A10.20 |
$10,000.00 |
$15,000.00 |
$0.00 |
|
|
|
|
|
Meeting Lunches |
A10.40 |
$300.00 |
$500.00 |
$0.00 |
Auto Milage |
A10.30 |
$200.00 |
$150.00 |
$0.00 |
Printing |
A10.50 |
$500.00 |
$1,000.00 |
$0.00 |
Binding |
A10.50 |
$100.00 |
$0.00 |
$0.00 |
|
|
|
|
|
Shipping (FedEx) |
A10.60 |
$500.00 |
$0.00 |
$500.00 |
|
|
|
|
|
Subtotal |
|
$21,700.00 |
$16,850.00 |
$10,500.00 |
Project Name |
Russell Computers |
|
|
|
Expense Item |
Activity ID |
Budgeted Cost |
Actual Cost |
Remaining Cost |
|
|
|
|
|
Computer Equipment |
A20.190 |
$10,000.00 |
$0.00 |
$10,000.00 |
Meeting Lunch |
A10.10 |
$100.00 |
$200.00 |
$100.00 |
|
|
|
|
|
Trip expenses |
A10.20 |
$10,000.00 |
$15,000.00 |
$0.00 |
|
|
|
|
|
|
|
|
|
|
Page 7 of 12
The following Activity Usage Spreadsheet pairs activity duration columns on the left with the corresponding cumulative cost information on the right. You can see the cumulative remaining expense cost for each activity per month, along with the totals for the WBS elements.
Primavera - Project Management
260 Part 3: Implementing the Schedule
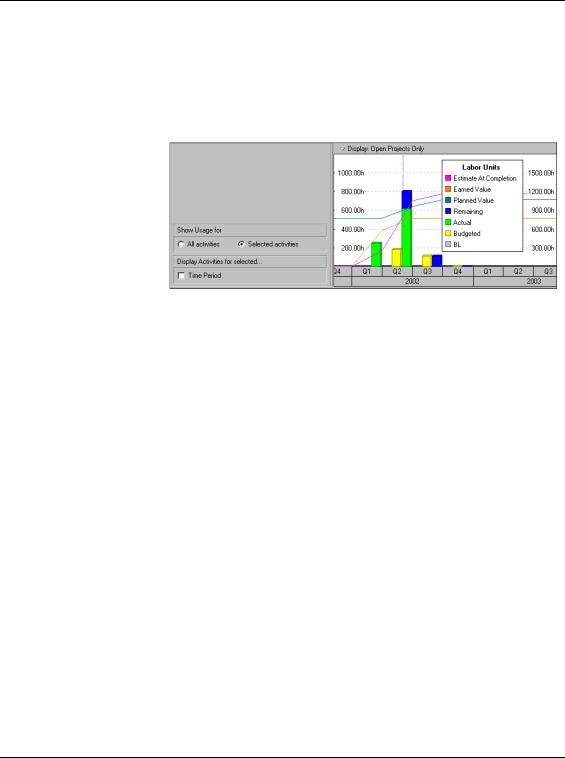
Produce activity profiles to see a graphical representation of cost flow for all or selected activities in the Activities window. The histogram bars in the following example indicate quarterly expenses for multiple selected activities. Using a time-based graphic helps you gauge when and where costs are expended, and enables you to see if spending is staying within budget.
Primavera - Project Management