

primer_on_scientific_programming_with_python
.pdf
320 |
|
6 Files, Strings, and Dictionaries |
||
|
|
|
|
|
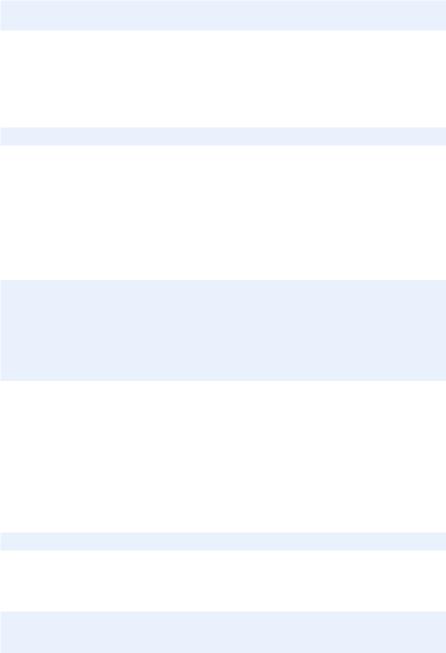
Basic Philosophy |
2005 |
fall |
10 |
F |
Name: Kari Nordmann |
|
|
|
|
Introductory Python Programming |
2006 |
spring 5 A |
||
Astronomy |
2005 |
fall |
10 |
D |
Our problem consists of reading this file into a dictionary data with the student name as key and a list of courses as value. Each element in the list of courses is a dictionary holding the course name, the semester, the credit points, and the grade. A value in the data dictionary may look as
’Kari Nordmann’: [{’credit’: 5, ’grade’: ’A’,
’semester’: ’2006 spring’,
’title’: ’Introductory Python Programming’},
{’credit’: 10, ’grade’: ’D’,
’semester’: ’2005 fall’, ’title’: ’Astronomy’}],
Having the data dictionary, the next task is to print out the average grade of each student.
Solution. We divide the problem into two major tasks: loading the file data into the data dictionary, and computing the average grades. These two tasks are naturally placed in two functions.
We need to have a strategy for reading the file and interpreting the contents. It will be natural to read the file line by line, and for each line check if this is a line containing a new student’s name, a course information line, or a blank line. In the latter case we jump to the next pass in the loop. When a new student name is encountered, we initialize a new entry in the data dictionary to an empty list. In the case of a line about a course, we must interpret the contents on that line, which we postpone a bit.
We can now sketch the algorithm described above in terms of some unfinished Python code, just to get the overview:
def load(studentfile):
infile = open(studentfile, ’r’) data = {}
for line in infile:
i = line.find(’Name:’) if i != -1:
# line contains ’Name:’, extract the name
...
elif line.isspace(): |
# blank line? |
continue |
# go to next loop iteration |
else: |
|
#this must be a course line
#interpret the line
...
infile.close() return data
6.6 Summary |
321 |
|
|
If we find ’Name:’ as a substring in line, we must extract the name. This can be done by the substring line[i+5:]. Alternatively, we can split the line with respect to colon and strip o the first word:
words = line.split(’:’)
name = ’ ’.join(words[1:])
We have chosen the former strategy of extracting the name as a substring in the final program.
Each course line is naturally split into words for extracting information:
words = line.split()
The name of the course consists of a number of words, but we do not know how many. Nevertheless, we know that the final words contain the semester, the credit points, and the grade. We can hence count from the right and extract information, and when we are finished with the semester information, the rest of the words list holds the words in the name of the course. The code goes as follows:
grade = words[-1] credit = int(words[-2])
semester = ’ ’.join(words[-4:-2]) course_name = ’ ’.join(words[:-4])
data[name].append({’title’: course_name, ’semester’: semester, ’credit’: credit, ’grade’: grade})
This code is a good example of the usefulness of split and join operations when extracting information from a text.
Now to the second task of computing the average grade. Since the grades are letters we cannot compute with them. A natural way to proceed is to convert the letters to numbers, compute the average number, and then convert that number back to a letter. Conversion between letters and numbers is easily represented by a dictionary:
grade2number = {’A’: 5, ’B’: 4, ’C’: 3, ’D’: 2, ’E’: 1, ’F’: 0}
To convert from numbers to grades, we construct the “inverse” dictionary:
number2grade = {}
for grade in grade2number: number2grade[grade2number[grade]] = grade
In the computation of the average grade we should use a weighted sum such that larger courses count more than smaller courses. The weighted mean value of a set of numbers ri with weights wi, i = 0, . . . , n − 1, is given by
6.7 Exercises |
323 |
|
|
6.7 Exercises |
|
Exercise 6.1. Read a two-column data file.
The file src/files/xy.dat contains two columns of numbers, corresponding to x and y coordinates on a curve. The start of the file looks as this:
-1.0000 |
-0.0000 |
-0.9933 |
-0.0087 |
-0.9867 |
-0.0179 |
-0.9800 |
-0.0274 |
-0.9733 |
-0.0374 |
Make a program that reads the first column into a list x and the second column into a list y. Then convert the lists to arrays, and plot the curve. Print out the maximum and minimum y coordinates. (Hint: Read the file line by line, split each line into words, convert to float, and append to x and y.) Name of program file: read_2columns.py
Exercise 6.2. Read a data file.
The files density_of_water.dat and density_of_air.dat files in the folder src/files contain data about the density of water and air (resp.) for di erent temperatures. The data files have some comment lines starting with # and some lines are blank. The rest of the lines contain density data: the temperature in the first column and the corresponding density in the second column. The goal of this exercise is to read the density data and plot them. Let the program take the name of the data file as command-line argument, load the density data into NumPy arrays, and plot the data using circles for the data points. Demonstrate that the program can read both files. Name of program file: read_density_data.py
Exercise 6.3. Simplify the implementation of Exer. 6.1.
Files with data in a tabular fashion are very common and so is the operation of the reading the data into arrays. Therefore, the scitools.filetable module o ers easy-to-use functions for loading data files with columns of numbers into NumPy arrays. First read about scitools.filetable using pydoc in a terminal window (cf. page 98). Then solve Exercise 6.1 using appropriate functions from the scitools.filetable module. Name of program file: read_2columns_filetable.py.
Exercise 6.4. Fit a polynomial to data.
The purpose of this exercise is to find a simple mathematical formula for the how the density of water or air depends on the temperature. First, load the density data from file as explained in Exercises 6.2 or 6.3. Then we want to experiment with NumPy utilities that can find a polynomial that approximate the density curve.
NumPy has a function polyfit(x, y, deg) for finding a “best fit” of a polynomial of degree deg to a set of data points given by the array

324 |
6 Files, Strings, and Dictionaries |
|
|
arguments x and y. The polyfit function returns a list of the coe - cients in the fitted polynomial, where the first element is the coe cient for the term with the highest degree, and the last element corresponds to the constant term. For example, given points in x and y, polyfit(x, y, 1) returns the coe cients a, b in a polynomial a*x + b that fits the data in the best way17.
NumPy also has a utility poly1d which can take the tuple or list of coe cients calculated by, e.g., polyfit and return the polynomial as a Python function that can be evaluated. The following code snippet demonstrates the use of polyfit and poly1d:
coeff = polyfit(x, y, deg) p = poly1d(coeff)
print p # prints the polynomial expression
y_fitted = p(x)
plot(x, y, ’r-’, x, y_fitted, ’b-’,
legend=(’data’, ’fitted polynomial of degree %d’ % deg’))
For the density–temperature relationship we want to plot the data from file and two polynomial approximations, corresponding to a 1st and 2nd degree polynomial. From a visual inspection of the plot, suggest simple mathematical formulas that relate the density of air to temperature and the density of water to temperature. Make three separate plots of the Name of program file: fit_density_data.py
Exercise 6.5. Read acceleration data and find velocities.
A file src/files/acc.dat contains measurements a0, a1, . . . , an−1 of the acceleration of an object moving along a straight line. The measurement ak is taken at time point tk = kΔt, where Δt is the time spacing between the measurements. The purpose of the exercise is to load the acceleration data into a program and compute the velocity v(t) of the object at some time t.
In general, the acceleration a(t) is related to the velocity v(t) through v (t) = a(t). This means that
t
v(t) = v(0) + a(τ )dτ . (6.1)
0
If a(t) is only known at some discrete, equally spaced points in time, a0, . . . , an−1 (which is the case in this exercise), we must compute the integral (6.1) in numerically, for example by the Trapezoidal rule:
1 |
|
1 |
|
k−1 |
, 1 ≤ k ≤ n − 1 . |
|
|
|
|||
v(tk) ≈ Δt |
|
a0 + |
|
ak + |
ai |
(6.2) |
|||||
2 |
2 |
||||||||||
|
|
|
|
|
|
i |
|
|
|
|
|
|
|
|
|
|
|
=1 |
|
|
|
|
|
17 More precisely, a line y = ax+b is a “best fit” to the data points (xi , yi ), i = 0, . . . , n |
− |
1 |
|||||||||
|
|
|
|
|
|
|
n−1 |
|
|
|
|
if a and b are chosen to make the sum of squared errors R = Pj=0 |
(yj − (axj + b))2 |
||||||||||
as small as possible. This approach is known as least squares approximation to data and proves to be extremely useful throughout science and technology.

6.7 Exercises |
325 |
|
|
We assume v(0) = 0 so that also v0 = 0.
Read the values a0, . . . , an−1 from file into an array, plot the acceleration versus time, and use (6.2) to compute one v(tk) value, where Δt and k ≥ 1 are specified on the command line. Name of program file: acc2vel_v1.py.
Exercise 6.6. Read acceleration data and plot velocities.
The task in this exercise is the same as in Exercise 6.5, except that we now want to compute v(tk) for all time points tk = kΔt and plot the velocity versus time. Repeated use of (6.2) for all k values is very ine cient. A more e cient formula arises if we add the area of a new trapezoid to the previous integral:
tk |
1 |
|
|
|
|
tk |
1 |
|
|
|
|
v(tk) = v(tk−1) + |
a(τ )dτ ≈ v(tk−1) + Δt |
2 |
(ak−1 |
+ ak), |
(6.3) |
−
for k = 1, 2, ldots, n − 1, while v0 = 0. Use this formula to fill an array v with velocity values. Now only Δt is given on the command line, and the a0, . . . , an−1 values must be read from file as in Exercise 6.5. Name of program file: acc2vel.py.
Exercise 6.7. Find velocity from GPS coordinates.
Imagine that a GPS device measures your position at every s seconds. The positions are stored as (x, y) coordinates in a file src/files/pos.dat with the an x and y number on each line, except for the first line which contains the value of s.
First, load s into a float variable and the x and y numbers into two arrays and draw a straight line between the points (i.e., plot the y coordinates versus the x coordinates).
The next task is to compute and plot the velocity of the movements. If x(t) and y(t) are the coordinates of the positions as a function of time, we have that the velocity in x direction is vx(t) = dx/dt, and the velocity in y direction is vy = dy/dt. Since x and y are only known for some discrete times, tk = ks, k = 0, . . . , n − 1, we must use numerical di erentation. A simple (forward) formula is
v |
(t |
) |
≈ |
x(tk+1) − x(tk) |
, v |
(t |
) |
≈ |
y(tk+1) − y(tk) |
, k = 0, . . . , n 2 . |
x |
k |
|
s |
y |
k |
|
s |
− |
Compute arrays vx and vy with velocities based on the formulas above for vx(tk) and vy (tk), k = 0, . . . , n−2. Plot vx versus time and vy versus time. Name of program file: position2velocity.py.
Exercise 6.8. Make a dictionary from a table.
The file src/files/constants.txt contains a table of the values and the dimensions of some fundamental constants from physics. We want to load this table into a dictionary constants, where the keys are

6.7 Exercises |
327 |
|
|
and n. Store the numbers in three arrays and plot epsilon and the exact error versus n. Use a logarithmic scale on the y axis, which is enabled by the log=’y’ keyword argument to the plot function. Name of program file: read_error.py.
Exercise 6.12. Make a dictionary.
Based on the stars data in Exercise 2.44, make a dictionary where the keys contain the names of the stars and the values correspond to the luminosity. Name of program file: stars_data_dict1.py.
Exercise 6.13. Make a nested dictionary.
Store the data about stars from Exercise 2.44 in a nested dictionary such that we can look up the distance, the apparent brightness, and the luminosity of a star with name N by stars[N][’distance’],
stars[N][’apparent brightness’], and |
stars[N][’luminosity’]. |
Name of program file: stars_data_dict2.py. |
|
Exercise 6.14. Make a nested dictionary from a file.
The file src/files/human_evolution.txt holds information about various human species and their hight, weight, and brain volume. Make a program that reads this file and stores the tabular data in a nested dictionary humans. The keys in humans correspond to the specie name (e.g., “homo erectus”), and the values are dictionaries with keys for “height”, “weight”, “brain volume”, and “when” (the latter for when the specie lived). For example, humans[’homo neanderthalensis’][’mass’] should equal ’55-70’. Let the program write out the humans dictionary in a nice tabular form similar to that in the file. Name of program file: humans.py.
Exercise 6.15. Compute the area of a triangle.
The purpose of this exercise is to write an area function as in Exercise 2.17, but now we assume that the vertices of the triangle is stored in a dictionary and not a list. The keys in the dictionary correspond to the vertex number (1, 2, or 3) while the values are 2-tuples with the x and y coordinates of the vertex. For example, in a triangle with vertices (0, 0), (1, 0), and (0, 2) the vertices argument becomes
{1: (0,0), 2: (1,0), 3: (0,2)} |
|
Name of program file: area_triangle_dict.py. |
|
Exercise 6.16. Compare data structures for polynomials.
Write a code snippet that uses both a list and a dictionary to represent the polynomial −12 + 2x100. Print the list and the dictionary, and use them to evaluate the polynomial for x = 1.05 (you can apply the poly1 and poly2 functions from Chapter 6.2.3). Name of program file:

328 6 Files, Strings, and Dictionaries
Exercise 6.17. Compute the derivative of a polynomial.
A polynomial can be represented by a dictionary as explained in Chapter 6.2.3. Write a function diff for di erentiating such a polynomial. The diff function takes the polynomial as a dictionary argument and returns the dictionary representation of the derivative. Recall the formula for di erentiation of polynomials:
d |
n |
n |
|
j |
|
|
|
dx |
cj xj = |
jcj xj−1 . |
(6.4) |
=0 |
j=1 |
|
|
|
|
This means that the coe cient of the xj−1 term in the derivative equals j times the coe cient of xj term of the original polynomial. With p as the polynomial dictionary and dp as the dictionary representing the derivative, we then have dp[j-1] = k*p[j] for j running over all keys in p, except when j equals 0.
Here is an example of the use of the function diff:
>>> p = {0: -3, 3: 2, 5: -1} |
# -3 + 2*x**3 - x**5 |
|
>>> diff(p) |
# should be 6*x**2 - 5*x**4 |
|
{2: 6, 4: -5} |
|
|
Name of program file: poly_diff.py. |
|
|
Exercise 6.18. Generalize the program from Ch. 6.2.6.
The program from Chapter 6.2.6 is specialized for three particular companies. Suppose you download n files from finance.yahoo.com, all with monthly stock price data for the same period of time. Also suppose you name these files company.csv, where company reflects the name of the company. Modify the program from Chapter 6.2.6 such that it reads a set of filenames from the command line and creates a plot that compares the evolution of the corresponding stock prices. Normalize all prices such that they initially start at a unit value. Name of program file: stockprices3.py.
Exercise 6.19. Write function data to file.
We want to dump x and f (x) values to a file, where the x values appear in the first column and the f (x) values appear in the second. Choose n equally spaced x values in the interval [a, b]. Provide f , a, b, n, and the filename as input data on the command line. Use the StringFunction tool (see Chapters 3.1.4 and 4.4.3) to turn the textual expression for f into a Python function. (Note that the program from Exercise 6.1 can be used to read the file generated in the present exercise into arrays again for visualization of the curve y = f (x).) Name of program files write_cml_function.py.
Exercise 6.20. Specify functions on the command line.
Explain what the following two code snippets do and give an example of how they can be used. Snippet 1: