


8
Chapter
Manipulating Plugin Output
8.1 Negating Plugin Results
In some situations you may want to test the opposite of what the standard plugin normally tests, such as an interface that should not be active, a Web page or a host that should normally not be reached. In these cases the program negate, included in the Nagios plugins, provides a way of negating the return value of the original check.
Like plugins, negate has an option to specify a timeout in seconds, with -t, after which it should abort the operation. The actual command line must always contain the complete path to the plugin:
negate plugin command
negate -t timeout plugin command
155

8 Manipulating Plugin Output
negate changes the return value of 2 (CRITICAL) to 0 (OK) and vice versa. The return codes 1 (WARNING) and 3 (UNKNOWN) remain unchanged.
The following example carries out check_icmp on the host 192.0.2.1, which in normal cases should not be reachable:
nagios@linux:nagios/libexec$ ./negate \
/usr/local/nagios/libexec/check_icmp -H 192.0.2.1
CRITICAL - 192.0.2.1: rta nan, lost 100%| rta=0.000ms;200.000;500.000;0; pl=100%;40;80;;
nagios@linux:nagios/libexec$ echo $? 0
The plugin itself returns a CRITICAL in this case with a corresponding text. negate “inverts” the return value; 2 (CRITICAL) turns into 0 (OK). Since the text originates from the plugin and is not changed, the information CRITICAL remains here. For Nagios itself, however, nothing but the return value is of any interest.
8.2Inserting Hyperlinks with urlize
The program urlize represents the text output of a plugin as a hyperlink, if required, so that clicking in the Nagios Web interface on the test result takes you to another Web page. Like negate, urlize functions as a wrapper around the normal plugin command and is included with the other Nagios plugins.
As the first argument it expects a valid URL to which the hyperlink should point. This is followed by the plugin command, including its path:
urlize url plugin command
To avoid problems with spaces in plugin arguments, you can set the complete plugin command in double quotation marks.
The hyperlink around the normal plugin output can be easily recognized when running the command manually:
nagios@linux:nagios/libexec$ ./urlize http://www.swobspace.de \
/usr/local/nagios/libexec/check_http -H www.swobspace.de
<A href="http://www.swobspace.de">HTTP OK HTTP/1.1 200 OK - 2802 bytes in 0.132 seconds |time=0.132491s;;;0.000000 size=2802B;;;0</A>
In version 1.4 urlize also embeds the performance output in the link text, but Nagios cut this off before the representation in the Web interface, together with the end tag. But most browsers do not have any problem with the missing </A>.
156

9
Chapter
Executing Plugins via SSH
Local plugins, that is, programs that only run tests locally because there are no network protocols available, must be installed on the target system and started there. They check processes, CPU load, or how much free hard disk capacity is still available, among other things.
But if you still want to execute these plugins from the Nagios server, it is recommended that you use the secure shell, especially if any kind of Unix system is installed on the machine to be tested—a Secure Shell daemon will almost always be running on such a target system, and you do not require any special permissions to run most plugins. The Nagios administrator needs nothing more than an account, which he can use from the Nagios server. On the server itself, the check_by_ssh plugin must be installed.
In heterogeneous environments the Secure Shell itself often create conditions that may cause problems: depending on the operating system, an SSH daemon may be
157

9 Executing Plugins via SSH
in use that returns a false return code1 or is so old that it cannot handle the SSH protocol version 2.0. In this case it is better to install the current OpenSSH version from http://www.openssh.org/. In pure Linux environments with up-to-date and maintained installations, such problems generally do not occur.
9.1 The check_by_ssh Plugin
check_by_ssh is run on the Nagios server and establishes a Secure Shell connection to a remote computer so that it can perform local tests on it. The programs run on the remote machine are to a large extent local plugins (see Chapter 7 from page 133); the use of check_by_ssh is not just restricted to these, however.
The plugin sends a complete command line to the remote computer and then waits for a plugin-compatible response: a response status between 0 (OK) and 3 (UNKNOWN), as well as a one-line text information for the administrator (page 85). If you run network plugins via check_by_ssh in order to perform tests on other computers, these are known as indirect checks, which will be explained in the context of the Nagios Remote Plugin Executor in Section 10.5 from page 174.
The following example shows how check_by_ssh can be used to check the swap partition on the target computer:
nagios@linux:nagios/libexec$ ./check_by_ssh -H target computer \
-i /etc/nagios/.ssh/id_dsa \
-C "/usr/local/nagios/libexec/check_swap -w 50% -c 10%"
SWAP OK: 100% free (972 MB out of 972 MB) |swap=972MB;486;97;0;972
The command is similar to that for a secure shell, in the form of
ssh -i private_key target computer "command"
The fact that a separate private key—not the default private key in the home directory—is used, is optional and is described in detail in section 9.2 from page 160. The command to be run is specified in check_by_ssh—in contrast to the secure shell ssh— with the option -C, the plugin is always specified with an absolute path.
check_by_ssh has the following options:
-H address / --hostname=address
The host name or IP address of the computer to which the plugin should set up an SSH connection.
1In the nagios-users mailing list it was reported that Sun_SSH_1.0 returns a return code of 255 instead of 0, which makes it unsuitable for the deployment described here.
158

9.1 The check_by_ssh Plugin
-C command / --command=command
The command to be run on the remote computer, that is, the plugin with its complete path and all the necessary parameters:
-C "/usr/local/nagios/libexec/check_disk -w 10% -c 5% -e -m"
-1 / --proto1 (from nagios-plugins-1.4)
Force version 1 of the secure shell protocol.
-2 / --proto2 (from Version 1.4)
Force version 2 of the secure shell protocol.
-4 / --use-ipv4 (from version 1.4)
The SSH connection is set up explicitly over an IPv4 connection.
-6 / --use-ipv6 (from version 1.4)
The SSH connection is set up explicitly over an IPv6 connection.
-i keyfile / --identity=keyfile
Which file should be used instead of the standard key file containing the private key of the user nagios? For one option, which is recommended, see Section 9.2.3, page 162.
-p port / --port=port
This specifies the port if the Secure Shell daemon on the target server is not listening on the standard TCP port 22.
-l user / --logname=user
User name on the target host.
-w floating point decimal / --warning=floating point decimal
If the response to the command to be executed takes more than floating point decimal seconds, the plugin will issue a warning.
-c floating point decimal / --critical=floating point decimal
The critical value in seconds concerning the response time of the command to be executed.
-f2
Starts a background process without opening an interactive terminal (tty).
-t timeout / --timeout=timeout
After timeout seconds have expired, the plugin stops the test and returns the CRITICAL status. The default is 10 seconds.
2 There is currently no long form for this option.
159
9 Executing Plugins via SSH
In addition to this, check_by_ssh has parameters available, -O, -s and -n, enabling it to write the result in passive mode to the interface for external commands
(see section 13.1 from page 240). The mode is named this way because Nagios does not receive the information itself but reads it indirectly from the interface.
This procedure has the advantage of being able to run several separate commands simultaneously over a single SSH connection. This may cause the command definition to be rather complicated, however. Since the plugins themselves are called and executed as programs on the target server, it hardly matters whether the SSH connection is established once or three times. For this reason it is better to use a simple command definition rather than the passive mode.
But if you still want to find more information about this, you can look in the online help, which is called with check_by_ssh -h.
9.2 Configuring SSH
So that Nagios can run plugins over the secure shell remotely and automatically, it—or, strictly speaking, the user nagios on the Nagios server—must not be distracted by any password queries. This is avoided with a login via a Public Key mechanism.
9.2.1 Generating SSH key pairs on the Nagios server
The key pair required to do this is stored by the key generator ssh-keygen by default in the subdirectory .ssh of the respective user’s home directory (for the user nagios, this therefore corresponds to the installation guide in Chapter 1.1 from page 26, that is, /usr/local/nagios). If it is also sent on its way with the -f private keyfile option (without path specification), it will land in the current working directory, which in the following example is /etc/nagios/.ssh:
nagios@linux:˜$ mkdir /etc/nagios/.ssh nagios@linux:˜$ cd /etc/nagios/.ssh
nagios@linux:/etc/nagios/.ssh$ ssh-keygen -b 2048 -f id_dsa -t dsa -N ’’
Generating public/private dsa key pair.
Your identification has been saved in id_dsa. Your public key has been saved in id_dsa.pub. The key fingerprint is:
02:0b:5a:16:9c:b4:fe:54:24:9c:fd:c3:12:8f:69:5c nagios@nagserv
The length of the key here is 2048 bits, and DSA is used to encrypt the keys. -N ’ ’ ensures that the private key in id_dsa does not receive separate password protection: this option forces an empty password.
160

9.2 Configuring SSH
9.2.2 Setting up the user nagios on the target host
Similar to the configuration on the Nagios server, the group and the user nagios are also set up on the computer to be monitored:
target computer:˜ # groupadd -g 9000 nagios
target computer:˜ # useradd -u 9000 -g nagios -d /home/nagios -m \
-c "Nagios Admin" nagios
target computer:˜ # mkdir /home/nagios/.ssh
The target computer is given the directory /home/nagios as the home directory, where a subdirectory .ssh is created. In this the administrator (or another user3) saves the public key generated on the Nagios server /etc/nagios/.ssh/id_dsa.pub, in a file called authorized_keys:
linux:˜ # scp /etc/nagios/.ssh/id_dsa.pub \
target computer:/home/nagios/.ssh/authorized_keys
Now the user nagios does not require its own password on the target server. You just need to make sure that on the target server the .ssh directory, together with authorized_keys, belongs to the user nagios:
target computer:˜ # chown -R nagios.nagios /home/nagios/.ssh
target computer:˜ # chmod 700 /home/nagios/.ssh
9.2.3 Checking the SSH connection and check_by_ssh
With this configuration you should first check whether the secure shell connection is working properly. The test is performed as the user nagios, since Nagios makes use of this during the checks:
nagios@linux:˜$ |
ssh -i /etc/nagios/.ssh/id_dsa target computer w |
|||||
18:02:09 up 128 days, 10:03, |
8 users, |
load average: 0.01, 0.02, 0.00 |
||||
USER |
TTY |
FROM |
LOGIN@ |
IDLE |
JCPU |
PCPU WHAT |
wob |
pts/1 |
linux01:S.1 |
08Sep04 |
1:27 |
4.27s |
0.03s -bin/tcsh |
... |
|
|
|
|
|
|
The -i option explicitly specifies the path to the private key file. If the command w to be run on the target computer does not provide any output or if the opposite SSH daemon requests a password, then the login via public key is not working. In this case you must first find and eliminate the error before you can move on to testing check_by_ssh.
3. . . but not the user nagios, because when an account is created, useradd first sets an invalid password here, which we do not change into a valid one. This means that you cannot currently log in to the target computer as nagios.
161

9 Executing Plugins via SSH
In this next step, you run the local plugin on the target computer, with check_by_ ssh, which later on is run automatically, from the command line of the Nagios server. Make sure that the plugin paths are correct in each case. The path to the private key file of the user nagios on the server is specified with -i:
nagios@linux:˜$ /usr/local/nagios/libexec/check_by_ssh \ -H target computer -i /etc/nagios/.ssh/id_dsa \
-C "/usr/local/nagios/libexec/check_disk -w 10% -c 5% -e -m"
DISK CRITICAL [2588840 kB (5%) free on /net/linux04/b] [937152 kB (5%) free on /net/linux04/c]
In the example, check_by_ssh should start the /usr/local/nagios/libexec/check_ disk plugin on the target computer with the options -w 10% -c 5% -e -m. If this does not work, then this is first run locally on the target host with the same parameter. By doing this you can rule out that the problem lies in the plugin command itself and not in the secure shell connection.
9.3 Nagios Configuration
The matching command object is again defined in the file checkcommands.cfg; similar to check_local_disk, it should be named check_ssh_disk:
# check_ssh_disk command definition define command{
command_name check_ssh_disk
command_line $USER1$/check_by_ssh -H $HOSTADDRESS$ \ -i /etc/nagios/.ssh/id_dsa \
-C "$USER1$/check_disk -w $ARG1$ -c $ARG2$ -p $ARG3$"
}
The command line stored in command_line first runs check_by_ssh; $USER1$ contains the local plugin path on the Nagios server. Next come the arguments— the IP address of the target host (parameter -H), the private key file (parameter -i) and finally, with the -C parameter, the complete command that the target host should carry out. If the plugin path on the target host and on the Nagios server are identical, then you can also use the $USER1$ macro in it; otherwise the plugin path on the target computer is given explicitly.
Setting up the command is no different here to the one in check_local_disk in Section 7.1 on page 134. This means that apart from the warning and critical limits, we explicitly specify a file system or a hard drive partition, with the -p parameter.
The command check_ssh_disk defined in this way is applied as follows, here on a computer called linux02:
162

9.3 Nagios Configuration
define service{
host_name linux02 service_description FS_root
...
check_command check_ssh_disk!10%!5%!/
...
}
The service object defined in this way ensures that Nagios checks its / file system. The warning limit lies at 10 percent, the critical limit at 5 percent.
If you use the check_by_ssh plugin with check_ssh_disk, as in the example here, you must make sure that the plugin path is identical on all target hosts. This is also worth doing for reasons of simplicity, though it is not always possible in practice. The following service definition, for this reason, gives the plugin path to the target computer as an additional argument:
define service{
host_name linux02 service_description FS_root
...
check_command check_ssh_disk!/usr/lib/nagios/plugins!10%!5%!/
...
}
In order for this to work, you must change the command line in the command definition, passed on with -C, as follows:
-C "$ARG1$/check_disk -w $ARG2$ -c $ARG3$ -p $ARG4$"
Caution: this causes the numbers of each of the $ARGx macros for -w, -c, and -p to be shifted by one.
163

10
Chapter
The Nagios Remote Plugin
Executor (NRPE)
The Nagios Remote Plugin Executor (or in short, NRPE) as the name suggests, executes programs on a remote host. These are usually plugins that test the corresponding computer locally and therefore must be installed on it. The use of NRPE is not restricted to local plugins; any plugins at all can be executed, including those intended to test network services—for example, to indirectly test computers that are not reachable from the Nagios server (as shown in Section 10.5 from page 174).
While a genuine user account must be available on the remote computer when the secure shell is used (see Chapter 9), which can also be used to do other things than just start plugins, NRPE is restricted exclusively to explicitly configured tests. If you want to, or are forced to, do without a login shell on the target host, it is better to use NRPE, even if there is somewhat more configuration work involved than with the secure shell. In addition to the Nagios configuration and the installation of the required plugins on the target system:
165

10 The Nagios Remote Plugin Executor (NRPE)
The program nrpe must be installed on the target system.
The inet daemon there (inetd or xinetd) must be configured with administrator privileges.
The check_nrpe plugin must be installed on the Nagios server.
10.1 Installation
NRPE and the plugins are installed from the sources, or you can fall back on the packages provided by the distributor. You should use at least version 2.0 of NRPE, since this is incompatible with its predecessors. As this was released back in September 2003, there should now be corresponding packages for it.
Version 1.3.1 of the plugin collection is also from 2003; version 1.4 was only released at the beginning of 2005 and had not been integrated into all the standard distributions at the time of going to press. Whether you need the most up-to-date version depends on your expectations of the respective plugins.
10.1.1 Distribution-specific packages
SuSE Linux 9.3 includes the packages nagios-nrpe-2.0-111.i586.rpm, nagios-plug- ins-1.4-3.i586.rpm, and nagios-plugins-extras-1.4-3.i586.rpm. nagios-nrpe contains both the daemon and the plugin check_nrpe. nagios-plugins-extras installs several additional plugins, such as database checks, FPing test or Radius test, which can be omitted, depending on your specific monitoring needs.
For the sake of simplicity, the design packages are installed via YAST21 or rpm -ihv package. the second method is also open to Fedora users.
For Fedora Core 3, the corresponding Nagios packages have been made available by Dag Wieers at http://dag.wieers.com/home-made/apt/packages.php: nagios- nrpe-2.0-3.1.fc3.rf.i386.rpm, nagios-plugins-nrpe-2.0-3.1.fc3.rf.i386.rpm, and nagios-plugins-1.4-2.1.fc3.rf.i386.rpm.
Debian/Sarge distributes the NRPE daemon and the NRPE plugin check_nrpe in two different packages called nagios-nrpe-server and nagios-nrpe-plugin, which can be installed separately via apt-get install package. If you want to do without local documentation, you can omit the package nagios-nrpe-doc and just add the plugin package nagios-plugins to the target hosts.
The paths for the program nrpe, the configuration file nrpe.cfg, and the plugin directory are listed in Table 10.1.
1 On the command line, using yast -i package.
166

10.1 Installation
Distribution |
NRPE program |
NRPE configuration |
Plugins |
Table 10.1: |
|
|
file |
|
Installation paths for |
|
|
|
|
NRPE and plugins |
Self- |
/usr/local/sbin/nrpe |
/etc/nagios/nrpe.cfg |
/usr/local/nagios/libexec |
|
compiled2 |
|
|
|
|
SuSE |
/usr/bin/nrpe |
/etc/nagios/nrpe.cfg |
/usr/lib/nagios/plugins |
|
Debian |
/usr/sbin/nrpe |
/etc/nagios/nrpe.cfg |
/usr/lib/nagios/plugins |
|
Fedora3 |
/usr/sbin/nrpe |
/etc/nagios/nrpe.cfg |
/usr/lib/nagios/plugins |
|
10.1.2 Installation from the source code
The plugins are installed on the computers to be monitored exactly as described in Section 1.2 from page 30 for the Nagios server.
The NRPE source code is obtained from The Nagios Exchange.4 The directory /usr /local/src5 is ideal for unloading the sources.
linux:˜ # mkdir /usr/local/src linux:˜ # cd /usr/local/src
linux:local/src # tar xvzf /path/to/nrpe-2.0.tar.gz
In the new directory that has been created, you run the configure command:
linux:local/src # cd nrpe-2.0
linux:src/rnpe-2.0 # ./configure --sysconfdir=/etc/nagios --enable-ssl
The recommended path specifications are listed in Table 10.1. The only difference from the default settings are for the directory in which the NRPE configuration file is stored (configure option --sysconfdir).
Accordingly, we can leave out the entry for --with-nrpe-user and --with-nrpe- group in the configure command. Both options are relevant only if the nrpe program is running as a daemon, and they can be overwritten in the configuration file. If the inet daemon is used, you should specify the user with whose permissions nrpe should start in the configuration file for the inet daemon.
--enable-ssl ensures that NRPE communicates over an SSL-encrypted channel. This will only work, of course, if both nrpe on the target host and check_nrpe on the Nagios server have both been compiled accordingly.
2 |
Recommended. |
3 |
From the packages provided by Dag Wieers. |
4 |
http://www.nagiosexchange.org/NRPE.77.0.html. |
5 |
The subdirectory src may need to be created first. |
167

10 The Nagios Remote Plugin Executor (NRPE)
The command make all compiles the programs nrpe and check_nrpe, but it does not copy them from the directory /usr/local/src/nrpe-2.0/src to the corresponding system directories. Since there is no make install, you must do this yourself, following the details in Table 10.1: you need to have nrpe on the computer to be monitored and the check_nrpe plugin on the Nagios server.
If the Nagios server and the target host used the same platform, you can compile both programs on one computer (e.g., the server) and then copy nrpe together with its configuration file to the computer to be monitored, instead of separately compiling check_nrpe on the Nagios server and nrpe on the target system.
10.2 Starting via the inet Daemon
It is best to start the program nrpe on the machine to be monitored via the inet daemon rather than as a separate daemon, since the Nagios server only performs the tests occasionally, and nrpe does not need to load any large resources.
If you have a choice, you should use the more modern xinetd. But to keep work to a minimum, the inet daemon will normally be used, as it is already running on the target system.
In order that NRPE can be started as a service via inetd or xinetd, the nrpe service is defined in the file /etc/services:
nrpe 5666/tcp # Nagios Remote Plugin Executor NRPE
Even if this has been installed as a distribution package, you should still check to see whether this entry exists. By default, NRPE uses TCP port 5666.
10.2.1 xinetd configuration
If xinetd is used, a separate file is stored in the directory /etc/xinetd.d for each service to be started, so for nrpe it is best to create a file called nrpe or nagiosnrpe:
#/etc/xinetd.d/nrpe
#description: NRPE
#default: on service nrpe
{
flags |
= REUSE |
|
socket_type |
= stream |
|
wait |
= no |
|
user |
= |
nobody |
group |
= |
nogroup |
168

10.2 Starting via the inet Daemon
server |
= /usr/local/sbin/nrpe |
|
server_args |
= -c /etc/nagios/nrpe.cfg --inetd |
|
log_on_failure |
+= USERID |
|
disable |
= |
no |
only_from |
= |
127.0.0.1 ip of_the_nagios_server |
}
The values printed in italics are passed on to your own environment; instead of the placeholder ip of the nagios server you should enter, for example for only_from, the IP address of your own Nagios server. The NRPE access from outside is then restricted to this computer and to localhost (127.0.0.1). The latter address allows local tests; multiple IP addresses are separated by a space. However, this restrictive configuration functions only if xinetd has been compiled with support for the TCP wrapper (this is normally the case).
Under no circumstances should NRPE run with the permissions of a privileged user—nobody is therefore a sensible value. The server parameter specifies the complete path to the program nrpe; for server_args you should enter the matching path to the configuration file. After this modification, the configuration of xinetd is reloaded, with
linux:˜ # /etc/init.d/xinetd reload
10.2.2 inetd configuration
In the standard inetd, the following line is added to the configuration file /etc/ inetd.conf:
nrpe stream tcp nowait nobody /usr/sbin/tcpd
/usr/local/sbin/nrpe
-c /etc/nagios/nrpe.cfg --inetd
The line has been split up for reasons of space, but in the configuration file this must all be in a single line. Here the TCP wrapper tcpd is used. If this is not intended, you simply leave out this entry.6 Here you should also explicitly enter the user nobody, the complete path to the binary nrpe, and the configuration file, also with its complete path. These strings, printed above in italics, should be adjusted to your own system, where necessary. After the configuration change, inetd is reloaded:
linux:˜ # /etc/init.d/inetd reload
6inetd does not have a built-in method to allow access to services only from specific IP addresses. This function is added in the TCP wrapper tcpd. The access configuration is then taken over by the files /etc/hosts.allow and /etc/hosts.deny. More information on this is given by man host_access.
169
10The Nagios Remote Plugin Executor (NRPE)
10.3NRPE Configuration on the Computer to Be Monitored
When compiling NRPE, the file nrpe.cfg is created in the source directory, which contains several parameters as well as the commands to run NRPE. These are copied manually to the configuration directory, which normally first has to be created on the target computer:
linux:src/rnpe-2.0 # mkdir /etc/nagios linux:src/rnpe-2.0 # cp nrpe.cfg /etc/nagios/.
Distribution-specific packages are unpacked from the location specified in Table 10.1 on page 167.
nrpe is given the permissions of the user at runtime specified in the inet daemon configuration, which in our case is that of nobody. Therefore nrpe.cfg needs to be readable for this user. As long as the file does not contain any passwords (these really should not be used) or other critical information, then read permissions for all can be allowed.
The configuration file contains many comments; the following command displays the active parameters:7
user@linux:˜$ egrep -v ’ˆ#|ˆ$’ nrpe.cfg | less server_port=5666
allowed_hosts=127.0.0.1 nrpe_user=nobody nrpe_group=nogroup dont_blame_nrpe=0 debug=0 command_timeout=60
...
The parameters server_port, allowed_hosts, nrpe_user, and nrpe_group are only relevant if nrpe is working as a daemon. When the inet daemon is used, the program ignores these values since they have already been determined by the (x)indetd configuration.
The entry dont_blame_nrpe=0 prevents nrpe from accepting parameters, thus closing a potential security hole. debug=1 allows extensive logging, useful if you are looking for errors (debug=0 switches off the output for debugging information), and command_timeout specifies a timespan in seconds after which nrpe abruptly interrupts a plugin that has hung. Comments in the configuration file explain all these parameters as well.
7The regular expression ^#|^$ matches all lines that either begin with a comment sign # or that consist of an empty line. The option -v ensures that egrep shows all lines that are not matched by this.
170

10.3 NRPE Configuration on the Computer to Be Monitored
After this, the commands are defined that are to be executed by NRPE. The configuration file nrpe.cfg already contains some, but first they all have to be commented out, and only those commands activated that really are intended for use.
The keyword command is followed in square brackets by the name with which check_nrpe should call the command. After the equals sign (=), the corresponding plugin command is specified, with its complete path:8
command[check_users]=/usr/local/nagios/libexec/check_users -w 5 -c 10 command[check_load]=/usr/lib/nagios/libexec/check_load -w 8,5,3
-c 15,10,7
command[check_zombies]=/usr/lib/nagios/libexec/check_procs -w :1 -c :2 -s Z
With the path, care must be taken that this really does point to the local plugin directory. In the directory specified here, /usr/local/nagios/libexec, the self-compiled plugins are located9; and for installations from distribution packages the path is usually /usr/lib/nagios/plugins.
From the Nagios server, the command just defined, check_users is now run on the target computer via check_nrpe:
nagios@linux:nagios/libexec$ ./check_nrpe -H target host -c check_users
10.3.1 Passing parameters on to local plugins
The method described so far has one disadvantage: for each test on the target system, a separately defined command is required for this. Here is the example of a server on which the plugin check_disk (see Section 7.1 from page 134) is required to monitor nine file systems:
command[check_disk_a]=path/to/check_disk -w 5% -c 2% -p /net/linux01/a command[check_disk_b]=path/to/check_disk -w 4% -c 2% -p /net/linux01/b command[check_disk_c]=path/to/check_disk -w 5% -c 2% -p /net/linux01/c command[check_disk_d]=path/to/check_disk -w 5% -c 2% -p /net/linux01/d command[check_disk_root]=path/to/check_disk -w 10% -c 5% -p / command[check_disk_usr]=path/to/check_disk -w 10% -c 5% -p /usr command[check_disk_var]=path/to/check_disk -w 10% -c 5% -p /var command[check_disk_home]=path/to/check_disk -w 10% -c 5% -p /home command[check_disk_tmp]=path/to/check_disk -w 10% -c 5% -p /tmp
To avoid all this work, NRPE can also be configured so that parameters may be passed on to check_nrpe:
8The check_users command is explained in Section 7.6 from page 144, check_load is explained in Section 7.3 from page 137, and Section 7.4 from page 138 deals with check_procs.
9 . . . provided you have followed the instructions in the book.
171

10 The Nagios Remote Plugin Executor (NRPE)
dont_blame_nrpe=1
...
command[check_disk]=path/to/check_disk -w $ARG1$ -c $ARG2$ -p $ARG3$
In order for this to work, the NRPE configure script must be run with the option --enable-command-args. The reason for this inconvenient procedure is that passing parameters on is a fundamental risk, since it cannot be ruled out that a certain choice of parameters could cause an (as yet unknown) buffer overflow, allowing the target system to be penetrated.
If you still decide on this, despite all the security risks, you should use a TCP wrapper (see Section 10.2.2, page 169), to ensure that only the Nagios server itself is allowed to send commands to NRPE.
If the plugin provides the corresponding options, there is sometimes a third method, however: the above-mentioned problem can also be solved by getting check_disk, if necessary, to test all file systems with one single command:
user@linux:nagios/libexec$ ./check_disk -w 10% -c 4% -e -m
DISK WARNING [2588840 kB (5%) free on /net/linux1/b] [937160 kB (5%) free on /net/linux1/c]
The -e parameter persuades the plugin to display only those file systems that produced a warning or an error. One restriction remains: the warning and critical limits are, by necessity, the same for all file systems.
10.4 Nagios Configuration
Commands that “trigger” local plugins on remote computers via check_nrpe are defined as before in the file checkcommands.cfg on the Nagios server.
10.4.1 NRPE without passing parameters on
If no parameters are passed on to the target plugin, things will look like this:
define command{ command_name check_nrpe
command_line $USER1$/check_nrpe -H $HOSTADDRESS$ -c $ARG1$
}
As the only argument, Nagios passes the command here that NRPE is to execute. If the check_nrpe plugin on the Nagios server is located in a different directory to the other plugins, you must enter the correct path instead of $USER1$.
172

10.4 Nagios Configuration
A service to be tested via NRPE uses the command just defined, check_nrpe, as check_command. As an argument, the command is specified that was defined in nrpe.cfg on the target system (here: linux04):
define service{
host_name linux04 service_description FS_var
...
check_command check_nrpe!check_disk_var
...
}
10.4.2 Passing parameters on in NRPE
In order to address the command defined in Section 10.3.1 on page 171
command[check_disk]=path/to/check_disk -w $ARG1$ -c $ARG2$ -p $ARG3$
from the Nagios server, the check_nrpe is given the corresponding arguments through the option -a:
define command{ command_name check_nrpe
command_line $USER1$/check_nrpe -H $HOSTADDRESS$ -c $ARG1$ -a $ARG2$
}
So that $ARG2$ can correctly transport the parameters for the remote plugin, these are separated by spaces in the service definition. in addition, you should ensure that the order is correct:
define service{
host_name linux04 service_description FS_var
...
check_command check_nrpe!check_disk!10% 5% /var
...
}
The locally installed check_disk on linux04 distributes the three strings 10%, 5%, and /var to its own three macros $ARG1$, $ARG2$, and $ARG3$ for the command defined in nrpe.cfg.
10.4.3 Optimizing the configuration
If the NRPE commands are given identical names on all target systems, then all NRPE commands with the same name can be included in a single service definition.
173

10 The Nagios Remote Plugin Executor (NRPE)
When doing this you can make use of the possibility of specifying several hosts, or even an entire group of hosts:
define service{
host_name linux04,linux02,linux11 service_description FS_var
...
check_command check_nrpe!check_disk_var
...
}
With the command check_disk_var, defined at the beginning of Section 10.3.1 on page 171, Nagios now checks the /var file systems on the computers linux04, linux02, and linux11. If other file systems are to be included in the test, a separate service is created for each one, thus avoiding the security problem involved in passing parameters on. If you use the option of testing all file systems at the same time, with the check_disk plugin (see Section 7.1), then ultimately, one single service definition is sufficient to monitor all file systems on all Linux servers— provided you have a corresponding NRPE configuration on the target system:
define service{
hostgroup_name linux-servers service_description Disks
...
check_command check_nrpe!check_disk
...
}
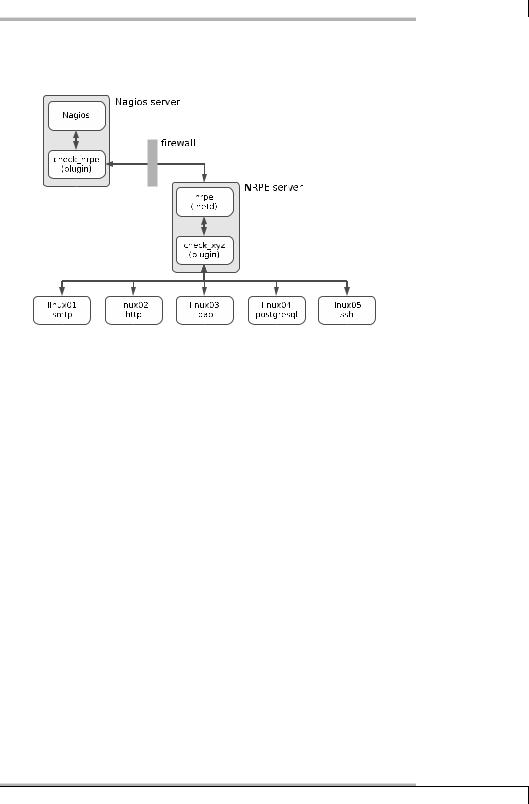
10.5 Indirect Checks
NRPE executes not just local plugins, but any plugins that are available. If you use network plugins via NRPE, these are referred to as indirect checks, as illustrated graphically in Figure 1.
If every network service was tested directly across the firewall, it would have to open all the required ports. In the example, these would be the ports for SMTP, HTTP, LDAP, PostgreSQL, and SSH. If the checks are performed indirectly from a computer that is behind the firewall, on the other hand, then it is sufficient just to have the port for NRPE (TCP port 5666) open on the firewall. As long as it is configured via NRPE, the NRPE server behind the firewall can perform any tests it wants.
174
10.5 Indirect Checks
Figure 10.1:
Indirect checks with
NRPE
Whether the effort involved in indirect checks is greater than that for direct ones is dependent on the specific implementation: if this means that you would have to “drill holes into your firewall,” then the additional work on the NRPE server may be worthwhile. But if the ports involved are open anyway, then the direct test can usually be recommended; this would make additional configuration work on an NRPE host unnecessary.
175

11
Chapter
Collecting Information Relevant
for Monitoring with SNMP
SNMP stands for Simple Network Management Protocol, a protocol defined above all to monitor and manage network devices. This means being able to have not only read access, but also write access to network devices, so that you can turn a specific port on a switch on or off, or intervene in other ways.
Nearly all network-capable devices that can also be addressed via TCP/IP can handle SNMP, and not just switches and routers. For Unix systems there are SNMP daemons; even Windows servers contain an SNMP implementation in their standard distribution, although this must be explicitly installed. But even uninterruptible power supplies (UPSs) or network-capable sensors are SNMP-capable.
If you are using Nagios, then at some point you can’t avoid coming into contact with SNMP, because although you usually have a great choice of querying techniques for Unix and Windows systems, when it comes to hardware-specific com-
177

11 Collecting Information Relevant for Monitoring with SNMP
ponents such as switches, without their own sophisticated operating system, then SNMP is often the only way to obtain information from the network device. SNMP certainly does not have a reputation of being easy to understand, which among other things lies in the fact that it is intended for communication between programs, and machine processing is in the foreground. In addition, you generally do not make direct contact with the protocol and with the original information, since even modems or routers provide a simple-to-operate interface that disguises the complexity of the underlying SNMP.
If you want to use SNMP with Nagios, you cannot avoid getting involved with the information structure of the protocol. Section 11.1 therefore provides a short introduction to SNMP. Section 11.2 from page 184 introduces NET-SNMP, probably the most widely used implementation for SNMP on Unix systems. On the one hand it shows how to obtain an overview of the information structure of a network device with command-line tools, and on the other it describes the configuration of the SNMP daemon in Linux. Finally, Section 11.3 from page 196 is devoted to the concrete use of SNMP with Nagios.
11.1 Introduction to SNMP
Although SNMP contains the P for “protocol” in its name, this does not stand for a protocol alone, but is used as a synonym for the Internet Standard Management Framework. This consists of the following components:
Manageable network nodes that can be controlled remotely via SNMP. A specific implementation of an SNMP engine, whether by software or hardware, is referred to as an agent.
At least one SNMP unit consisting of applications with which the agents can be managed. This unit is referred to as a manager.
A protocol with which agent and manager can exchange information: the Simple Network Management Protocol (SNMP).
A well-defined information structure, so that any managers and agents can understand each other: the so-called Management Information Base, or in short, MIB.
The framework assigns the manager the active role. The agent itself just waits passively for incoming commands. In addition, so-called traps extend the application possibilities of SNMP: these are messages that the agent actively sends to a single manager or a whole group of managers, for example if predefined limit values are exceeded or if functions of the network device fail.
178

11.1 Introduction to SNMP
As agents, SNMP engines implemented by the manufacturer are used for hardwarespecific devices (switches, routers). For Linux and general Unix systems, the NETSNMP implementation is available (see Section 11.2), for Windows servers there is equivalent software already included with the operating system.
In combination with Nagios, there are two possibilities. With respect to Nagios in the active role, corresponding Nagios plugins, as the manager, ask the agents for the desired information. The other way round, Nagios can also passively receive incoming SNMP traps using utilities and process these. Section 14.6 from page 260 is devoted to this topic.
An understanding of the SNMP information structure, the so-called Management Information Base (MIB), is critical if you want to use SNMP with Nagios successfully. For this reason this section will focus on this. The protocol itself is only mentioned briefly to illustrate the differences between different protocol versions.
If you want to get involved more deeply with SNMP, we refer you to the numerous Request for Comments (RFCs) describing SNMP. The best place to start would be in RFC 3410, “Introduction and Applicability Statements for Internet Standard Management Framework”, and RFC 3411: “An Architecture for Describing Simple Network Management Protocol (SNMP) Management Frameworks.” Apart from an introduction and numerous cross-links, you will also find references there to the original documents of the older versions, today referred to as SNMPv1 and SNMPv2.
11.1.1 The Management Information Base
The SNMP information structure consists of a hierarchical namespace construction of numbers. Figure 11.1 shows an extract from this. The tree structure is similar to those of other hierarchical directory services, such as DNS or LDAP.
Its root is called 1 (iso) and stands for the International Organization for Standardization. The next level, 3 (org) shown in Figure 11.1 provides a space for general, national and international organizations. Beneath this is 6 (dod) for the U.S. Department of Defense. The general (IP-based) internet owes its assignment as a subitem 1 (internet) of dod to its origin as a military project.
If you bring together the corresponding numbers from left to right and separate them with the dot, then for the internet node in the tree, you arrive at the designation 1.3.6.1. Such nodes are referred to in general as object identifiers (OID). Their syntax is used not only in SNMP but also in the definition of LDAP objects and attributes, for example.
The OID 1.3.6.1 is not exactly easily readable for humans, which is why other notation methods have gained acceptance: both iso.org.dod.internet and the combination iso(1).org(3).dod(6).internet(1) is allowed. Because this would quickly make readable descriptions infinitely long if the tree were deep enough, another
179
11 Collecting Information Relevant for Monitoring with SNMP
abbreviated notation method has become established: as long as the term remains unique, you may simply write internet instead of 1.3.6.1.
The important thing here is that the communication between manager and agent is exclusively of a numerical nature. Whether the manager also allows text input or is capable of issuing information as text instead of as a numeric OID depends on the implementation in each case. The information on individual nodes is provided by the manufacturer of the SNMP agent as a Management Information Base (MIB) in file form.
Figure 11.1: SNMP namespace using the example of the MIB-II interfaces
The data stored in the MIB includes contact information (who designed the MIB; usually the manufacturer of the device will be given here), the definition of individual subnodes and attributes, and the data types used. If an MIB file also describes the individual subnodes and attributes, this puts the manager in a position to supply the user with additional information on the meaning and purpose of the entry in question.
180

11.1 Introduction to SNMP
Below internet, the next level is divided into various namespaces. The management node 1.3.6.1.2 is especially important for SNMP, that is, iso(1).org(3).dod(6).internet(1).mgmt(2). The namespace here is described by RFC 1155, “Structure and Identification of Management Information for TCP/IP-based Internets.”
In order for manager and agent to be able to understand each other, the manager needs to know how the agent structures its data. This is where the Management Information Base, Version II comes into play. SNMP requests information from the agents on their implementation; with this, every manager can access the most important parameters of the agent, without a previous exchange of MIB definitions. The Management Information Base II, or MIB-II (or mib-2) for short, can be found in the namespace at 1.3.6.1.2.1 or iso(1).org(3).dod(6).internet(1).mgmt(2).mib- 2(1). Since it is well-defined and unique, OIDs lying beneath that are usually described in short, starting with MIB-II or mib-2.
Manufacturer-specific information can also be defined in your own Management Information Base. Corresponding MIBs are located beneath internet.private.enterprise. Once an OID has been described in an MIB, the meaning of this entry may never be changed. The description format for an MIB is standardized by RFC 1212, which is the reason that special MIBs, included by a vendor for its agents, can be integrated into almost any manager.
MIB-II
MIB-II, the Management Information Base , which is obligatory for all SNMP agents, contains several information groups. The most important of these are summarized in Table 11.1. The notation mib-2.x stands for 1.3.6.1.2.1.x.
Group |
OID |
Description |
|
|
|
system |
mib-2.1 |
Information on the device, (e.g., the location, contact |
|
|
partner, or uptime) |
interfaces |
mib-2.2 |
Information on the network interfaces (Name, inter- |
|
|
face type, status, statistics etc.) |
at |
mib-2.3 |
Assignment of physical addresses (e.g., of MAC ad- |
|
|
dresses) to the IP address (Address Translation Table) |
ip |
mib-2.4 |
Routing tables and IP packet statistics |
icmp |
mib-2.5 |
Statistics on individual ICMP packet types |
tcp |
mib-2.6 |
Open ports and existing TCP connections |
udp |
mib-2.7 |
ditto for UDP |
host |
mib-2.25 |
Information on storage media, devices, running pro- |
|
|
cesses and their use of resources |
Table 11.1: MIB-II groups (a selection)
181

11 Collecting Information Relevant for Monitoring with SNMP
How you specifically handle information stored in the MIB-II can be explained using the example of the interfaces group: Figure 11.1 shows how they are split up into the two OIDs interfaces.ifNumber and interfaces.ifTable. This is because one network node initially reveals an unknown number of interfaces. This number is taken up by ifNumber. Before looking at these interfaces more closely, a manager can get the information from ifNumber about how many there really are.
ifTable then contains the actual information on the different interfaces. To obtain this information for a specific interface, the manager queries all the entries in which the last number is the same, like this:
ifEntry.ifIndex.1 = INTEGER: 1 ifEntry.ifDescr.1 = STRING: eth0 ifEntry.ifType.1 = INTEGER: ethernetCsmacd(6) ifEntry.ifMtu.1 = INTEGER: 1500 ifEntry.ifSpeed.1 = Gauge32: 100000000
ifEntry.ifPhysAddress.1 = STRING: 0:30:5:6b:70:70 ifEntry.ifAdminStatus.1 = INTEGER: up(1) ifEntry.ifOperStatus.1 = INTEGER: up(1)
...
ifIndex describes the device-internal index—SNMP always starts counting from 1, switches start counting here from 100. ifDescr contains the name of the interface, here eth0—this is obviously a Linux machine. It can be assumed from the next four entries that a normal 100-MBit Ethernet interface is involved. If ethernetCsmacd is given as the interface typeifType,1 that is, Ethernet. ifMtu specifies the Maximum Transfer Unit, which in local networks is always 1500 bytes for Ethernet. The interface speed ifSpeed is 100,000,000 bits here, that is, 100 MBit. And ifPhysAddress contains the physical network address, also called the MAC address.
ifAdminStatus reveals whether the admin has switched the interface on (up) or off (down) via the configuration. ifOperStatus on the other hand specifies the actual status, since even interfaces activated by an administrator are not necessarily connected to a device, or even switched on.
There is a similar picture for the second interface:
ifEntry.ifIndex.2 = INTEGER: 2 ifEntry.ifDescr.2 = STRING: lo
ifEntry.ifType.2 = INTEGER: softwareLoopback(24) ifEntry.ifMtu.2 = INTEGER: 16436 ifEntry.ifSpeed.2 = Gauge32: 10000000 ifEntry.ifPhysAddress.2 = STRING: ifEntry.ifAdminStatus.2 = INTEGER: up(1)
1Carrier Sense (CS) means that each network interface checks to see whether the line is free, based on the network signal (in contrast to Token Ring, for example, where the network card may use the line only if it explicitly receives a token); Multiple Access (MA) means that several network cards may access a common network medium simultaneously.
182

11.1 Introduction to SNMP
ifEntry.ifOperStatus.2 = INTEGER: up(1)
...
This is not an ethernet card here, however, but a local loopback device.
11.1.2 SNMP protocol versions
The first SNMP version and Internet Standard Management Framework were described back in 1988 in RFCs 1065–1067; the current documentation on this version, named SNMPv1, can be found in RFC 1155–1157. It is still used today, since higher versions are fundamentally backward-compatible.
The big disadvantage of SNMPv1 is that this version allows only unsatisfactory authentication in precisely three stages: no access, read access, and full access for read and write operations. Two simple passwords, the so-called communities, provide a little protection here: they divide users into one community with read permissions, and the second one with read and write permissions. No further differentiation is possible. If this was not enough, the community is transmitted in plain text, making it an easy pray for sniffer tools.
Further development on the second version, SNMPv2, was intended to solve problems concerning the display of value ranges, error events, and the performance if there are mass requests (RFC 1905). This RFC was never fully implemented, however. The only relatively complete implementation that was used in practice is known as the Community-based SNMPv2, or SNMPv2c for short (RFC 1901– 1908). The current version, SNMPv3 (RFC 3411–3418), has the status of an Internet standard. Agents with SNMPv3 implementations always understand requests from SNMPv1.
Apart from extended protocol operations, there are no fundamental differences between SNMPv1 and SNMPv2c. This is probably also the reason why SNMPv2 could not really gain a foothold. The hoped-for increase in security was certainly missing in this version. It is only the extensions of the framework in SNMPv3 which allow more precise access control, but this is much more complicated than the two community strings in SNMPv1. RFC 3414 describes the user-based security model
(USM), RFC 3415 the view-based access control model (VACM).
When accessing an SNMP agent, you must tell all tools, including plugins, which protocol version is to be used. In Nagios you exclusively require read access. If this is restricted to the required information and you only allow the access from the Nagios server, you need have no qualms about doing without the extended authentication of SNMPv3. It is only important that you configure the agent— if possible—so that it completely prevents write accesses, or at least demands a password. You should never use this: since it is transmitted in plain text, there is always a danger that somebody may be listening, and misuse the password later on.
183

11 Collecting Information Relevant for Monitoring with SNMP
In NET-SNMP, write accesses can be completely prevented, access can be restricted to specific hosts, and information revealed can be limited. For other agents implemented in hardware such as switches and routers, you must weigh up whether you really need SNMPv3, assuming the manufacturer has made this available. SNMPv1, however, is available for all SNMP devices.
We will therefore only explain access via SNMPv1 below, and assume that this is generally read access only. If you still want to get involved with SNMPv3, we refer you to the NET-SNMP documentation.2
11.2 NET-SNMP
Probably the most widely used SNMP implementation for Linux and other UNIX systems is NET-SNMP3 and was originally conceived at Carnegie-Mellon University. Wes Hardacker, a system administrator at the University of California in Davis, continued developing the code and first published it under the name UCD-SNMP (Version 3.0).
With version 5.0 the project finally got the name NET-SNMP. But various distributions still call the package UCD-SNMP, in part because it contains version 4.2, in part because the maintainer has simply not gotten around to renaming it.
NET-SNMP consists of a set of command line tools, a graphic browser (tkmib), an agent (snmpd, see Section 11.2.2 on page 187) and a library, which now forms the basis of nearly all SNMP implementations in the Open Source field.
All common distributions include corresponding packages. In SuSE this is called net-snmp and contains all the components; Debian packs the tools in the package snmp, and the daemon in the package snmpd. At the time of going to press, version 5.2.1 was the current version, but an older version (even 4.2) will do the job for our purposes. Their outputs differ to some extent, but the exact options can be looked up where necessary in the manpage.
11.2.1 Tools for SNMP requests
Command line tools snmpget, snmpgetnext and snmpwalk
For read access, the programs snmpget, snmpgetnext and snmpwalk are used. snmpget specifically requests a single OID and returns a single value from it. snmpgetnext displays the next variable existing in the Management Information Base, including its value:
2 http://net-snmp.sourceforge.net/docs/FAQ.html#How_do_I_use_SNMPv__ 3 http://net-snmp.sourceforge.net/
184

11.2 NET-SNMP
user@linux:˜$ snmpget -v1 -c public localhost ifDescr.1
IF-MIB::ifDescr.1 = STRING: eth0
user@linux:˜$ snmpgetnext -v1 -c public localhost ifDescr.1
IF-MIB::ifDescr.2 = STRING: lo
user@linux:˜$ snmpgetnext -v1 -c public localhost ifDescr.3
IF-MIB::ifType.1 = INTEGER: ethernetCsmacd(6)
The option -v1 instructs snmpget to use SNMPv1 as the protocol. With -c you specify the read community an; in this case then, the password is public. This is followed by the computer to be queried, here localhost, and finally there is the OID whose value we would like to find out.
The NET-SNMP tools are masters of OID abbreviation: without special instructions, they always assume that an OID is involved which lies inside the MIB-II. For unique entries such as ifDescr.1, this is sufficient. But whether the various SNMP plugins for Nagios can also handle this depends on the specific implementation; it is best to try out cases on an individual basis. To be on the safe side, it is better to use complete OIDs, either numerical in readable form. The latter is obtained if you instruct snmpget to display the full OID:
user@linux:˜$ snmpget -v1 -On -c public localhost ifDescr.1
.1.3.6.1.2.1.2.2.1.2.1 = STRING: eth0
user@linux:˜$ snmpget -v1 -Of -c public localhost ifDescr.1
.iso.org.dod.internet.mgmt.mib-2.interfaces.ifTable.ifEntry.ifDescr.1 = STRING: eth0
The -On option provides the numerical OID, -Of the text version. In this way you can easily find out the complete OID, for plugins which cannot handle the abbreviation. It is important to remember here: each OID always starts with a period. If you omit this, there will always be a plugin which doesn’t work properly.
In order to obtain the entire information stored in the MIB-II, it is better to use snmpwalk. As the name suggests, the program takes a walk through the Management Information Base, either in its entirety or in a specified part of the tree. If you would like to find out about all the entries beneath the node mib-2.interfaces (Figure 11.1 on page 180), you simply give snmpwalk the required OID:
user@linux:˜$ snmpwalk -v1 -c public localhost mib-2.interfaces
IF-MIB::ifNumber.0 = INTEGER: 3
IF-MIB::ifIndex.1 = INTEGER: 1
IF-MIB::ifIndex.2 = INTEGER: 2
IF-MIB::ifIndex.3 = INTEGER: 3 IF-MIB::ifDescr.1 = STRING: eth0 IF-MIB::ifDescr.2 = STRING: lo IF-MIB::ifDescr.3 = STRING: eth1 IF-MIB::ifType.1 = INTEGER: ethernetCsmacd(6)
...
185

11 Collecting Information Relevant for Monitoring with SNMP
snmpwalk hides the exact structure slightly (links to ifTable and ifEntry are missing, for example, see Figure 11.1), so that it is better to use -Of:
user@linux:˜$ snmpwalk -v1 -Of -c public localhost mib-2.interfaces
...mib-2.interfaces.ifNumber.0 = INTEGER: 3
...mib-2.interfaces.ifTable.ifEntry.ifIndex.1 = INTEGER: 1
...mib-2.interfaces.ifTable.ifEntry.ifIndex.2 = INTEGER: 2
...mib-2.interfaces.ifTable.ifEntry.ifIndex.3 = INTEGER: 3
...mib-2.interfaces.ifTable.ifEntry.ifDescr.1 = STRING: eth0
...mib-2.interfaces.ifTable.ifEntry.ifDescr.2 = STRING: lo
...mib-2.interfaces.ifTable.ifEntry.ifDescr.3 = STRING: eth1
...mib-2.interfaces.ifTable.ifEntry.ifType.1 = INTEGER: ethernetCsmacd(6)
The three dots . . . in the version here abbreviated for print stand for .iso.org.dod.internet.mgmt.
As the next step, you could take a look around your own network and query the Management Information Bases available there. Normally you will get quite far with the read community public, since this is often the default setting. So you should also try out the community string private, which is the default set by many vendors. An extremely dubious practice, by the way: anyone who knows a bit about SNMP and who has access to the network can use this to manipulate device settings, such as switching off certain ports or the entire switch. But even with all the other default passwords, you should take the trouble to change them. Entire password lists can be found on the Internet, sorted by vendors and devices—easily found through Google.
Whether you also change the preset read community (such as public) depends on the information available on it and on your own security requirements. But the read-write community should under no circumstances retain the default setting. In addition it is recommended that you switch off SNMP completely for devices that are neither queried nor administrated via SMNP, just to be on the safe side.
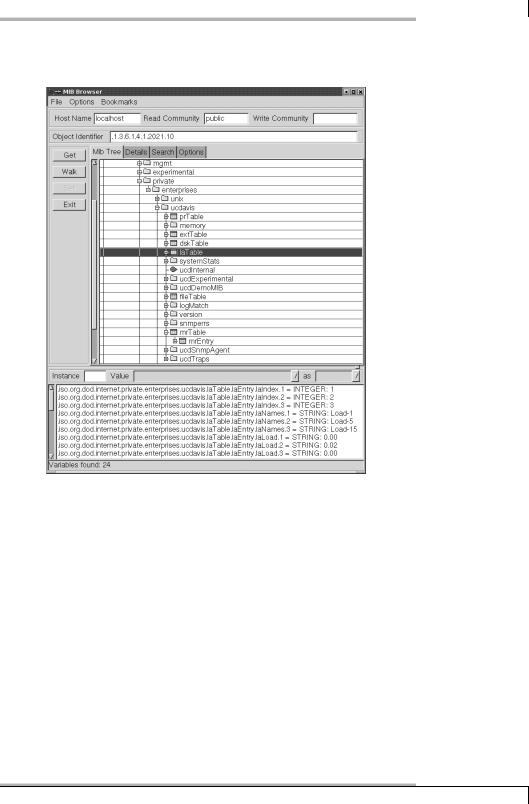
Taking a graphic walk with mbrowse
A graphic interface is often recommended for interactive research and for initial explorations of the Management Information Base, such as the SNMP browser mbrowse4 (see Figure 11.2). This is not a component of NET-SNMP, but most Linux distributions provide an mbrowse package for installation.
4 http://www.kill-9.org/mbrowse/
186
11.2 NET-SNMP
Figure 11.2: SNMP browser mbrowse
If you highlight an entry and click on the Walk button, the lower window displays the same output as snmpwalk. The graphical display, however, allows better orientation—it is easier to see in which partial tree you are currently located. It is also interesting that mbrowse shows the numeric OID of each selected object, in
Object Identifier.
11.2.2 The NET-SNMP daemon
The NET-SNMP daemon snmpd works as an SNMP agent for Linux and other Unix systems; that is, it answers requests from a manager and also provides a way of making settings to the Linux system via write accesses, such as manipulating the routing table.
187

11 Collecting Information Relevant for Monitoring with SNMP
Supported Mangement Information Bases
The agent initially provides information on the MIB-II described in RFC 1213 (Section 11.1.1 from page 179), but also the host extensions belonging to this from RFC 2790 (host MIB). Table 11.2 summarizes the groups of the host MIB, and the most important MIB-II groups are introduced in Table 11.1 (page 181).
If you are interested in a detailed description of the MIB-II, including the host MIB, we refer you to the MIB browser of TU Braunschweig.5 In addition to the basic MIBII, the NET-SNMP implementation has its own extension at private.enterprises.ucdavis (UCD-SNMP-MIB). The directives given in table 11.3 refer to instructions in the configuration file snmpd.conf (see page 190). Some of the information here is also given in the host resource MIB.
Table 11.2:
Components of the
Host Resources MIB
mib-2.host
(RFC 2790)
Table 11.3: Extract from the UCD-SNMP-MIB
Group |
OID |
Description |
|
|
|
hrSystem |
host.1 |
System time and uptime of the host, logged-in users, |
|
|
and number of active processes |
hrStorage |
host.2 |
Details on all storage media such as swap, hard drives, |
|
|
removable media, and main memory |
hrDevice |
host.3 |
List of available devices and their properties: apart |
|
|
from details on the processor, network interfaces, |
|
|
printer and DVD-/CD-ROM drives, there is also infor- |
|
|
mation on hard drives, their partitioning, file systems, |
|
|
mount points and file system types |
hrSWRun |
host.4 |
All running processes including PID and command |
|
|
line parameters |
hrSWRunPerf |
host.5 |
CPU usage and memory usage for the processes from |
|
|
hrSWRun |
hrSWInstalled |
host.6 |
Installed software; the information originates from |
|
|
the RPM database (unfortunately this does not work |
|
|
in Debian). |
Group |
OID |
Directive |
description |
|
|
|
|
prTable |
ucdavis.2 |
proc |
details of running processes |
memory |
ucdavis.4 |
– |
Memory and Swap space load, as in |
|
|
|
the program free |
5 http://www.ibr.cs.tu-bs.de/cgi-bin/sbrowser.cgi
188

11.2 NET-SNMP
continued
Group |
OID |
Directive |
description |
|
|
|
|
extTable |
ucdavis.8 |
exec |
Information on self-defined com- |
|
|
|
mands in the configuration file6 |
dskTable |
ucdavis.9 |
disk |
Information on file systems, see ex- |
|
|
|
ample in the text |
laTable |
ucdavis.10 |
load |
System load |
ucdExperi- |
ucdavis.13 |
– |
Experimental extension containing an |
mental |
|
|
entry with lm-sensor information, |
|
|
|
among other things |
fileTable |
ucdavis.15 |
file |
Information on files to be explicitly |
|
|
|
monitored |
version |
ucdavis.100 |
– |
Details on the NET-SNMP version and |
|
|
|
the parameters with which the dae- |
|
|
|
mon was compiled |
While mib-2.host only specifies absolute values, such as for file systems, UCD- SNMP-MIB also allows threshold values to be set for agent pages, which then explicitly generate an error value (dskErrorFlag) with error text (dskErrorMsg):
user@linux:˜$ snmpwalk -v1 -c public localhost ucdavis.dskTable |\ grep ’.2 =’
UCD-SNMP-MIB::dskIndex.2 = INTEGER: 2 UCD-SNMP-MIB::dskPath.2 = STRING: /net/swobspace/b UCD-SNMP-MIB::dskDevice.2 = STRING: /dev/md6 UCD-SNMP-MIB::dskMinimum.2 = INTEGER: -1 UCD-SNMP-MIB::dskMinPercent.2 = INTEGER: 10 UCD-SNMP-MIB::dskTotal.2 = INTEGER: 39373624 UCD-SNMP-MIB::dskAvail.2 = INTEGER: 1694904 UCD-SNMP-MIB::dskUsed.2 = INTEGER: 35678636 UCD-SNMP-MIB::dskPercent.2 = INTEGER: 95 UCD-SNMP-MIB::dskPercentNode.2 = INTEGER: 1 UCD-SNMP-MIB::dskErrorFlag.2 = INTEGER: 1
UCD-SNMP-MIB::dskErrorMsg.2 = STRING: /net/swobspace/b: less than 10% free (= 95%)
The grep ’.2 =’ filters all entries on the second device from the snmpwalk output, the Linux software-RAID /dev/md6. The entry dskPercent shows the current load of this data medium. An error exists if dskErrorFlag contains the value 1 instead of 0; dskErrorMsg adds a readable message to the error message. It can be assumed from this that the agent is being configured so that it will announce an error if free capacity falls below 10 percent.
6 Any executable programs can be used here.
189
11 Collecting Information Relevant for Monitoring with SNMP
The configuration file snmpd.conf
Configuring the agent is done in the file snmpd.conf, which is either located in the directory /etc directly (the case for SUSE) or in /etc/snmp (Debian), depending on the distribution.
Authentication and security
As the first step towards a finely tuned access control, you first need to define who should have access to which community:
# (1) source addressesQuelladressen
com2sec |
localnet |
192.168.1.0/24 public |
|
com2sec |
localhost |
127.0.0.1 |
public |
com2sec |
nagiossrv |
192.168.1.9 |
public |
com2sec links the source IP addresses to a community string (the SNMP password). This keyword is followed by an alias for the IP address range, the address range itself, and then a freely selectable community string, for which we will use public here, to keep things simple.7 192.168.1.0/24 refers to the local network; the Nagios server itself has the IP address 192.168.1.9. If you set access permissions for the alias localnet later on, they will apply to the entire local network 192.168.1.0/24, but if you reference nagiossrv when doing this, they will only apply to the Nagios server itself.
Then the defined computers and networks are assigned via their aliases to groups which have different security models:
# (2) assignment of group - security model - source-IP alias
group |
Local |
v1 |
localhost |
group |
Nagios |
v1 |
nagiossrv |
The keyword group is followed first by a freely selectable group name: here we define the group Local with the security model v1, which belongs to the address range defined as localhost, and the group Nagios with the same security model contained in the Nagios server.
You can choose from v1 (SNMPv1), v2c (community-based SNMPv2), and usm (the User Model from SNMPv3) as the security model. If you assign a computer or a network several security models at the same time, then separate entries with the same group name are required:
group |
Nagios |
v1 |
nagiossrv |
group |
Nagios |
usm |
nagiossrv |
7 See also page 186.
190

11.2 NET-SNMP
With the definition of views (keyword view) the view from the outside can be restricted precisely to partial trees of the Management Information Base. Each view here is also given a name for referencing:
#(3) View definition for partial trees of the SNMP namespace
view all |
included .1 |
view system included .iso.org.dod.internet.mgmt.mib-2.system
The reference included includes the following partial tree in the view. Thus the view all covers the entire tree (.1). If you want to exclude certain partial trees in this, then the keyword excluded is used:
view |
all |
included |
.1 |
view |
all |
excluded |
.iso.org.dod.internet.private |
The partial tree beneath private in all is now blocked, such as the MIB ucdavis
(private.enterprises.ucdavis).
One interesting feature is the mask; it specifies in hexadecimal notation which nodes correspond exactly to the subtree:
view all |
included .iso.org.dod.internet.mgmt |
F8 |
All places of the queried OID, for which the mask contains a 1 in binary notation, must be identical in the queried partial tree to the OID specified here,
.iso.org.dod.internet.mgmt, otherwise the daemon will refuse access and not provide any information. .iso.org.dod.internet.mgmt is written numerically as .1.3.6. 1.2.
Thanks to the mask F8,8 binary 11111000, the first five places from the left in the OID must always be .iso.org.dod.internet.mgmt. If somebody queried an OID (such as the private tree .1.3.6.1.4), which deviates from this, the agent would remain silent and not provide any information. If you leave out the mask detail, FF will be used.
If you have defined the alias, community, security model, and view, you just need to bring them together for the purpose of access control. This is done with the access instruction:
# (4) Definition of the access control |
|
|
|
|
||
access Local |
any |
noauth |
exact |
all |
none |
none |
access NagiosGrp |
any |
noauth |
exact |
all |
none |
none |
The access restrictions are bound to the group. The context column remains empty (””), since only SNMPv3 requires it.9 As the security model, you then normally
9 |
F= 1·2 |
|
+1·2 |
|
+1·2 |
|
+1·2 |
|
= 1111, 8=1000 |
8 |
|
3 |
|
2 |
|
1 |
|
0 |
|
Corresponding descriptions on SNMPv3 would go beyond the bounds of this book.
191

11 Collecting Information Relevant for Monitoring with SNMP
choose any, but you may define a specific model with v1, v2c or usm, since several different security models may be assigned to a group, as shown in the discussion of “Authentication and Security” at the beginning of this Section. The fifth column specifies the security level, which is also of interest only for SNMPv3. In the other two security models (we are only using v1), noauth is given here. The fourth last column also has just one meaning in SNMPv3. But since you must enter a valid value forSNMPv1 and SNMPv2c as well, then exact is chosen here.
The last two columns specify which view should be used for which access (read or write). In the example, the groups Local and NagiosGrp obtain read access for the view all, but no write access. The final column defines whether the agent should send SNMP traps—that is, active messages, to the manager—for events that occur within the range of validity of the view. Section 14.6 from page 260 goes into more detail about SNMP traps.
With the configuration described here, you can now exclusively access the Nagios server and localhost via SNMPv1 for information. The server access can be restricted further by defining a view that makes only parts of the MIB visible. But you should only try this once the configuration described is working, to avoid logical errors and time-consuming debugging.
System and local information
The partial tree mib-2.system provides information on the system itself and on the available (that is, implemented) MIBs. With syslocation you can specify where a system is located in the company or on the campus, and after the keyword syscontact you enter the e-mail address of the administrator responsible:
# (5) mib-2.system
syslocation Server room Martinstr., 2nd rack from the left syscontact root <wob@swobspace.de>
As long as you do not redefine the parameters sysname and sysdescr at this point, the corresponding MIBs in the default will reveal the host name and/or the system and kernel specification, corresponding to uname -a:
user@linux:˜$ snmpwalk -v1 -c public localhost system system.sysDescr.0 = STRING: Linux swobspace 2.6.10 #20 SMP Mon Dec 27 11:55:25 CET 2004 i686
system.sysObjectID.0 = OID: NET-SNMP-MIB::netSnmpAgentOIDs.10 system.sysUpTime.0 = Timeticks: (1393474) 3:52:14.74 system.sysContact.0 = STRING: root <wob@swobspace.de> system.sysName.0 = STRING: swobspace
system.sysLocation.0 = STRING: Serverraum Martinstr., 2. Rack von links
...
192

11.2 NET-SNMP
Defining processes to be monitored
Processes that you want to monitor using SNMP are specified with the proc directive, and if required you can specify the minimum or maximum number of processes:
#(6) Processes: enterprises.ucdavis.procTable
#proc process maximum minimum
#proc process maximum
#proc process
proc sshd proc nmbd 2 1 proc smbd proc slapd
If the entry for maximum and minimum is missing, at least one process must be running. If only the minimum is omitted, NET-SNMP will define this with zero processes. The corresponding entries end up in the MIB ucdavis.prTable; in case of error you will receive an error flag (prErrorFlag and an error description (prErrMessage) (which unfortunately you cannot define yourself):
user@linux:˜$ snmpwalk -v1 -c public localhost prTable
...
prTable.prIndex.4 = INTEGER: 4 prTable.prNames.4 = STRING: slapd prTable.prMin.4 = INTEGER: 0 prTable.prMax.4 = INTEGER: 0 prTable.prCount.4 = INTEGER: 0 prTable.prErrorFlag.4 = INTEGER: 1
prTable.prErrMessage.4 = STRING: No slapd process running.
...
ucdavis.prTable only reveals the configured processes; on the other hand it allows mib-2.host.hrSWRun and mib-2.host.hrSWRunPerf in general to query all running processes. If you want to prevent this, the view must exclude the area you do not want.
Your own commands
With the exec directive you can specify commands in the extension ucdavis.extTable, which the agent will execute in the corresponding queries. The result then appears in the relevant entries. In the following example the agent calls /bin/echo if it is asked for ucdavis.extTable:
#(7) your own commands: enterprises.ucdavis.extTable
#exec name command arguments
exec echotest /bin/echo hello world
193

11 Collecting Information Relevant for Monitoring with SNMP
The program to be executed must appear with its absolute path in the configuration. Running snmpwalk provides only the following:
user@linux:˜$ snmpwalk -v1 -c public localhost extTable extTable.extEntry.extIndex.1 = INTEGER: 1 extTable.extEntry.extNames.1 = STRING: echotest extTable.extEntry.extCommand.1 = STRING: /bin/echo hello world extTable.extEntry.extResult.1 = INTEGER: 0 extTable.extEntry.extOutput.1 = STRING: hello world
...
extTable.extEntry.extResult contains the return value of the command executed, and extTable.extEntry.extOutput contains the text output.
With the exec directive you can thus query everything that a local script or program can find out. This could be a security problem, however: if the programs used are susceptible to buffer overflows, this feature could be misused as a starting point for a denial-of-service attack.
Monitoring hard drive capacity
The disk directive is suitable for monitoring file systems. The keyword disk is followed by the path for a mount point, and then the minimum hard drive space in kBytes or in percent that should be available. If you omit the capacity entry, at least 100 MBytes must be available; otherwise an error message will be given.
In the following example the free capacity in the / file system should not drop below 10%, and on /usr, at least 800 MBytes10 should remain free:
#(8) File systems: enterprises.ucdavis.dskTable #disk mount point
#disk mount point minimum_capacity_in_kbytes #disk mountpoint minimum_capacity_in_percent% disk / 10%
disk /usr 819200 disk /data 50%
As far as the data partition /data is concerned, the alarm should be raised if free capacity falls below 50%. dskErrorFlag in this case contains the value 1 instead of 0, and dskErrorMsg contains an error text:
...
UCD-SNMP-MIB::dskPercent.3 = INTEGER: 65
UCD-SNMP-MIB::dskErrorFlag.3 = INTEGER: 1
UCD-SNMP-MIB::dskErrorMsg.3 = STRING: /data: less than 50% free (= 65%)
...
10 1024kBytes 800
194

11.2 NET-SNMP
dskPercent reveals a current load of 65%. Instead of the partial tree configured here, ucdavis.dskTable, mib-2.host.hrStorage also provides an overview of all file systems, even those not explicitly defined. These are missing percentage details, however, and you do not receive an error status or error message, as supplied by ucdavis.dskTable.
You should think hard about whether you set the warning limit in the NET-SNMP or in the Nagios configuration. In the first case you must configure the values on each individual host. If you query the percentage load, however, with the check_snmp plugin (see section 11.3.1 from page 196), then you set warning and critical limits centrally on the Nagios server, saving yourself a lot of work if you make changes later on.
The includeAllDisks directive adds all existing file systems to the dskTable table:
includeAllDisks 10%
It requires a minimum limit to be specified in percent, and also returns error values. An absolute specification in kBytes is not possible here. If you set warning and error limits centrally for check_snmp; (see Section 11.3.1 from page 196) the error attributes dskErrorFlag and dskErrorMsg are not queried, so that the value set here as the minimum limit can be ignored.
System load
The load directive queries the CPU load. As the limit values, you specify the average values for one minute, and optionally for five and 15 minutes:
#(9) System Load: enterprises.ucdavis.laTable
#load max1
#load max1 max5
#load max1 max5 max15
load 5 3 2
If the values are overstepped, laErrorFlag will contain the status 1 (otherwise: 0) and laErrMessage will have the text of the error message.
In a system that exceeds one of the specified limits, snmpwalk returns the following:
user@linux:˜$ snmpwalk -v1 -c public localhost laTable
...
UCD-SNMP-MIB::laNames.1 = STRING: Load-1
UCD-SNMP-MIB::laNames.2 = STRING: Load-5
UCD-SNMP-MIB::laNames.3 = STRING: Load-15 UCD-SNMP-MIB::laLoad.1 = STRING: 5.31 UCD-SNMP-MIB::laLoad.2 = STRING: 2.11
195

11 Collecting Information Relevant for Monitoring with SNMP
UCD-SNMP-MIB::laLoad.3 = STRING: 0.77
...
UCD-SNMP-MIB::laLoadInt.1 = INTEGER: 530
UCD-SNMP-MIB::laLoadInt.2 = INTEGER: 210
UCD-SNMP-MIB::laLoadInt.3 = INTEGER: 77 UCD-SNMP-MIB::laLoadFloat.1 = Opaque: Float: 5.310000 UCD-SNMP-MIB::laLoadFloat.2 = Opaque: Float: 2.110000 UCD-SNMP-MIB::laLoadFloat.3 = Opaque: Float: 0.770000 UCD-SNMP-MIB::laErrorFlag.1 = INTEGER: 1 UCD-SNMP-MIB::laErrorFlag.2 = INTEGER: 0 UCD-SNMP-MIB::laErrorFlag.3 = INTEGER: 0
UCD-SNMP-MIB::laErrMessage.1 = STRING: 1 min Load Average too high (= 5.31)
UCD-SNMP-MIB::laErrMessage.2 = STRING:
UCD-SNMP-MIB::laErrMessage.3 = STRING:
From laLoadInt.1 we are told the one-minute average value for the system load as an integer, from laLoad.1 as a string, and from laLoadFloat.1 as a floating-point decimal. laErrorFlag.1 contains the corresponding error status, laErrMessage.1 the corresponding error message. The same applies for the other two averages.
You can also use the check_snmp plugin here to query the floating-point decimal values just as accurately, and specify limit values centrally.
11.3 Nagios’s Own SNMP Plugins
Among the standard Nagios plugins there are three programs with which data can be obtained via SNMP: a generic plugin that queries any OIDs you want, and two Perl scripts that are specialized in interface data of network cards and the ports of switches, routers and so forth. In addition to this, the directory contrib contains the source code of other SNMP plugins that are not automatically installed. Apparently these are no longer maintained and cannot run without major adjustments to the code.
http://www.nagiosexchange.org/ also provides some useful specialized plugins, some of which are introduced in Section 11.4 from page 205. The following descriptions are limited, for reasons of space, to SNMPv1/2 queries; for SNMPv3specific options, we refer you to the online help for the corresponding plugin.
11.3.1 The generic SNMP plugin check_snmp
With check_snmp a generic plugin is available that queries all available information via SNMP, according to your requirements. However, its operation does require a degree of care, since as a generic plugin, it has no idea of specifically what data it is querying.
196

11.3 Nagios’s Own SNMP Plugins
For this reason as well, its output looks quite meager; specialized plugins provide more convenience here. But since these don’t exist for every purpose, check_snmp is then quite justified. It calls the program snmpget auf, which means that the NET-SNMP tools must be installed.
It provides the following options:
-H address / --host=address
This is the host name or IP address of the SNMP agent to be queried.
-o OID / --oid=OID
This is the object identifier to be queried, either as a complete numerical OID or as a string, which is interpreted by snmpget (e.g., system.sysName.0).
Attention: in contrast to snmpwalk, you must always specify the end nodes containing the information.
-p port / --port=port
This is the alternative port on which the SNMP agent is running. The default is UDP port 161.
-C password / --community=password
This is the community string for read access. The default value is public.
-w start:end / --warning=start:end
If the queried value lies within the range specified by start and end, check_ snmp does not give out a warning. For -w 0:90 it must therefore be larger than 0 and smaller than 90.
-c start:end / --critical=start:end
If the query value lies outside the range, the plugin gives out CRITICAL. If the warning and critical limits overlap, the critical limit always has priority.
-s string / --string=string
The contents of the queried OID must correspond exactly to the specified string, otherwise check_snmp will give out an error.
-r regexp / --ereg=regexp
This option checks the contents of the queried OID to see whether the regular expression regexp11 is matched. If this is the case, the plugin returns OK, otherwise CRITICAL.
-R regexp / --erexi=regexp
As -r, except that there is no case distinction.
-l prefix / --label=prefix
A string that is placed in front of the plugin response. The default is SNMP.
11 POSIX regular expression, see man 7 regex.
197

11 Collecting Information Relevant for Monitoring with SNMP
-u string / --units=string
SNMP only has simple values, not units. A string that is specified instead of string is extended by the plugin in the text output so that it serves the value as a unit. Because only text is involved here, you can also specify apples or pears, for example, as “units”.
-d delimiter / --delimiter=delimiter
This character separates the OID in the snmpget output from the value. The default is =.
-D delimiter / --output-delimiter=delimiter
The plugin is able to query several OIDs simultaneously. The result values are separated with delimiter, which in the default is a space.
-m mibs / --miblist=mibs
This specifies the MIBs that should be loaded for snmpget. The default is ALL.
-m +UCD-DEMO-MIB12 loads in addition, -m UCD-DEMO-MIB (without the + sign) only loads the specified MIB.13
-P version / --protocol=version
Defines the SNMP protocol version. The values for version are 1 or 3. Without this option, SNMPv1 is used.
SNMP provides almost unlimited possibilities, so the following examples can merely convey a feeling for other plugins used.
Testing hard drive capacity via SNMP
The following command queries the load of a file system and to do this accesses the partial tree ucdavis.dskTable of a locally running NET-SNMP agent:
nagios@linux:local/libexec$ ./check_snmp -H swobspace -C public \
-o dskTable.dskEntry.dskPercent.2 -w 0:90 -c 0:95 -u percent
SNMP WARNING - *95* percent
The query applies to the percentage load of the file system with the index number 2. As long as no more than 90 percent of the hard drive space is then occupied, the test should return OK; here a warning will be returned if it is between 91 and 95 percent, and critical status if it goes beyond this. Thanks to the -u option, check_snmp adds the description percent to the output of the figure determined.
Nevertheless, the plugin does not tell the whole truth: a test check with df shows a 96 percent load, which comes from the fact that this program correctly rounded
12UCD-DEMO-MIB is an MIB included for demonstration purposes.
13See also the online help, with man snmpcmd.
198

11.3 Nagios’s Own SNMP Plugins
up the actual 95.8 percent load, while integer values in SNMP are seldom rounded up, but simply cut off. So you just have to live with slight inaccuracies as long as the MIB does not provide any floating-point decimals.
If you would like things to be more detailed, you can use the option -l: -l ’SNMPDISK: /net/swobspace/b’ causes other, self-defined information to be added to the output of the above command:
SNMP-DISK: /net/swobspace/b WARNING - *95* percent
The above query can be more generally run through a command object such as the following:
define command{
command_name check_snmp
command_line $USER1$/check_snmp -H $HOSTADDRESS$ -C $USER3$ \ -P 1 -o $ARG1$ -w $ARG2$ -c $ARG3$ -l $ARG4$
}
This definition assumes that the value being queried is numerical, and not Boolean (see page 201), otherwise specifying a warning and critical value simultaneously would make no sense. We store the community here in the macro $USER3$.14 this is followed by the protocol version (-P 1 stands for SNMPv1), the OID, the warning and critical limits, and a prefix.
The call for this command in service definitions is then made in the form
check_snmp!oid!warn!critical!prefix
If you want to specifically monitor the load of the file system with the index number 2 on the computer swobspace through dskTable, then the following definition would be used:
define service{ |
|
service_description |
SNMP-DISK-a |
host_name |
swobspace |
check_command check_snmp!dskTable.dskEntry.dskPercent.2!\
0:90!0:95!DISK: /net/swobspace/a
...
}
Even though the check_command line is wrapped here, in practice all parameters must be on a single line, separated by an exclamation point ! (without spaces before or after the delimiter).
14 The $USERx$ macros are defined in the resource file resource.cfg.
199
11 Collecting Information Relevant for Monitoring with SNMP
Measuring temperature via lm-sensors
The next test checks the CPU temperature of the host. For the sensor, the package lm-sensors15 is used here, which accesses corresponding chips on modern mainboards. As soon as lm-sensors is active, it allows the NET-SNMP agents to read out the corresponding information from the partial tree ucdavis.ucdExperimental. lmSensors:
nagios@linux:local/libexec$ ./check_snmp -H localhost -C public \ -o lmTempSensorsValue.1 -w 25000:45000 -c 20000:48000 \
-u ’degrees Celsius (* 1000)’ -l ’Temp1/CPU’
Temp1/CPU OK - 41000 degrees Celsius (* 1000)
The output depends on the chipset: here you must multiply the query values by the factor 1000. Accordingly, you have no other alternative but to adjust the warning and critical limits to the main board you are using. In the example, the CPU temperature, 41 degrees Celsius, is “on a green light”: if it were to drop below 25 degrees or rise above 45 degrees, it would cause a warning, while below 20 or above 48 degrees, this would be critical.
Regular expressions and comparing fixed strings
You can check whether the text swobspace occurs in the system name as follows:
nagios@linux:local/libexec$ ./check_snmp -H localhost -C public \
-o system.sysName.0 -r swobspace
SNMP OK - "swobspace"
Instead of defining the string being searched for, with -r as the regular expression, you could also use the -s option. Then the text must match exactly, however, which may be quite tricky, since everything counts that snmpget outputs after the delimiter, =.
Monitoring network interfaces
The final example queries whether the first network interface of a Cisco router is in operation:
nagios@linux:local/libexec$ ./check_snmp -H cisco1 -C public \
-o ifOperStatus.1 -w 1:1 -l ’SNNP: Port Status for Port 1 is: ’
SNNP: Port Status for Port 1 is: OK - 1
15 http://www.lm-sensors.nu/
200

11.3 Nagios’s Own SNMP Plugins
The information sought can be found in ifOperStatus. Here we are querying port 1. While ifOperStatus gives out the operating status, ifAdminStatus reveals whether the interface is administratively switched on or off.
When specifying the warning limit here, we use the range 1:1, so that the plugin gives out a warning if the interface is physically switched off, and the return value is thus 0. We will do without the definition of a critical status here, since there are only two states, “on” or “off.” If the plugin returns a CRITICAL when the interface is switched off, you should use -c 1:1 and omit -w entirely.
If you just want to query the status of network interfaces, you should certainly take a look at the plugins check_ifstatus and check_ifoperstatus, described below, which provide slightly more operating convenience.
If MIB-II or MIB ucdavis do not provide the desired information, you could also take a look at the MIB provided by the manufacturer. You can find out from mib- 2.system in which partial tree the overall MIB is hidden:
user@linux:˜$ snmpwalk -v1 -c public konica01 system system.sysDescr.0 = Konica IP Controller system.sysObjectID.0 = OID: enterprises.2364
...
The example involves a network-capable Konica photocopying machine called konica01. system.sysObjectID.0 reveals that enterprises.2364 serves as the entry point for device specific details. With snmpwalk you can then obtain further information:
user@linux:˜$ snmpwalk -v1 -c public konica01 enterprises.2364
...
enterprises.2364.1.2.6.1.1.5.1.1 = "Ready to Print"
...
In the concrete case of this photocopier, you can query the current device status through enterprises.2364.1.2.6.1.1.5.1.1. Manufacturers usually store information on the implemented MIBs, so that you are not restricted to just guessing.
11.3.2 Checking several interfaces simultaneously
Active network components such as switches usually have quite a large number of ports, and it would be very time-consuming to check every single one of them. Here the check_ifstatus plugin is very useful, since it tests all ports simultaneously. It retrieves the information necessary for this via SNMP, and has the following options:
-H address / --host=address
This is the host name or IP address of the SNMP agent to be queried.
201

11 Collecting Information Relevant for Monitoring with SNMP
-C password / --community=password
This sets the community string for read access.
-p port / --port=port
This parameter is the alternative port on which the SNMP agent is running. The default is UDP port 161.
-v version / --snmp_version=version
This parameter specifies the SNMP version (1, 2, or 3) for the query.
-x list / --exclude=list
Use this to specify a comma-separated list of interface types that should not be queried (see example below).
-u list / --unused_ports=list
Use this to specify a comma-separated list of all ports that should be excluded from the test. Like -x, the list consists of the indices of the interfaces which are determined from ifIndex: -u 13,14,15,16.
-M bytes / --maxmsgsize=bytes
This is the maximum size of the SNMP data packets; the default is 1472 bytes.
With exclusion lists it is possible to exclude certain interface types or port numbers from the test, perhaps because these are not occupied, or are connected to PCs or other devices that are not always running.
With the following query we can find out, for example, which interface types are gathered together on the Cisco switch here named cisco01:
user@linux:˜$ snmpwalk -v1 -c public cisco01 ifType
...
interfaces.ifTable.ifEntry.ifType.12 = ethernetCsmacd(6) interfaces.ifTable.ifEntry.ifType.13 = other(1) interfaces.ifTable.ifEntry.ifType.14 = propVirtual(53)
...
If the interface types other(1) and propVirtual(53) should now be excluded, the plugin is sent off with the two figures, separated by a comma, as the exclusion list
-x 1,53:
nagios@linux:local/libexec$ ./check_ifstatus -C public -H cisco01 \
-x 1,53
CRITICAL: host ’cisco01’, interfaces up: 2, down: 10, dormant: 0, excluded: 4, unused: 0<BR>GigabitEthernet0/2: down <BR>GigabitEthernet0/3: down <BR>GigabitEthernet0/4: down <BR>GigabitEthernet0/10: down <BR>GigabitEthernet0/5: down <BR>GigabitEthernet0/11: down <BR>GigabitEthernet0/6: down
202

11.3 Nagios’s Own SNMP Plugins
<BR>GigabitEthernet0/7: down <BR>GigabitEthernet0/8: down <BR>GigabitEthernet0/9: down <BR> |up=2,down=10,dormant=0,excluded=4, unused=0
In reality, this plugin also does not display its output over several lines, as the line wrap here may suggest. The fact that this information appears on the Nagios Web interface in a relatively clear form is because the HMTL formatting element <BR> is thrown in. This causes the output for each port to be displayed on a separate line. The | character defines the beginning of the performance data, which does not appear at all in the Web interface.
A query of this type is implemented as a command object as follows:
define command{
command_name check_ifstatus
command_line $USER1$/check_ifstatus -H $HOSTADDRESS$ \ -C $USER3$ -x $ARG1$
}
Here the macro $USER3$ is also used to define the community string in the file resource.cfg. Altogether, 32 $USERx$ macros are available, of which the first two usually contain path details, and the others can be used in any way you want.
If you would prefer to exclude ports rather than interface types, you can use the -u option instead of -x in the definition.
If Nagios is to monitor the switch cisco01, as shown above, excluding the two interface types 1 and 53, the corresponding service definition begins as follows:
define service{ |
|
service_description |
Interfaces |
host_name |
cisco01 |
check_command |
check_ifstatus!1,53 |
... |
|
} |
|
11.3.3 Testing the operating status of individual interfaces
To test an individual interface, you can use either the generic plugin check_snmp or check_ifoperstatus, which specifically tests the operating status (ifOperStatus) of the network card. The advantage of this over the generic plugin consists above all in its ease of use: instead of an index for the port, you can also specify its description here—for example, eth0.
check_ifoperstatus has the following options:
-H address / --host=address
This is the host name or IP address of the SNP agent to be queried.
203

11 Collecting Information Relevant for Monitoring with SNMP
-C password / --community=password
This parameter gives the community string for read access.
-p port / --port=port
As long as the SNMP agent is not running on UDP port 161, the port is specified with this option.
-k ifIndex / --key=ifIndex
ifIndex is the number of the network interface to be queried (such as the network card of a computer or the port of a switch).
-d ifDescr / --descr=ifDescr
Instead of the index key, the plugin processes the name of the interface from ifDescr (see below).
-v version / --snmp_version=version
This specifies the SNMP version (1, 2, or 3) for the query.
-w return value / --warn=return value
This option selects the return value if the interface is dormant. The return value can be i (ignore the dormant status and return OK!), w (WARNING) or c (CRITICAL, the default).
-D return value / --admin-down=return value
What value (i, w or c) should the plugin return if the interface has been shut down administratively? The default, w, issues a warning, c returns CRITICAL, and i returns OK.
-M bytes / --maxmsgsize=bytes
This is the maximum size of the SNMP data packets; the default is 1472 bytes.
On a system called igate, on which snmpwalk finds the following interfaces . . .
...
interfaces.ifTable.ifEntry.ifDescr.3 = ipsec0 interfaces.ifTable.ifEntry.ifDescr.4 = ipsec1
...
interfaces.ifTable.ifEntry.ifDescr.7 = eth0 interfaces.ifTable.ifEntry.ifDescr.8 = eth1 interfaces.ifTable.ifEntry.ifDescr.9 = eth2 interfaces.ifTable.ifEntry.ifDescr.10 = ppp0
the first Ethernet card is tested either with -k 7 or with -d eth0. Since the plugin in the second case has to query all ifDescr entries to determine the index itself, this variation generates a somewhat higher network load. It can be especially useful if not all network interfaces are active on a host, causing its index to change.
204

11.4 Other SNMP-based Plugins
The plugin itself reveals which index this port currently has:
nagios@linux:local/libexec$ ./check_ifoperstatus -H igate -c public \
-d eth0
OK: Interface eth0 (index 7) is up.
As the command object in the Nagios configuration, the call looks like this:
define command{
command_name check_ifoperstatus
command_line $USER1$/check_ifoperstatus -H $HOSTADDRESS$ \ -C $USER3$ -d $ARG1$
}
The $USER3$ macro again contains the community string, defined in the file resource.cfg. The service definition for igate specifies the name of the interface to be tested as a plugin argument:
define service{ |
|
service_description |
Interface eth0 |
host_name |
igate |
check_command |
check_ifoperstatus!eth0 |
... |
|
} |
|
11.4 Other SNMP-based Plugins
Apart form the SNMP plugins from the Nagios Plugin package, the Nagios community provides a large variety of other plugins for special purposes. Most of them can be found at http://www.nagiosexchange.org/ in the category Check Plugins → SNMP.16
11.4.1Monitoring hard drive space and processes with nagios-snmp-plugins
One of these is the package nagios-snmp-plugins,17 which exists not only as source code but also as an RPM package (for Red Hat and Fedora). It contains two very easy-to-use plugins: check_snmp_disk and check_snmp_proc.
Both absolutely require the NET-SNMP agent as the partner on the other side (see Section 11.2.2 from page 187) and use ucdavis.dskTable and ucdavis.prTable to
16http://www.nagiosexchange.org/SNMP.51.0.html
17ftp://ftp.hometree.net/pub/nagios-snmp-plugins/
205

11 Collecting Information Relevant for Monitoring with SNMP
test the processes and file systems specified in the configuration file snmpd.conf. Its options are restricted to specifying the host and the community string:
-H address / --host=address
This is the host name or IP address of the NET-SNMP agent to be queried.
-C password / --community=password
This is the community string for read access.
The next example tests the available capacity of the /data file system; public is again used as the community string:
nagios@linux:local/libexec$ ./check_snmp_disk -H swobspace -C public
/data: less than 50% free (= 95%) (/dev/md6)
The configuration of the NET-SNMP agent specifies, with the disk directive (page 194), 50% as the threshold for this file system. In this case the plugin accordingly returns a CRITICAL. It can only distinguish between an error and OK; it does not have a WARNING status.
Using check_snmp_proc is just as easy:
nagios@linux:local/libexec$ ./check_snmp_proc -H localhost -C public
No slapd process running.
The plugin again tests the processes defined in the configuration of the NET-SNMP agent with the proc directive (page 193). The process slapd is missing here, which is why a CRITICAL is returned. The return value is revealed by echo $?.
The corresponding command objects are defined in a similar unspectacular way:
define command{
command_name check_snmp_proc
command_line $USER1$/check_snmp_proc -H $HOSTADDRESS$ -C $USER3$
}
define command{
command_name check_snmp_disk
command_line $USER1$/check_snmp_disk -H $HOSTADDRESS$ -C $USER3$
}
This definition also assumes that the community string is stored in the $USER3$ macro in the file resource.cfg. In order to query the NET-SMTPD on the computer linux01 for its hard drive load, the following service object is defined:
206

11.4 Other SNMP-based Plugins
define service{ |
|
service_description |
DISK |
host_name |
linux01 |
check_command |
check_snmp_disk |
... |
|
} |
|
11.4.2Observing the load on network interfaces with check-iftraffic
The MIB-II contains only numbers that provide information on the load on network interfaces, but no average values for the used bandwidth, for example. If the vendor has not specifically made such an entry available in his MIB, then you will always have to make a note of the last counter status and the timestamp, so that you can work out the relative usage yourself.
http://www.nagiosexchange.org/ introduces two plugins that take over this task. The Perl-based plugin check_traffic18 writes the query values into a round-robin database (RRD, see page 317), which makes it somewhat more complex to handle.
The same purpose is achieved, but with more simple means, by the check_iftraffic.pl plugin.19 It has the following options:
-H address / --host=address
address is the host name or IP address of the NET-SNMP agent that is to be queried.
-C password / --community=password
password is the community string for read access. The default is public.
-i ifDescr / --interface=ifDescr
From the interface name ifDescr the plugin determines the index so that it can access other values (e.g., the counter states).
-b integer / --bandwith=integer
This is the maximum bandwidth of the interface in bits (see -u).
-u unit / --units=unit
This is the unit for bandwidth specification with -b. Possible values are g (Gbit), m (Mbit), k (kbit) and the default b (bit): -b 100 -u m corresponds to 100 Megabits (Fast Ethernet).
18http://nagios.sourceforge.net/download/contrib/misc/check_traffic/
19http://www.nagiosexchange.org/SNMP.51.0.html?&tx_netnagext_pi1[p_view]=37
207

11 Collecting Information Relevant for Monitoring with SNMP
-w integer / --warning=integer
If traffic exceeds this warning limit in percent (default: 85 percent), the plugin issues a WARNING.
-c integer / --critical=integer
This is the critical threshold in percent (default: 92 percent).
The plugin saves the timestamp and counter status of the interface queried in files in /tmp, to which it adds the prefix traffic. So if you are using a different user ID than nagios for the manual test on the command line, you should delete the files /tmp/traffic_interface_computer before activating the appropriate Nagios service.
The following command line example queries the Fast Ethernet network interface eth0 on the computer linux01, which in theory has a bandwidth of 100 MBit:
nagios@linux:local/libexec$ ./check_iftraffic.pl -H linux01 -i eth0 \
-b 100 -u m
Total RX Bytes: 60.32 MB, Total TX Bytes: 26.59 MB<br> Average Traffic: 1.14 kB/s (0.0%) in, 777.93 B/s (0.0%) out | inUsage=0.0,85,98 outUsage =0.0,85,98
The amount of data transmitted here is reported separately by the plugin, depending on the direction, and here it announces 60.32 (RX, “received”) and 26.59 MBytes (TX, “transmitted”). The text contains the HTML element <br> (line break), to display the output in the Nagios Web interface on two lines. This is followed by the average transmission rate, again separated for incoming and outgoing data traffic. The performance data (see Section 17.1, page 314 pp.) after the | sign contain only the average load as a percentage, each separated by incoming and outgoing values. The numbers 85 and 98 are the default values for the warning and critical limits.
The corresponding command object is implemented as follows:
define command{
command_name check_iftraffic
command_line $USER1$/check_iftraffic.pl -H $HOSTADDRESS$ \ -C $USER3$ -i $ARG1$ -b $ARG2$ -u m
}
If the definition is taken over literally, you must define the community string in the $USER3$ macro. If you only generally use public as the password, it is better to write -C public instead of -C $USER3$.
To simplify the call of the command within the following service definition, we set the unit to MBit/second (-u m).
208

11.4 Other SNMP-based Plugins
define service{ |
|
service_description |
Traffic load eth0 |
host_name |
linux01 |
check_command |
check_iftraffic!eth0!100 |
...
max_check_attempts 1 normal_check_interval 5 retry_check_interval 5
...
}
check_iftraffic calculates the bandwidth used by comparing two counter states at different times. Because Nagios does not test exactly down to the second, the check interval you choose should not be too small. The Multi Router Traffic Grapher, 20 which displays the bandwidth used in graphic form, normally works at five-minute intervals.
If you select max_check_attempts other than 1, you should make sure that the retry interval (retry_check_interval) is the same as the normal check interval. For max_check_attempts 1 this makes no difference, but you have to define a retry_ check_interval at some time or other.
11.4.3The manubulon.com plugins for special application purposes
The Nagios Exchange, with the SNMP plugins to be found under http://www.manu bulon.com/nagios/ (see Table 11.4), also includes some that are customized to a specific application, such as querying hard drive space. They are relatively simple to use.
Two of the plugins—check_snmp_storage.pl and check_snmp_load.pl—are introduced here in detail.
Plugin |
Description |
|
|
check_snmp_storage.pl |
Query of storage devices (hard drives, swap space, |
|
main memory, etc.) |
check_snmp_int.pl |
Interface status and load |
check_snmp_process.pl |
processes: status, CPU and memory usage |
check_snmp_load.pl |
System load |
check_snmp_mem.pl |
main memory and swap usage |
check_snmp_vrrp.pl |
querying a Nokia-VRRP cluster21 |
20http://www.mrtg.org/
21The abbreviation VRRP stands for Virtual Router Redundancy Protocol.
Table 11.4:
The manubulon.comSNMP plugins
209
11 Collecting Information Relevant for Monitoring with SNMP
continued
Plugin Description
check_snmp_cpfw.pl querying a Checkpoint firewall-122
Keeping checks on storage media with check_snmp_storage
While the check_snmp_disk plugin, introduced in Section 11.4.1 from page 205, only checks the file systems entered in the NET-SNMP configuration, check_snmp_ storage.pl is capable of querying any storage media—even swap space or main memory—without previous configuration on the target host. check_snmp_storage.pl tests the partial tree mib-2.host here, while check_snmp_mem.pl uses ucdavis.memory, so that it remains restricted to NET-SNMP.
The fact that you do not have to battle with OIDs, but instead can work with descriptions of the swap space type to specify the type of the storage medium, provides a certain level of convenience. These can be queried with snmpwalk as follows:
user@linux:˜$ snmpwalk -v1 -c public swobspace hrStorageDescr hrStorageDescr.2 = STRING: Real Memory
hrStorageDescr.3 = STRING: Swap Space hrStorageDescr.4 = STRING: /
...
hrStorageDescr.11 = STRING: /net/swobspace/b
When the plugin is called, the text specified after the STRING: is sufficient or—if unique—a part of this:
nagios@linux:local/libexec$ ./check_snmp_storage.pl -H swobspace \
-C public -m /net/swobspace/b -w 90 -c 95
/net/swobspace/b : 91 %used (34842MB/38451MB) (< 90) : WARNING nagios@linux:local/libexec$ ./check_snmp_storage.pl -H swobspace\
-C public -m "Swap" -w 50 -c 75 -f
Swap Space : 0 %used (0MB/3906MB) (< 50) : OK | ’Swap Space’=0MB;1953; 2930;0;3906
In the second example, it is sufficient to specify Swap, in order to query the data for Swap Space, since the pattern is unique. The -f option ensures that check_snmp_storage.pl will include performance data in its output.
-w and -c specify in normal fashion the warning or critical limits in percent of the available memory space. The following overview lists all the options:
22 http://www.checkpoint.com/products/firewall-1/
210

11.4 Other SNMP-based Plugins
-H address / --host=address
This is the host name or IP address of the NET-SNMP agent that is to be queried.
-C string / --community=string
This is the community string for read access.
-p port / --port=port
port specifies an alternative port if the SNMP agent is not running on the default UDP port 161.
-m string / --name=string
string contains a description of the device to be queried, corresponding to its description in hrStorageDescr (see above), such as -m ”Swap Space” for swap devices, -m ”Real Memory” for the main memory, or -m ”/usr” for the partition mounted under /usr in the file tree.
-w percent / --warn=percent
A warning is given in the default if the proportion of used memory is larger than the specified threshold. Other warning limits can be defined with the -T parameter.
-c crit / --critical=crit
In the default, the status is categorized as critical if the proportion of used memory is larger than the specified critical limit. Other critical limits can also be specified with the -T parameter.
-T option / --type=option
Selection options for specifying the critical and warning limits:
pu (percent used): used capacity in percent pl (percent left): free capacity in percent bu (bytes used): used capacity in megabytes bl (bytes left): free capacity in megabytes
The default is -T pu.
-r / --noregexp
Normally the description in the -m parameter is treated as a regular expression. For example, /var here stands for all file systems containing /var, for example /var and /var/spool/imap, provided that these are really two independent file systems. The -r option switches off the regular expression capability, so that specifying /var will then match this file system exactly, but not /var/spool/imap, for example.
211

11 Collecting Information Relevant for Monitoring with SNMP
-s / --sum
Instead of individual tests for several named memories, these are first added together (user space and overall capacity), and only then is the test performed on the limit values.
-i / --index
With -m, a text is normally specified, which turns up again in the description hrStorageDescr. With the -i option, the index table is used instead of the description. Here the Regexp capability also applies: -m 2 matches all the entries containing the number 2 in the index (that is, 2, 12, 20, etc.). It then makes sense to use the -r option at the same time.
-e / --exclude
Now all the memories that are matched by the -m specification are excluded from the test, the remaining ones are included in the test.
-f / --perfparse
This option provides an additional output of performance data that is not shown in the Web interface but can be evaluated by additonal tools (see Chapter 17).
Testing system load with check_snmp_load
The plugin checks either the average system loaded against the usual specification of three averages of 1 min, 5 min, and 15 min, or the CPU loaded in percent.
-H address / --host=address
This is the host name or IP address of the NET-SNMP agent to be queried.
-C string / --community=string
This is the community string for read access.
-p port / --port=port
port is the alternative UDP port on which the SNMP agent is running. The default is UDP port 161.
-w warning limit / --warn=warning limit
The warning limit is given either as a simple integer value in percent (e.g. 90) or as an integer triplet separated by commas, which defines the thresholds for the system load average for one, five, and 15 minutes (e.g. 8,5,5). The percentage load, on the other hand, always refers to the CPU load of the last minute.
If the plugin queries a NET-SNMP agent, you must additionally specify the -L option in the second variation, for the percentage, -N.
212

11.4 Other SNMP-based Plugins
-c critical limit / --crit=critical limit
This specifies a critical limit; the syntax is the same as that for -w.
-L / --linux
This option specifies that the plugin queries the system mode of a Linux system via NET-SNMP.
-A / --as400
This option specifies that the CPU loaded on an AS/400 machine is queried.
-I / --cisco
This option specifies that the CPU load of a Cisco network component is involved.
-N / --netsnmp
If the plugin queries the percentage CPU load of a Linux system via NETSNMP, the -N option must be specified.
-f / --perfparse
This option ensures the output of performance data that is not displayed in the Web interface, but can be evaluated by additional tools (see Chapter 17).
The following example queries the system load on the computer swobspace via NET-SNMP and specifies threshold values for the one-, five-, and fifteen-minute averages:
nagios@linux:local/libexec$ ./check_snmp_load.pl -H swobspace \
-C public -w 1,2,3 -c 3,5,6 -L
Load : 0.05 0.07 0.06 : OK
nagios@linux:local/libexec$ ./check_snmp_load.pl -H swobspace \
-C public -N -w 80 -c 90 -f
CPU used 3.0 : < 80 : OK | cpu_prct_used=3%;80;90
The second example involves the percentage CPU load on the same machine. Here we additionally request performance data, which as usual repeats not only the measured value but also the thresholds.
213

12
Chapter
The Nagios Notification System
What would be the point of system and network monitoring if it did not inform the right contact partner when things went wrong? Hardly any system or network administrator can afford to keep an eye on the Nagios Web interface continually and wait for changes in status to occur. A practical working system must inform the admin actively (push information), so that the admin has time to devote to other things and needs to intervene only when Nagios raises the alarm.
Whether a notification system does its job in practice or not is ultimately decided by how well it can be adjusted to the requirements of a specific situation. What may already be a critical error for one person may, for another, not be normal but still tolerable, and nothing is worse than being bombarded with supposed error messages that are not even seen as errors in a certain environment. An excess of wrong information can make the administrator careless, and at some point the real problems get lost in a flood of false messages.
215
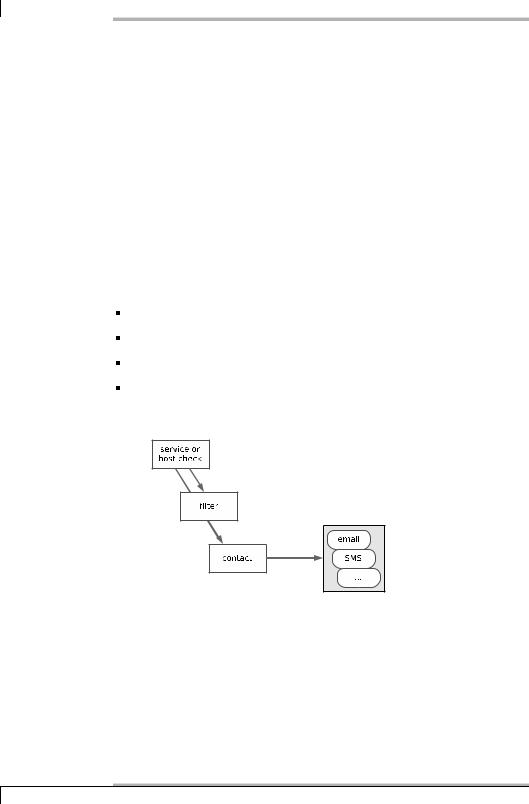
12 The Nagios Notification System
Nagios provides a sophisticated notification system allowing your own environment to be fine-tuned to your own requirements. The wide range of settings at first seem confusing, but once you have understood the basic principle, everything becomes much clearer.
The efforts to keep Nagios small and modular also apply to the notification system: sending a message is again left by the system to external programs: from a simple e-mail through SMS, down to hardware solutions—such as a real traffic light on the server cabinet—anything is possible.
12.1 Who Should be Informed of What, When?
In order for Nagios to send meaningful messages, the administrator must answer four questions:
When should the system generate a message?
When should it be delivered?
Whom should the system inform?
How should the message be sent?
Figure 12.1: An overview of the notification system
Figure 12.1 gives a rough outline of the concept. The service and host check generate the message, which then runs through various filters,1 which usually refer to the time. The contact refers to the person whom Nagios should inform. If the message has passed all tests, the system hands it to an external program, which informs the respective contact.
1Strictly speaking, filters defined in the host or service prevent a message from being created, instead of filtering already generated messages. To keep things simple, however, we pretend that Nagios has created a message that is then discarded by a corresponding filter.
216

12.2 When Does a Message Occur?
12.2 When Does a Message Occur?
Each message is preceded by a host or service check, which determines the current status. In the following two cases it generates a message:
One hard state changes to another hard state.
One computer or service remains in a hard error state. (The test therefore confirms a problem that already exists.)
To remind you: the max_check_attempts parameter (see Sections 2.3 and 2.5) defines in host and service objects how often a test should be repeated before Nagios categorizes a new status as “hard.” If it is set to 1, this is immediately the case and is followed by the corresponding message. With a value greater than 1, the system repeats the test that number of times, and only if they all come to the same new result—such as determining the CRITICAL error status—does the status finally change to the new hard state, thus triggering a new notification.
As long as Nagios has not exhausted the specified number of repeats, a soft state exists. If the old status reoccurs before these have finished, the administrator remains uninformed unless he looks at the Web interface or in the log file. Ultimately the administrator is only interested in genuine unsolved problems. On the other hand, to assess availability as such, it normally does matter if a service is not available for minutes on end, which is why the soft states are also taken into account in the evaluation.
12.3 The Message Filter
Even if you define on a systemwide basis that Nagios may bring attention to errors not just through the Web interface and log files but also via e-mail and/or SMS, filter parameters in the host and service definition may in individual cases cancel out these basic decisions. In all cases the final word is had by the filters defined for the relevant contact. Which parameters play a role on each of these three levels (systemwide, host/service, contact), is described in Figure 12.2.
If a filter stops a notification, the filter chain ends “in a vacuum,” so to speak—filter options further down in the hierarchy remain unaccounted for—and Nagios does not generate any message.
217
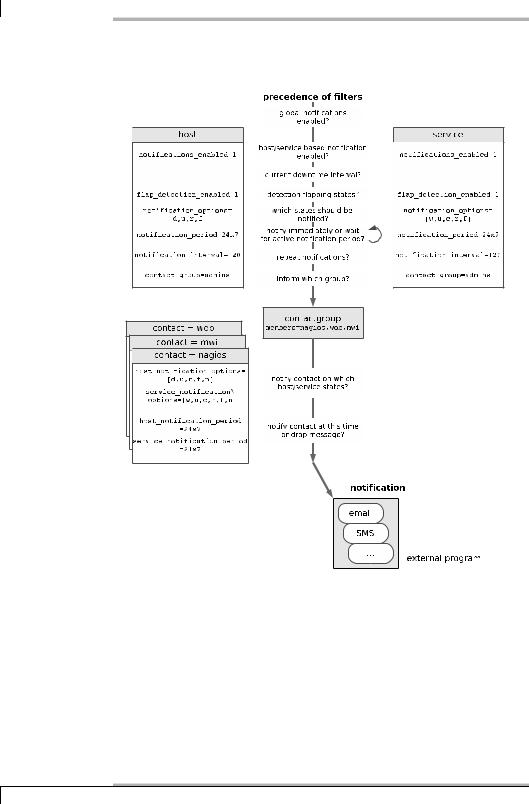
12 The Nagios Notification System
Figure 12.2: Sequence of filters in the Nagios notification system
12.3.1 Switching messages on and off systemwide
With the enable_notifications parameter in the central configuration file nagios. cfg, you can in principal define whether Nagios should send messages at all. Only if it is set to 1 will the notification system work:
enable_notifications=1
218

12.3 The Message Filter
12.3.2Enabling and suppressing computer and service-related messages
When defining a host or service, various parameters can influence the messaging system. Here you can define, for example, at what time Nagios should send messages, whether the contact person is regularly informed of error states, and about which states or changes in state he should be informed (just CRITICAL, or WARNING as well, etc.).
The switch notifications_enabled determines whether this specific computer or service is important enough for the admin to be informed of errors not just through the Web interface, but also in other ways as well. If this is so, the parameter must be set to 1:
notifications_enabled=1
This is also the case in the default, so that you have to set the value explicitly to 0 at this point to stop separate notifications.
Taking downtimes into account
At times when a specific service or host is intentionally not available, Nagios should certainly not send any error messages through the network. The configuration of corresponding maintenance periods (downtime scheduling) is only possible through the Web interface and is described in Section 16.3 from page 304.
What states and changes of state are worth a notification?
If a regular test shows that service or computer is changing its data continuously, this is called flapping in Nagios (see also Appendix A from page 401). If the flap_detection_enabled parameter is set to 1, the system tries to detect this situation.
Whether Nagios sends a message in this case depends on the notification_options filter. This decides on which states or changes of state Nagios will inform the contact involved. In host definitions it can have the following combinations of values, separated by commas: d (switched off or crashed, down), u (unreachable), r (computer again reachable, recovered), and f (quickly alternating state, flapping).
For service objects, notification_options recognizes the following states: c (CRITICAL), w (WARNING), u (UNKNOWN, unknown problem), r (service again reachable, recovered), and f (flapping). Nagios correspondingly informs the admin of the state of the service whose definition is contained in the line
notification_options=c,r
219
12 The Nagios Notification System
only if this is critical or was recreated after an error state. Messages involving a WARNING or flapping are discarded by the system.
If notification_options is set to n (none), Nagios will generally not send a message concerning this computer or service.
When should Nagios send messages?
At what time should a message be sent? This can be defined with the notification_period parameter:
notification_period=24x7h
notification_period expects a time object (see Section 2.10 from page 54) as the value; 24x7h is such a value and stands for “round the clock.”
Outside the specified time period, Nagios suppresses possible messages, but does not simply discard them, in contrast to the other filters. Instead of this, the system places the message in a kind of queue and sends it as soon as the notification period begins (rescheduling). This means that the relevant contact will certainly get to hear about the problem. Nagios also ensures that the admin receives the message only once, even if multiple messages on the same event were generated outside the time period.
notification_period is the only time-controlled filter in which a message is not lost, despite filtering. With all the other time filters, the message never reaches its destination outside the specified period of time.
With an interval check, Nagios can be instructed to report at regular intervals on problems that persist for a longer time:
notification_interval=120
If a state persists that Nagios should normally report, corresponding to the notification_option parameter—CRITICAL, for example—for a long time, the system would grant this wish, in the example, every 120 time units (normally, minutes). In other words it suppresses the notification that is generated anyway with every check, after a corresponding notification until the specified time has elapsed. If nothing has changed in the state until then, it then sends the corresponding notification.
If you set notification_interval to 0, Nagios will send a notification of this only once. You should be careful when doing this, however: filters defined for the contact can also reject messages. If you normally generate just one single message, which might arrive at the relevant admin outside the admin’s chosen contact time period, then the admin will never be told anything about the problem, even if it persists into working hours.
220

12.3 The Message Filter
Whose concern is the message?
The contact group defined in the host or service object does not itself belong to the message filters, but it still decides on who is informed and who is not:
contact_group=admins
What contacts belong to the specified group (here: admins) is defined by the corresponding contact_group object in its definition object (see also Section 2.8 from page 52):
# -- /etc/nagios/global/contactgroups.cfg define contactgroup{
contactgroup_name admins
alias |
administrators |
members |
nagios,wob,mwi |
}
The specified contact group, though, merely makes a rough preselection: which of the contacts specified in it actually receive the message depends on the filter functions in the definition of the individual contact. In this way you can ensure that one employee is only notified during normal office hours, another one round- the-clock, and that one of them is kept up to date about all changes in status, and the other one is informed only of a selection (for example, only CRITICAL but not WARNING).
12.3.3 Person-related filter options
When defining the contact objects, the method is also specified in which Nagios delivers the notification in specific cases (see Section 12.4 from page 224). It can be described separately for host and service problems. Several parallel methods are also possible, such as via e-mail and SMS.
Since the contact-related filters are specifically for the corresponding contact object, it can certainly be useful to define several contacts for one and the same recipient that differ in individual parameters, such as a contact object that keeps the person informed via e-mail of all problems during normal working hours, and a second one for SMS messages concerning critical events outside working hours.
What should Nagios inform you about?
The events for which somebody should be informed can be specified not only by host or service, but also by contact. Host and service-related states are defined separately here:
221

12 The Nagios Notification System
host_notification_options=d,u,r service_notification_options=c,r,u
The possible values are the same as those for the host-service parameter notification_options (page 219).
When do messages reach the recipient?
The final filter in the filter chain again refers to time periods. If a message is produced in the time period specified here, Nagios notifies the contact; otherwise it discards the message. The notification window can again be set separately for hosts and services, and as a value it expects a timeperiod object defined elsewhere:
host_notification_period=24x7 service_notification_period=workhours
12.3.4 Case examples
Letting you know once, but doing this reliably
What should you do if only a single message should be sent for each change in status of the service, but this message must always reach the relevant recipient during working hours? We can illustrate the solution to this problem through the example of the admins contact group to which the contact wob is assigned, . . .
define contactgroup{ contactgroup_name admins
alias |
Local Site Administrators |
members |
wob |
}
. . . and to the PING service for the computer linux01:
define service{ |
|
host_name |
linux01 |
service_description |
PING |
check_command |
check_ping!100.0,20%!500.0,60% |
max_check_attempts |
3 |
normal_check_interval |
2 |
retry_check_interval |
1 |
check_period |
24x7 |
notification_interval |
0 |
notification_period |
workhours |
notification_options |
w,u,c,r,f |
contact_groups |
admins |
} |
|
222

12.3 The Message Filter
notification_interval 0 normally forces Nagios not to produce any repeat messages. The notification_period ensures the desired time period through the timeperiod object workhours: if Nagios raises the alarm at other times, the inbuilt rescheduling is used, that is, the notification is sent on its way only if the specified time period again applies. It is definitely not discarded.
In order for Nagios to be active in all changes of state, the notification_options must always cover all possible events for services.
To guarantee that the contact wob always receives the messages, it is essential that the service_notification_period in the corresponding contact object is 24x7:
define contact{ |
|
contact_name |
wob |
alias |
Wolfgang |
host_notification_period |
24x7 |
host_notification_options |
d,u,r |
service_notification_period |
24x7 |
service_notification_options |
w,u,c,r,f |
... |
|
} |
|
A restricted time filter at this position could, under certain circumstances, lead to the loss of each of the individual messages. The same applies for the values of service_notification_options: only if all are entered here as well will no message be lost.
Informing different admins at different times
If you want to inform different persons at different times about different events, you may not restrict either the notification_period or the notification_options of a host or service:
define service{
...
notification_interval 120 notification_period 24x7 notification_options w,u,c,r,f
...
}
Filtering takes place exclusively for individual contacts. For this to work on a time level you must ensure that Nagios generates a message regularly (here every 120 time units, normally minutes) if error states persist.
If admin A is to be informed only during his working hours, and then only of changes to critical or OK states, A’s contact object will be sent with the following parameters:
223

12 The Nagios Notification System
define contact{
...
service_notification_period workhours service_notification_options c,r
...
}
There is also a second and not quite so obvious difference to the first example: let us assume that the service reports the CRITICAL status at 7.30 in the morning, which will persist for several hours. The workhours object is defined so that it describes the time from Monday to Friday between 8.00 and 18.00. In the above example, Nagios holds back the message (rescheduling), until the time period defined in it has been reached. The administrator therefore receives a corresponding message at 8.00.
In the case described here, no rescheduling takes place, Nagios generates a corresponding message every two hours, which is filtered out if the contact is currently taking a “break.” The system correspondingly discards the message at 7:30, but allows the next message two hours later to pass through. The administrator therefore does not receive the corresponding information until 9:30, provided that the problem still exists at this point in time.
Which of the two solutions is more suitable depends on specific requirements. For an e-mail notification, for example, it makes little difference if the administrator receives mails round-the-clock but reads them only when sitting in his office. A filter for Nagios messages in the mail client, sorting them in reverse chronological order (the most current mail first) makes sense in this case. Sitting in front of the screen, the administrator can also take a quick look at the Web interface when problems are announced, to check whether anything has changed.
If the methods of differentiation described so far are not sufficient, then escalation management, described in Section 12.5, may be of further help.
12.4 External Notification Programs
Which external programs deliver the messages is defined by thecontact definition.
Here there are again two parameters to define the commands to be used, one for services and one for hosts:
define contact{ |
|
... |
|
service_notification_commands |
notify-by-email,notify-by-sms |
host_notification_commands |
host-notify-by-email,host-notify-by-sms |
nagios-admin@localhost |
|
pager |
+49-1234-56789 |
address1 |
root@example.com |
224

12.4 External Notification Programs
address2 |
123-456789 |
... |
|
}
Both *_notification_commands allow comma-separated lists, so it is permitted to specify more than one command at the same time. The message is then sent simultaneously to the recipient in all the ways defined. The names of the command objects describe these ways: via e-mail and via SMS.
To achieve a better overview, the corresponding commands are not defined together with the plugin commands in the file checkcommands.cfg, but in a separate object file, misccommands.cfg. Nagios loads these like any other file with object definitions, which is why any name can be chosen for them.
The other parameters, email, pager, address1, and address2, can be regarded as variables. The delivery commands access the values set in these through macros. Whether pager contains a telephone number for SMS delivery or an e-mail address pointing to an e-mail SMS gateway is immaterial for the contact definition. The decisive factor is that the value matches the corresponding command that references this variable.
12.4.1 Notification via e-mail
In defining the notify-by-email command, a name and the command line to be executed is specified, as with every other command object. Only its length is unusual, which is why it has had to be line-wrapped several times for this printed version:
define command{ |
|
command_name |
notify-by-email |
command_line |
/usr/bin/printf "%b" "***** Nagios *****\n\n |
Notification Type: $NOTIFICATIONTYPE$\n\nService: $SERVICEDESC$\nHost: $HOSTALIAS$\nAddress: $HOSTADDRESS$\nState: $SERVICESTATE$\n\nDate/Time: $LONGDATETIME$\n\nAdditional Info:\n\n$SERVICEOUTPUT$" | /usr/bin/mail
-s "** $NOTIFICATIONTYPE$ alert - $HOSTALIAS$/$SERVICEDESC$ is $SERVICESTATE$ **" $CONTACTEMAIL$
}
The printed-out command object comes from the included example file misccommands.cfg-sample. The command line defined in it can be reduced in principle to the following pattern:
printf text | mail -s "subject" e-mail address
With the help of the macro, printf generates the message text, which is passed on to the mail program through a pipe. What is caused by the macros specifically
225

12 The Nagios Notification System
used is revealed in Table 12.1.2 Using this, the jumbo line shown above produces messages that look something like this:
To: wob@swobspace.de
Subject: ** PROBLEM alert - mail-WOB/SMTP is CRITICAL ** Date: Fri, 14 Jan 2005 16:22:47 +0100 (CET)
From: Nagios Admin <nagios@swobspace.de>
***** Nagios *****
Notification Type: PROBLEM
Service: SMTP
Host: mail-WOB
Address: 172.17.168.2
State: CRITICAL
Date/Time: Fri Jan 14 16:22:47 CET 2005
Additional Info:
CRITICAL - Socket timeout after 10 seconds
Table 12.1: Macros used in notify-by-email and host-notify-by-email
Macro |
Description |
|
|
$CONTACTEMAIL$ |
Value of the email parameter from the contact defi- |
|
nition |
$LONGDATETIME$ |
Long form of data specification, e.g., Fri Jan 14 |
|
16:22:47 CET 2005 |
$HOSTALIAS$ |
Value of the alias parameter from the host definition |
$HOSTADDRESS$ |
Value of the address parameter from the host defini- |
|
tion |
$HOSTNAME$ |
Value of the host_name parameter from the host |
|
definition |
$HOSTOUTPUT$ |
Text output of the last host check |
$HOSTSTATE$ |
State of the host: UP, DOWN, or UNREACHABLE |
$NOTIFICATIONTYPE$ Type of notification: PROBLEM (CRITICAL, WARNING, or UNKNOWN), RECOVERY (OK after error state), ACKNOWLEDGEMENT (an admin has confirmed the error state; see Section 16.1.2, page 278), FLAPPINGSTART or FLAPPINGSTOP
2 A complete list of all macros is contained in the original documentation at http://localhost/nagios/docs/macros.html (normally to be found in the file system under /usr/local/nagios/share/docs/macros.html).
226

|
|
12.4 External Notification Programs |
|
|
||
|
|
|
||||
|
|
|
|
|
|
|
|
continued |
|
|
|
|
|
|
|
|
|
|
|
|
|
Macro |
Description |
||||
|
|
|
|
|
|
|
|
$SERVICEDESC$ |
Value of the description parameter in the service def- |
||||
|
|
inition |
||||
|
$SERVICEOUTPUT$ |
Text output of the last service check |
||||
|
$SERVICESTATE$ |
State of the service: OK, WARNING, CRITICAL, UN- |
||||
|
|
KNOWN |
||||
For the command host-notify-by-email, the command line looks similar, except that now host-related macros are used:
/usr/bin/printf "%b" "***** Nagios *****\n\nNotification Type: $NOTIFICATIONTYPE$\nHost: $HOSTNAME$\nState: $HOSTSTATE$\nAddress: $HOSTADDRESS$\nInfo: $HOSTOUTPUT$\n\nDate/Time: $LONGDATETIME$\n" | /usr/bin/mail -s "Host $HOSTSTATE$ alert for $HOSTNAME$!" $CONTACTEMAIL$
It generates e-mails with the following content:
To: wob@swobspace.de
Subject: Host UP alert for wob-proxy!
Date: Fri, 14 Jan 2005 17:50:21 +0100 (CET)
From: Nagios Admin <nagios@swobspace.de>
***** Nagios *****
Notification Type: RECOVERY
Host: wob-proxy
State: UP
Address: 172.17.168.19
Info: PING OK - Packet loss = 0%, RTA = 69.10 ms
Date/Time: Fri Jan 14 17:50:21 CET 2005
12.4.2 Notification via SMS
While the infrastructure necessary for sending e-mails3 is usually available anyway, programs for sending SMS messages such as yaps,4 smssend,5 or smsclient6 usually have to be additionally installed. yaps and smsclient require a local modem or ISDN card and “telephone” directly with the cell phone provider (e.g., T-Mobile), smssend establishes a connection to the Internet servers of the cellphone provider and sends
3 |
Apart from the /usr/bin/mail client, a local mail server is required. |
4 |
http://www.sta.to/ftp/yaps/ |
5 |
http://zekiller.skytech.org/smssend_menu_en.html |
6 |
http://www.smsclient.org/ |
227

12 The Nagios Notification System
the SMS message on this route. With yaps und smsclient you can also use a mail gateway that generates and sends an SMS message from an e-mail.
Whichever method you choose, you should be aware of possible interference in sending messages: a connection between the Nagios server and the Internet passes through many hosts, routers, and firewalls. Especially if Nagios is itself monitoring one of the computers involved, things get interesting: if this machine is down, then a message sent via smssend will no longer work either. The same thing applies for e-mail-SMS gateways. Whether a self-made construction is involved, with yaps or smsclient, each of which represents its own SMS gateway, or a telecom installation with a sophisticated unified messaging solution, if the actual sender of the SMS is many nodes removed from the Nagios server (because you have a networked telephone installation with several locations, for example), the chances increase that the message will not reach its destination because of an interrupted connection.
For this reason the best solution is an smsclient or yaps installation on the Nagios server itself with a direct telephone access. In larger, networked telephone systems you can also consider giving the telephone access a dedicated, direct line from the telephone system. Whether this is ISDN or analog is just a question here of the technology used.
To represent the programs mentioned here, we will take a closer look at smsclient, which can be configured very simply, and has an active community. On its homepage you can also find a link to a mailing list whose members will be pleased to help in case you have questions.
Setting up smsclient
While Debian has its own precompiled smsclient package, for SuSE and other distributions you have to compile the software yourself. For historical reasons the program itself is called sms_client; a short subtext is provided with man sms_client.
The installation from the source code follows the usual procedure:
linux:˜ # cd /usr/local/src
linux:local/src # tar xvzf /path/to/sms_client-2.x.y linux:local/src # cd ./sms_client-2.x.y linux:src/sms_client-2.x.y # ./configure linux:src/sms_client-2.x.y # make && make install
The only point worth mentioning here is that the “homemade” configure procedure manages without autoconf and automake.
The configuration files listed in Table 12.2 are now located in the directory /etc/sms; the Debian package installs it to /etc/smsclient.
228

12.4 External Notification Programs
File |
Description |
|
|
sms_addressbook |
Definition of aliases and groups |
sms_config |
Main configuration file |
sms_daemons |
Configuration file for the daemon mode of smsclient, in |
|
which this can be reached via a proprietary protocol. Is not |
|
required. |
sms_modem |
Modem configuration |
sms_services |
Supported provider |
The file sms_services lists the supported providers and at the same time assigns them to the protocol used. The precise telephone number dialed is specified by the corresponding service file in the directory services (if you have compiled this yourself) or /usr/lib/smsclient/services (for Debian). In case of doubt, you should request the telephone number of your own mobile cell provider. The mailing list can also be of assistance here.
In the file sms_config you set a default provider, which the program uses for calls when the provider is not specifically given:
SMS_default_service = "d1"
Only the configuration of the modem is now missing in the file sms_modem. In principle, however, any modem that functions under Linux can be used. In the following example we address an ISDN card with the Isdn4Linux-HiSax driver:
MDM_lock_dir |
= |
"/var/lock" |
# directory for the lock files |
MDM_device |
= |
"ttyI0" |
# device name of the modem |
... |
|
|
|
MDM_command_prefix = |
"AT" |
|
|
MDM_init_command = |
"Z&E<MSN>" |
|
|
MDM_dial_command |
= |
"D" |
|
MDM_number_prefix = |
"0" |
# outside line, if required |
|
... |
|
|
|
/dev/ttyI0 is used as the device here; for MDM_init_command, your own MSN is used. This applies particularly to private branch exchanges, which allow a connection only if your own MSN has been correctly specified. Since Isdn4Linux does not recognize tone or pulse dialing, we use only D instead of the usual DT as the MDM_dial_command. If the ISDN connection requires an outside line as part of a phone exchange, you should enter the corresponding prefix; otherwise this string remains empty.
smsclient requires write permissions both for the device used and for the log file
/var/log/smsclient.log:
Table 12.2: smsclients configuration files
229
12 The Nagios Notification System
linux:˜ # touch /var/log/smsclient.log linux:˜ # chgrp dialout /usr/bin/sms client
linux:˜ # chgrp dialout /dev/ttyI0 /var/log/smsclient.log linux:˜ # chmod 2755 /usr/bin/sms client
linux:˜ # chmod 664 /dev/ttyI0 /var/log/smsclient.log
To test this, you should now send—preferably as the user nagios, who will later use smsclient—an SMS message to your own cellphone (here to be reached at the number 01604711):
nagios@linux:˜$ sms_client 01604711 "Text"
Dialing SMSC 01712521002...
WARNING: read() Timeout Connection Established. Login...
SMSC Acknowledgment received Login successful
Ready to receive message
Received Message Response: Message 3003123223 send successful - message submitted for processing<CR>
Successful message submission Disconnect...
Disconnected from SMSC Hangup...
d1 Service Time: 17 Seconds [000] d1:01604711 "Text" Total Elapsed Time: 17 Seconds
Getting Nagios to work together with smsclient
If the second argument is missing in smsclient, which contains the message text, the program will read it from STDIN:
nagios@linux:˜$ /bin/printf "%b" message | sms_client number
Based on the command notify-by-email, described from page 225, we will use the second variation here for defining the notify-by-sms command:
# ’notify-by-sms’ command definition define command{
command_name |
notify-by-sms |
command_line |
/usr/bin/printf "%.150s" |
"$NOTIFICATIONTYPE$ $HOSTNAME$[$HOSTADDRESS$]/$SERVICEDESC$ is $SERVICESTATE$ /$SHORTDATETIME$/ $SERVICEOUTPUT$" | /usr/bin/smsclient $CONTACTPAGER$
}
230

12.5 Escalation Management
As usual, the entire command_line is written on a single line. Nagios obtains the telephone number (or alias) through the macro $CONTACTPAGER$, which reads out the value of the pager parameter from the contact definition. Since an SMS here may not be longer than 150 characters, we will considerably abbreviate the information, compared to the e-mail message. To be on the safe side (you never know how long the plugin output ($SERVICEOUTPUT$) really is), the printf format specification .150 (instead of %b) cuts off the text after 150 characters. Although we then do without the line breaks in the message, by means of \n, an SMS is never formatted cleanly, due to its limited display. Thus notify-by-sms generates a one-line message of the following type:
PROBLEM elimail[172.17.130.1]/UPS is CRITICAL /2005-03-30 17:00:53/
Connection refused
12.5 Escalation Management
Whenever the administrators responsible cannot find a solution in the specified time when important components fail, although Service Level Agreements or other contracts commit the IT department to do this,7 Nagios’s ability to escalate notifications makes allowances for conflicts, at least on an organizational level. It can be used to provide multilevel support. For example, Nagios first informs the First Level Support (usually the Help Desk). If the problem still persists after one day, then the Second Level Support is notified, and so on.
Nagios also makes a distinction here between hostand service-related escalation stages. In essence, both function identically.
In the escalation, Nagios does not count in time units, but in how many messages it has already sent out. In the following example the system should report on error states of the Database service on linux01 every 120 minutes,8 and this, round-the- clock:
define service{ |
|
host_name |
linux01 |
service_description |
Database |
notification_period |
24x7 |
notification_interval |
120 |
... |
|
contact_groups |
admins |
} |
|
The corresponding messages always go to a contact group, so without escalation, that is to admins.
7 |
These can also be internal specialist departments. |
8 |
To be precise, every 120 time units, whereby the default time unit is 60 seconds. |
231

12 The Nagios Notification System
Figure 12.3: Nagios escalates, depending on the number of messages already sent
After the fourth notification, Nagios should switch on the first stage of escalation (as illustrated in Figure 12.3) and, in addition to admins, should notify the secondlevel contact group. The eighth message triggers the second level, at which Nagios informs the contact_group third-level.
As shown in Figure 12.3, escalations may certainly overlap. It can also be seen from the graphics that the contact group defined in the service object only applies as long as Nagios does not escalate. As soon as an escalation stage is switched on, the system puts the default contact group out of action.
If the original contact group—here admins—should also receive a message in the first escalation level, then this must be additionally specified in the escalation definition. If several levels overlap, Nagios informs all the groups involved. In Figure 12.3 the eighth to the tenth messages accordingly go both to admins and to second-level and third-level, while only the latter receives message numbers 11 and 12. From message number 13, Nagios keeps only the contact group admins informed, since escalation is no longer defined here.
The latter takes place via separate serviceescalation (for services) and hostescalation objects (for computers). For a service escalation object, Nagios requires the beginning and the end of exceptional circumstances to be defined, apart from service details (consisting of the service_description and host_name) parameters and the name of the contact groups responsible:
define serviceescalation{ host_name linux01 service_description Database first_notification 4 last_notification 10 notification_interval 60
contact_groups admins,second-level
}
The escalation level defined here starts, as desired, with message No 4 and ends with message No 10. If last_notification is given the value 0, the escalation only ends if the service changes back to the OK state.
232

12.5 Escalation Management
In addition you must specify the notification_interval parameter for service escalations: this changes the notification interval (previously 120 according to the service definition) to 60 time units. This parameter is also mandatory for a host escalation. The only difference in the definition of a hostescalation object is that instead of the host name, you can also specify one or more host groups (in addition the service_description parameter is dropped, of course).
The second escalation step is defined in the same way:
define serviceescalation{ host_name linux01 service_description Database first_notification 8 last_notification 12 notification_interval 90
contact_groups third-level
}
If there are overlapping escalations with different notification_intervals, Nagios chooses the smallest defined time unit in each case. Nagios therefore sends messages 8 to 10 at intervals of 60 minutes, numbers 11 and 12 at intervals of 90 minutes, and then the original interval of 120 minutes again applies.
With escalation_period and escalation_options there are two more setting parameters specially for escalations. Both have the same function as notification_ period and notification_options in the host or service definition, but they refer only to the escalation case.
In contrast to notification_interval, escalation_period does not replace the notification_period, but acts in addition to this. From the intersection of notification_ period and escalation_period, the actual time period is deduced. Suppose that notification_period refers to the time between 7:00 A:M and 5:00 P.M., and escalation_period to the period from 8:00 A.M. to 8:00 P.M.. Then Nagios will only send out messages in the escalation level between 8:00 A.M. and 5:00 P.M.. You must always remember here that it is only the number of messages that have already been sent that decides whether an escalation level exists. escalation_period and escalation_options only have an effect as additional filters.
Before these two parameters are used, you should carefully consider what it is you want to achieve with them. To restrict the escalation to a specific time period could under certain circumstances result in it being omitted entirely. If you restrict them to weekdays, for example, this would mean that if the Database service failed during the weekend, Nagios would inform the contact group admins only on Monday morning: over the weekend the system has already sent more than 12 messages, so it no longer even uses its escalation mechanism. If there is a time restriction via escalation_period, you should set last_notification to 0 to ensure that the escalation really does take place.
233

12 The Nagios Notification System
Every case of error is followed at some point in time by a recovery. An intelligent mechanism ensures that Nagios only notifies those contacts of the corresponding recovery who have previously been informed of an error state.
12.6Dependences between Hosts and Services as a Filter Criterion
If you test services with local plugins (see Chapter 7) via NRPE (see Chapter 10), all these tests will come to nothing the moment the Plugin Executor fails. With service dependencies you can prevent Nagios from flooding the appropriate administrator with messages on the dependent services. Instead of this, the system informs him specifically of the NRPE failure.
Aa with such service dependencies, Nagios also has host dependencies, which suppress messages, depending on individual hosts. Both variations can also be used to specifically ”switch off” tests.
12.6.1 The standard case: service dependencies
Let us take as an example the host linux01, illustrated in Figure 12.4, on which locally installed plugins, controlled via NRPE, monitor hard drive space (Disks service, see page 174), the number of logged-in users (Users service), and the system load (Load service). If NRPE were now to fail, Nagios would announce the CRITICAL state for all three services, although their actual state is unknown, and the real problem is the “NRPE daemon.”
In order to solve this contradiction, NRPE is defined and monitored as a separate service and describes the dependencies in a servicedependency object.
Figure 12.4: The three above-mentioned services depend on NRPE
To define the additional service check for NRPE, we make use of the possibility of calling the check_nrpe plugin (see page 166) (almost) without any parameters at all. It then simply returns the version of the NRPE daemons being used:
234

12.6 Dependences between Hosts and Services as a Filter Criterion
nagios@linux:˜$ /usr/local/nagios/libexec/check nrpe -H linux01
NRPE v2.0
The command defined in Section 10.4 on page 172, check_nrpe, requires further arguments and therefore cannot be used for our purposes. For this reason we set up a new command object, test_nrpe, which exclusively tests NRPE:
define command{ |
|
command_name |
test_nrpe |
command_line |
$USER1$/check_nrpe -H $HOSTADDRESS$ |
} |
|
With this, an NRPE service can now be defined:
define service{
host_name linux01 service_description NRPE check_command test_nrpe
...
}
The dependencies of the three local services of NRPE are described by the following servicedependency object.
define servicedependency{ |
|
host_name |
linux01 |
service_description |
NRPE |
dependent_host_name |
linux01 |
dependent_service_description |
Disks,Users,Load |
notification_failure_criteria |
c,u |
execution_failure_criteria |
n |
} |
|
host_name and service_description define the master service, the failure of which leads to the failure of the services named in dependent_service_description on the computer specified in dependent_host_name. Multiple entries, separated by commas, are possible for all four parameters mentioned. You should bear in mind, however, that each dependent service is dependent on every possible master service.
The remaining parameters influence service checks and notifications: notification_failure_criteria specifies for which states of the master service notifications involving an error of the dependent services (e.g., Disks) should not appear. Possible values are u (UNKNOWN), w (WARNING), c (CRITICAL), p (PENDING, i.e., an initial check is planned but was so far not yet carried out), o (OK), and n (None).
u,c in the example above means that Nagios does not inform the administrators responsible of “errors” in the services Disks, Users, and Load on linux01 if the master service is in the CRITICAL or UNKNOWN state. With an o for OK, the logic can
235
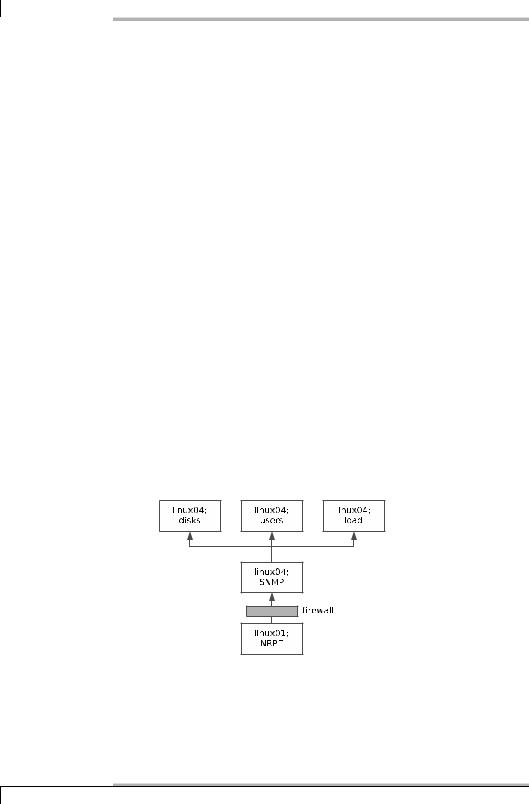
12 The Nagios Notification System
be reversed: here there is no message if there is an error in the dependent service, as long as the master service is in an OK state. Accordingly, n means that Nagios provides a notification irrespective of the status of the master service.
The execution_failure_criteria parameter controls tests, depending on the state of the master service. The details u (UNKNOWN), w (WARNING), c (CRITICAL), p (PENDING), o (OK), and n (None), as with notification_failure_criteria, refer to states of the master service for which there should be no check. In the example, n is specified, so that Nagios tests Disks, Users, and Load even if NRPE fails.
Nagios therefore suppresses messages, but since it still carries out the service checks on the dependent services, the Web interface always shows the current status of these.
The details for notification_failure_criteria interact with the Freshness mechanism of passive tests (see Section 13.4 from page 243). If check_freshness is used in the service definition, and if Nagios considers the most recently determined status to be out of date, it will carry out active tests even if it ought to suppress them, according to the service dependency.
Inheritance
Nagios does not automatically inherit dependencies. An example of this is shown in Figure 12.5: on the internal side of a firewall, the system should query various resources via SNMP. For security reasons, the test is performed indirectly via NRPE, that is, the Nagios server runs the SNMP plugins, which are installed on a host inside the file, indirectly via NRPE.
Figure 12.5:
Multilevel dependencies for services
The following two servicedependency objects describe a dependency between the SNMP (Master) service and the Disks service (dependent service) on the host linux04, as well as between the NRPE service on linux01 and the SNMP service on linux04:
236

12.6 |
Dependences between Hosts and Services as a Filter Criterion |
|
|
|
|
||||
|
|
|
|
|
define servicedependency{ |
|
|
|
|
host_name |
linux04 |
|||
service_description |
SNMP |
|||
dependent_host_name |
linux04 |
|||
dependent_service_description |
Disks |
|||
notification_failure_criteria |
c,u |
|||
execution_failure_criteria |
c,u |
|||
} |
|
|
|
|
define servicedependency{ |
|
|
|
|
host_name |
linux01 |
|||
service_description |
NRPE |
|||
dependent_host_name |
linux04 |
|||
dependent_service_description |
SNMP |
|||
notification_failure_criteria |
c,u |
|||
execution_failure_criteria |
c,u |
|||
} |
|
|
|
|
If the NRPE daemon on linux01 fails, Nagios would only recognize the defined dependencies between NRPE and SNMP, but not the implicit dependency between NRPE and Disks. To take these into account as well, the parameter inherits_parent is inserted in the definition of the service dependency between Disks and SNMP:
inherits_parent |
1 |
With this, Nagios tests whether the master service itself (here SNMP) is dependent on another service, thanks to a corresponding servicedependency. If the NRPE service on linux01 fails (CRITICAL state), Nagios leaves out the check of Disks on linux04, thanks to execution_failure_criteria c,u, and also does not send any notification of the most recently detected status of Disks.
Other application cases
Dependency definitions between services are particularly useful if a great deal depends on a single service, so that the actual problem is in danger of disappearing under a flood of error messages. Apart from the already described use in combination with NRPE, this applies for all services that the Nagios server cannot test directly and for which it must use tools instead (NRPE, SNMP, or even NSCLIENT for Windows, see Section 18.1). If a simple connection to the utility cannot be established and a constant value (version number, system name) cannot be queried, you can still use a generic plugin to address the corresponding port.
Another example of using service dependencies are the applications that depend on a database: a Web application with dynamic Web pages fails if the underlying database (which may be located somewhere in the network on another host) is not working. A precisely defined dependency between the database service and
237

12 The Nagios Notification System
dynamic Web application also ensures here that the administrator is notified of the actual cause.
12.6.2 Only in exceptional cases: host dependencies
Host dependencies function in principle exactly like service dependencies; the hostdependency object is also capable of suppressing messages.
There are a number of subtle differences in the detail, however. Only explicitly configured regular host checks can be suppressed in which checked intervals are defined as for services. This type of host check should be used only in exceptional circumstances, however, since it can have a significant influence on the performance of Nagios. Normally Nagios decides for itself when it will perform a host check (see Section 4.1 from page 72).
In nearly all cases the parents parameter in the host definition is better at describing the dependencies between hosts. As long as Nagios can test individual hosts directly, the system can distinguish much better between DOWN and UNREACHABLE (see Section 4.1 from page 72). If you do not want any notification for particular hosts, dependent on the network topology, then you should be informed only for DOWN, but not for UNREACHABLE.
Host dependencies should be used only when Nagios can no longer distinguish between DOWN and UNREACHABLE. This is usually the case when the host check is is performed indirectly (e.g., in Figure 12.1 on page 175).
238