


4
Chapter
Nagios Basics
The fact that a host can be reached, in itself, has little meaning if no service is running on it on which somebody or something relies. Accordingly, everything in Nagios revolves around service checks. After all, no service can run without a host. If the host computer fails, it also cannot provide the desired service.
Things get slightly more complicated if a router, for example, is brought into play, which lies between users and the system providing services. If this fails, the desired service may still be running on the target host, but it is nevertheless no longer reachable for the user.
Nagios is in a position to reproduce such dependencies and to precisely inform the administrator of the failure of an important network component, instead of flooding the administrator with irrelevant error messages concerning services that cannot be reached. An understanding of such dependencies is essential for the smooth operation of Nagios, which is why Section 4.1 will look in more detail at these dependencies and the way Nagios works.
71

4 Nagios Basics
Another important item is the state of a host or service. On the one hand Nagios allows a much finer distinction than just “ok” or “not ok”; on the other hand the distinction between soft state) and (hard state) means that the administrator does not have to deal with short-term disruptions that have long since disappeared by the time the administrator has received the information. These states also influence the intensity of the service checks. How this functions in detail is described in Section 4.3.
4.1 Taking into Account the Network Topology
How Nagios handles dependencies of hosts and services can be best illustrated with an example. Figure 4.1 represents a small network in which the Domain Name Service on proxy is to be monitored.
Figure 4.1: Topology of an example network
The service check always serves as the starting point for monitoring that is regularly performed by the system. As long as the service can be reached, Nagios takes no further steps; that is, it does not perform any host checks. For switch1, switch2, and proxy, such a check would be pointless anyway, because if the DNS service responds to proxy, then the hosts mentioned are automatically accessible.
If the name service fails, however, Nagios tests the computer involved with a host check, to see whether the service or the host is causing the problem. If proxy cannot be reached, Nagios might test the parent hosts entered in the configuration (Figure 4.2). With the parents host parameter, the administrator has a means available to provide Nagios with information on the network topology.
72
4.1 Taking into Account the Network Topology
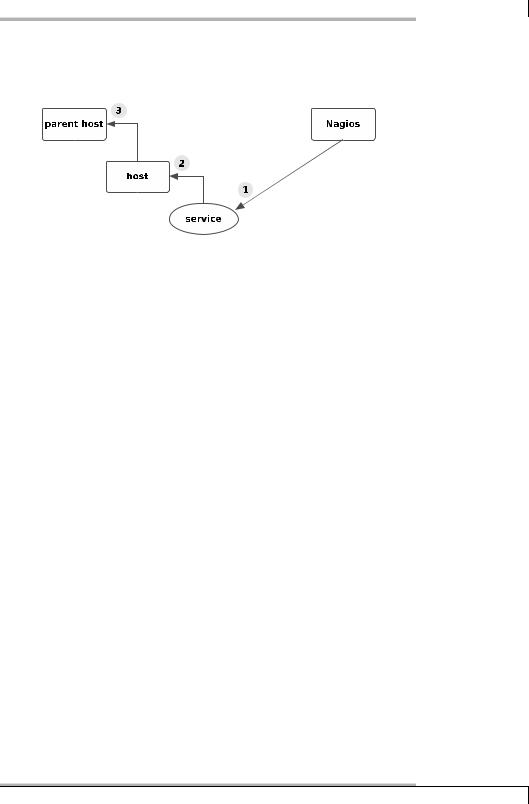
Figure 4.2:
the order of tests performed after a service failure
When doing this, the administrator only enters the direct neighbor computer fo each host on the path to the Nagios server as the parent.1 Hosts that are allocated in the same network segment as the Nagios server itself are defined without a parent. For the network topology from Figure 4.1, the corresponding configuration (reduced to the host name and parent) appears as follows:
define host{
host_name proxy
...
parents switch2
}
define host{
host_name switch2
...
parents switch1
}
define host{
host_name switch1
...
}
switch1 is located in the same network segment as the Nagios server, so it is therefore not allocated a parent computer. What belongs to a network segment is a matter of opinion: if you interpret the switches as the segment limit, as is the case here, this has the advantage of being able to more closely isolate a disruption. But you can also take a different view and interpret an IP subnetwork as a segment. Then a router would form the segment limit; in our example, proxy would
1The parameter name parents can be explained by the fact that there are scenarios—such as in high availability environments—in which a host has two upstream routers that guarantee the Internet connection, for example.
73

4 Nagios Basics
then count in the same network as the Nagios server. However, it would no longer be possible to distinguish between a failure of proxy and a failure of switch1 or switch2.
Figure 4.3: Classification of individual network nodes by Nagios
If switch1 in the example fails, Figure 4.3 shows the sequence in which Nagios proceeds: first the system, when checking the DNS service on proxy, determines that this service is no longer reachable (1). To differentiate, it now performs a host check to see what the state of the proxy computer is (2). Since proxy cannot be reached, but it has switch2 as a parent, Nagios also subjects switch2 to a host check (3). If this switch also cannot be reached, the system checks its parent, switch1 (4).
If Nagios can establish contact with switch1, the cause for the failure of the DNS service on proxy can be isolated to switch2. The system accordingly specifies the states of the host: switch1 is UP, switch2 DOWN; proxy, on the other hand, is UNREACHABLE. Through a suitable configuration of the Nagios messaging system (see Section 12.3 on page 217) you can use this distinction to determine, for example, that the administrator is informed only about the host that is in the DOWN state and represents the actual problem, but not about the hosts that are dependent on the down host.
In a further step, Nagios can determine other topology-specific failures in the network (so-called network outages). proxy is the parent of gate, so gate is also represented as UNREACHABLE (5). gate in turn also functions as a parent; the Internet server dependent on this is also classified as “UNREACHABLE”.
74

4.2 Forced Host Checks vs. Periodic Reachability Tests
This “intelligence”, which distinguishes Nagios, helps the administrator all the more, the more hosts and services are dependent on a failed component. For a router in the backbone, on which hundreds of hosts and services are dependent, the system informs administrators of the specific disruption, instead of sending them hundreds of error messages that are not wrong in principle, but are not really of any help in trying to eliminate the disruption.
4.2Forced Host Checks vs. Periodic Reachability Tests
Service checks are carried out regularly by Nagios, host checks only when needed. Although the check_interval parameter provides a way of forcing regular host checks, there is no real reason to do this. There is one reason not to do this, however: continual host checks have a considerable influence on the performance of Nagios.
If you nevertheless want to regularly check the reachability of a host, it is better to use a ping-based service check (see Section 6.2 from page 88). At the same time you will obtain further information such as the response times or possible packet losses, which provides indirect clues about the network load or possible network problems. A host check, on the other hand, also issues an OK even if many packets go missing and the network performance is catastrophic. What is involved here—as the name “host check” implies—is only reachability in principle and not the quality of the connection.
4.3 States of Hosts and Services
Nagios uses plugins for the host and service checks. They provide four different return values (cf. Table 6.1 on page 85): O (OK), 1 (WARNING), 2 (CRITICAL), and 3 (UNKNOWN).
The return value UNKNOWN means that the running of the plugin generally went wrong, perhaps because of wrong parameters. You can normally specify the situations in which the plugin issues a warning or a critical state when it is started.
Nagios determines the states of services and hosts from the return values of the plugin. The states for services are the same as the return values OK, WARNING, CRITICAL and UNKNOWN. For the hosts the picture is slightly different: the UP state describes a reachable host, DOWN means that the computer is down, and UNREACHABLE refers to the state of nonreachability, where Nagios cannot test whether the host is available or not, because a parent is down (see Section 4.1, page 72).
75

4 Nagios Basics
In addition to this, Nagios makes a distinction between two types of state: soft state and hard state. If a problem occurs for the first time (that is, if there was nothing wrong with the state of a service until now) then the program categorizes the new state initially as a soft state and repeats the test several times. It may be the case that the error state was just a one-off event that was eliminated a short while later. Only if the error continues to exist after multiple testing is it then categorized by Nagios as a hard state. Administrators are informed only of hard states, because messages involving short-term disruptions that disappear again immediately afterwards only add to an unnecessary flood of information.
In our example the chronological sequence of states of a service can be illustrated quite simply. A service with the following parameters is used for this purpose:
define service{ |
|
host_name |
proxy |
service_description |
DNS |
... |
|
normal_check_interval 5 retry_check_interval 1 max_check_attempts 5
...
}
normal_check_interval specifies at what interval Nagios should check the corresponding service as long as the state is OK or if a hard state exists—in this case, every five minutes. retry_check_interval defines the interval between two service checks during a soft state—one minute in the example. If a new error occurs, then Nagios will take a closer look at the service at shorter intervals.
max_check_attempts determines how often the service check is to be repeated after an error has first occurred. If max_check_attempts has been reached and if the error state continues, Nagios inspects the service again at the intervals specified in normal_check_interval.
Figure 4.4 represents the chronological progression in graphic form: the illustration begins with an OK state (which is always a hard state). Normally Nagios will repeat the service check at five-minute intervals. After ten minutes an error occurs; the state changes to CRITICAL, but this is initially a soft state. At this point in time, Nagios has not yet issued any message.
Now the system checks the service at intervals specified in retry_check_interval, here this is every minute. After a total of five checks (max_check_attempts) with the same result, the state changes from soft to hard. Only now does Nagios inform the relevant people. The tests are now repeated at the intervals specified in normal_check_interval.
76

4.3 States of Hosts and Services
Figure 4.4: Example of the chronological
progression of states in a monitored service
In the next test the service is again available; thus its state changes from CRITICAL to OK. Since an OK state is always a hard state, this change is not subject to any tests by Nagios at shorter intervals.
The transition of the service to the OK state after an error in the hard state is referred to as a hard recovery. The system informs the administrators of this (if it is configured to do so) as well as of the change between various error-connected hard states (such as from WARNING to UNKNOWN). If the service recovers from an error soft state to the normal state (OK)—also called a soft recovery—the administrators will, however, not be notified.
Even if the messaging system leaves out soft states and switches back to soft states, it will still record such states in the Web interface and in the log files. In the Web front end, soft states can be identified by the fact that the value 2/5 is listed in the column Attempts, for example. This means that max_check_attempts expects five attempts, but only two have been carried out until now. With a hard state, max_check_attempts is listed twice at the corresponding position, which in the example is therefore 5/5.
More important for the administrator in the Web interface than the distinction of whether the state is still “soft” or already “hard”, is the duration of the error state in the column Duration. From this a better judgment can be made of how large the overall problem may be.
For services that are not available because the host is down, the entry 1/5 in the column Attempts would appear, since Nagios does not repeat service checks until the entire host is reachable again. The failure of a computer can be more easily recognized by its color in the Web interface: the service overview in Figure 4.3 (page 66) marks the failed host in red; if the computer is reachable, the background remains gray.
77

5
Chapter
Service Checks and How They
Are Performed
To test services, Nagios makes use of external programs called plugins. In the simplest case this involves testing an Internet service, for example, SMTP. Here the service can be addressed directly over the network, so it is sufficient to call a program locally on the Nagios server that tests the mail server on the remote host.
Not everything you might want to test can be reached so easily over the network, however: there is no network protocol for checking free capacity on a hard drive, for example. Then you must either start a plugin on the remote host via a remote shell (but first this has to be installed on the remote computer), or you use other methods, such as the Simple Network Management Protocol SNMP, to test the hard drive capacity.
The fact that different methods are available here does not make it any easier in getting started with Nagios. For this reason, this chapter provides an overview of
79
5 Service Checks and How They Are Performed
the common methods and attempts to bring an understanding of the underlying concepts involved. Later chapters then provide detailed configuration examples.
Figure 5.1: Nagios allows different testing methods
Figure 5.1 shows an overview of the various test methods supported by Nagios. The upper box with a gray background marks all the components that run directly on the Nagios server machine: this includes the server itself, as well as plugins and other auxiliary tools. This unit is in contact with five clients, which are tested in various different ways. The following sections will go into somewhat more detail regarding the individual methods.
In order to monitor the network service on the first client marked as service (starting from the left), the Nagios server runs its “own” plugin, check_xyz (Section 5.1, page 81). For the second client it starts the “middle plugin” check_by_ssh, in order to execute the plugin it really wants remotely on the client (Section 5.2, page 82).
In the third case the plugin is also executed directly on the client machine, but now Nagios uses the NRPE service, created specifically for this purpose. The query is made on the Nagios side with check_nrpe (Section 5.3, page 82).
The fourth method describes the query via SNMP. For this, the client must have an SNMP agent available (Section 11.1, page 178). Various plugins are available for querying data via SNMP (Section 5.4, page 83).
These four methods represent “active” checks, because Nagios takes the initiative and triggers the test itself. The fifth method, in contrast, is passive. Here Nagios
80

5.1 Testing Network Services Directly
does nothing actively, but waits for incoming information that the client sends to the Nagios server with the program send_nsca. On the Nagios server itself the Nagios Service Check Acceptor, NSCA, is running as a daemon that accepts the transmitted results and forwards them to the interface for external commands. (Section 5.5, page 84).
There are other ways of performing checks in addition to these. Usually a separate service is installed on the client, which is then queried by the Nagios server via a specialized plugin. A typical example here is NSClient/NC Net, which can be used to monitor Windows servers (Section 18.1, page 354).
5.1 Testing Network Services Directly
Mail or Web servers can be tested very simply over the network, since the underlying protocols, SMTP and HTTP, are, by definition, network-capable (Figure 5.1, page 80, Client 1). Nagios can call here on a wide range of plugins, each specialized for a particular service.
Such a specific program has advantages over a generic one: a generic plugin tests only whether the corresponding TCP or UDP port is open and whether the service is waiting there, but it does not determine whether the correct service is on the port, or whether it is active.
Specific plugins adopt the network protocol and test whether the service on the port in question behaves as it is expected to. A Mail server, for example, normally responds with a so-called Greeting after a connection has been established:
220 swobspace.de ESMTP
The important thing here is the 220. A number in the 200 range means OK, 220 stands for the greeting. The check_smtp plugin evaluates this reply. It can also simulate the initial dialog when sending mail (in addition to the greeting), as shown in Section 6.3 from page 92.
It behaves in a similar way with other specific plugins, such as check_http, which not only can handle a simple HTTP dialog, but also manipulates HTTP headers where required, checks SSL capabilities and certificates of the Web server, and even sends data to the server with the POST command (more on this in Section 6.4 from page 97).
The package with the Nagios plugins, which is installed separately (see Section 1.2 from page 30), includes specific plugins for the most important network services. If one is missing for a specific service, it is worth taking a look at the Nagios homepage1 or the Exchange for Nagios Add-ons.2
1 |
http://www.nagios.org/ |
2 |
http://www.nagiosexchange.org/ |
81

5 Service Checks and How They Are Performed
If no suitable plugin can be found there either, you can use the generic plugins check_tcp or check_udp, which, apart from a pure port test, also send data to the target port and evaluate the response (but this only makes sense in most cases if an ASCII-based protocol is involved). More on generic plugins in Section 6.7.1 from page 110.
5.2Running Plugins via Secure Shell on the Remote Computer
To test local resources such as hard drive capacity, the load on the swap area, the current CPU load, or whether a specific process is running, various local plugins are available. They are called local because they have to be installed on the computer that is to be checked.
The Nagios server has no way to directly access such information over the network, without taking further measures. But it can start local plugins on the remote host, via a remote shell (Figure 5.1, page 80, Client 2). Only the Secure Shell, SSH, can be considered for use here; the Remote Shell, RSH, simply has too many security holes.
To do this, the Nagios server runs the program check_by_ssh, which is given the command, as an argument, to run the local plugin on the target host. For this, check_by_ssh needs a way of logging in to the target host without a password, which can be set up with Public Key Authentication.
From the viewpoint of the Nagios server, check_by_ssh is the plugin whose results are processed. It does not notice anything concerning the start of the secure shell connection and of the remote plugin—the main thing is that the reply corresponds to the Nagios standard and contains the status plus a line of comment text for the administrator, see the introduction to Chapter 6 on page 85.
Further information on the Remote Execution of plugins via Secure Shell is provided in Chapter 9 from page 157.
5.3 The Nagios Remote Plugin Executor
An alternative method of running plugins installed on the target computer via the secure shell is represented by the Nagios Remote Plugin Executor (NRPE). Figure 5.1 (page 80) illustrates this with the middle client.
The NRPE is installed on the target host and started via the inet daemon, which must be configured accordingly. If NRPE receives a query from the Nagios server via the (selectable) TCP port 5666, it will run the matching query for this. As with
82

5.4 Monitoring via SNMP
the method using the Secure Shell, the plugin that is to perform the test must be installed on the target host.
So all this is somewhat more work than using the Secure Shell, especially as SSH ought to be installed on almost every type of Unix machine and, when it is used, enables monitoring to be configured centrally on the Nagios server. The Secure Shell method requires an account with a local shell, however, thus enabling any command to be run on the target host3; the Remote Plugin Executor, on the other hand, is restricted to the commands configured.
If you don’t want the user nagios to be able to do anything more than run plugins on the target host without a password, than you are better off sticking with NRPE. The installation configuration for this is described in Chapter 10 from page 165.
5.4 Monitoring via SNMP
With the Simple Network Management Protocol, SNMP, local resources can also Be queried over the network (see also Client 4 in Figure 5.1, page 80). If an SNMP daemon is installed (NET-SNMPD is very extensively used, and is described in Section 11.2.2 from page 187), Nagios can use it to query local resources such as processes, hard drive and interface load.
The advantage of SNMP lies in the fact that it is widely used: there are corresponding services for both UNIX and Windows systems, and almost all modern network components such as routers and switches can be queried via SNMP. Even uninterruptable power supplies (USPs) and other equipment sometimes have a network connection and can provide current status information via SNMP.
Apart from the standard plugin check_snmp, a generic SNMP plugin, there are various specialized plugins that concentrate on specific SNMP queries but are sometimes more simple to use. So check_ifstatus and check_ifoperstatus, for example, focus precisely on the status of network interfaces.
If you are grappling with SNMP for the first time, you will soon come to realize that the term “readable for human beings” did not seem to be high up on the list of priorities when the protocol was defined. SNMP queries are optimized for machine processing, such as for a network monitoring tool.
If you use the tool available from the vendor for its network components, SNMP will basically remain hidden to the user. But to use it with Nagios, you have to get your hands dirty and get involved with the protocol and its underlying syntax. It takes some getting used to, but it’s not really as difficult as it seems at first sight.
3The Secure Shell does allow a single command to be executed without opening a separate shell. Usually, however, you will want to test several resources, so you’ll need to run more than one command.
83

5 Service Checks and How They Are Performed
The use of SNMP is the subject of Chapter 11 (page 177); you can also learn there how to configure and use an SNMP daemon for Linux and other UNIX systems.
5.5 The Nagios Service Check Acceptor
The fifth method of processing the results of service checks leads to the use of the Nagios Service Check Acceptor, NSCA. This runs as a daemon on the Nagios server and waits for incoming test results (see Figure 5.1 on the right on page 80). This method is also referred to as passive, because Nagios itself does not take the initiative.
NSCA uses the interface for external commands used by CGI scripts, among others, to send commands to Nagios. It consists of a named pipe4 from which Nagios reads the external commands. With the command PROCESS_SERVICE_CHECK_ RESULT Nagios processes test results that were determined elsewhere. The interface itself is described in more detail in Section 13.1 from page 240.
The main area of use for NSCA is Distributed Monitoring. By this we mean several different Nagios installations that send their results to a central Nagios server. The distributed Nagios servers, perhaps in different branches of a company, work as autonomous and independent Nagios instances, except that they also send the results to a head office. This does not check the decentralized networks actively, but processes the information sent from the branches in a purely passive manner.
NSCA is not just restricted to distributed monitoring, however. With the program send_nsca, test results can be sent which were not obtained from a Nagios instance, but rather from a cron-job, for example, which executes the desired service check.
Before you use NSCA, you should consider the security aspects. Because it can be used by external programs to send information and commands to Nagios, there is a danger that it could be misused. This should not stop you from using NSCA, but rather should motivate you into paying attention to security aspects during the NSCA configuration.
Further information on using NSCA, distributed monitoring and on security in general is provided in Chapter 14 from page 247.
4A named pipe is a buffer to which a process writes something and from which another process reads out the data. This buffer is given a name in the file system so that it can be specifically addressed, which is why it is called named pipe.
84